MUI v5 DataGridの使い方 その3 ~セルの縦線を表示する(不具合対応済み)~
前回に続いて、Vite+React+TypeScript 環境で MUI の DataGrid の使い方を、Tips的にまとめていきます。
MUI v5 DataGrid の記事一覧
MUI v5 DataGridの使い方 その1 ~基本の使い方から日本語化まで~
MUI v5 DataGridの使い方 その2 ~クリックできるアイコンセルを表示する~
MUI v5 DataGridの使い方 その3 ~セルの縦線を表示する(不具合対応済み)~
MUI v5 DataGridの使い方 その4 ~列ヘッダ、列の設定~
MUI v5 DataGridの使い方 その5 ~フッター~
MUI v5 DataGridの使い方 その6 ~グリッドのPropsの一覧~
MUI v5 DataGridの使い方 その7~有償版(Pro版)のエラー対応~
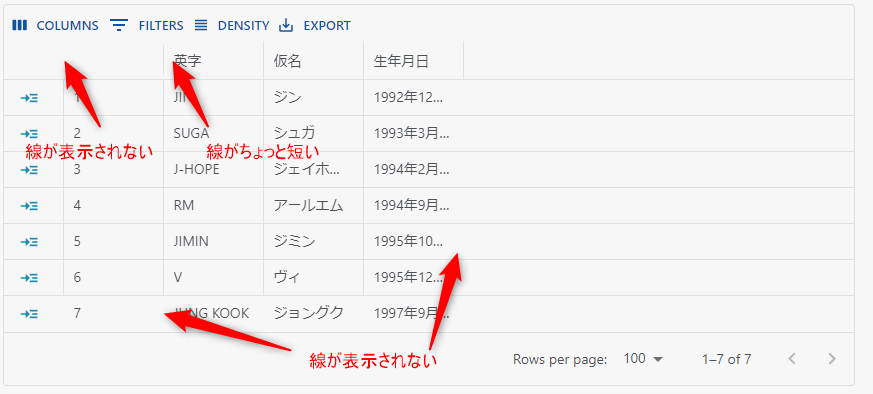
セルの右側に縦線を表示する
Grid に showCellRightBorder を指定するとセルの右側に線が表示できます。
が、バグっているのか最終行および最終列だけ線が表示されません。
列ヘッダのセルの右側はデフォルトで線が引かれていますが、Grid に showColumnRightBorder を指定すると、長めの線になります。
が、コチラは列タイトルが空白の場合の表示が微妙です。
import {
  DataGrid,
  GridColDef,
  GridRowsProp,
  GridToolbar,
} from '@mui/x-data-grid'


const rows: GridRowsProp = [
  { id: 1, name: 'JIN', kana: 'ジン', birth: '1992年12月4日' },
  { id: 2, name: 'SUGA', kana: 'シュガ', birth: '1993年3月9日' },
  { id: 3, name: 'J-HOPE', kana: 'ジェイホープ', birth: '	1994年2月18日' },
  { id: 4, name: 'RM', kana: 'アールエム', birth: '1994年9月12日' },
  { id: 5, name: 'JIMIN', kana: 'ジミン', birth: '1995年10月13日' },
  { id: 6, name: 'V', kana: 'ヴィ', birth: '1995年12月30日' },
  { id: 7, name: 'JUNG KOOK', kana: 'ジョングク', birth: '1997年9月1日' }
]

export function List() {
  // グリッド列情報
  const cols: GridColDef[] = [
    {
      field: 'id',
      headerName: ''
    },
    {
      field: 'name',
      headerName: '英字'
    },
    {
      field: 'kana',
      headerName: '仮名'
    },
    {
      field: 'birth',
      headerName: '生年月日'
    }
  ]

  return (
      <div style={{ width: '100%' }}>
        <DataGrid
          columns={cols}
          rows={rows}
          density="compact"
          autoHeight
          components={{
            Toolbar: GridToolbar,
          }}
          showColumnRightBorder // 列ヘッダセルの右側に線を引く
          showCellRightBorder   // セルの右側に線を引く
        />
      </div>
  )
}
autoHeight を指定するかによっても、表示されない罫線の場所が変わるようです。
この問題は issue に上がってます。
とりあえず修正版がでるまで、css で対応します。
列タイトルの罫線は showColumnRightBorder を指定し、
列タイトルがないセルは、列タイトルに全角スペースを指定します。
各セルは showCellRightBorder は指定せず、css で罫線を引きます。
ついでにヘッダのツールバーの下にも罫線を引きます。
import * as React from 'react'
import {
  DataGridPro,
  GridColDef,
  GridRowsProp,
  GridToolbar,
  GridActionsCellItem,
  GridRowParams
} from '@mui/x-data-grid-pro'
import { SvgIcon } from '@mui/material'
import { ReactComponent as godetail } from '@/assets/go_detail.svg'

const rows: GridRowsProp = [
  { id: 1, name: 'JIN', kana: 'ジン', birth: '1992年12月04日' },
  { id: 2, name: 'SUGA', kana: 'シュガ', birth: '1993年03月09日' },
  { id: 3, name: 'J-HOPE', kana: 'ジェイホープ', birth: '	1994年02月18日' },
  { id: 4, name: 'RM', kana: 'アールエム', birth: '1994年09月12日' },
  { id: 5, name: 'JIMIN', kana: 'ジミン', birth: '1995年10月13日' },
  { id: 6, name: 'V', kana: 'ヴィ', birth: '1995年12月30日' },
  { id: 7, name: 'JUNG KOOK', kana: 'ジョングク', birth: '1997年09月01日' }
]

export function List() {
  // アイコンをクリックしたときの処理
  const handleDetailClick = React.useCallback(
    (params: GridRowParams) => (event: { stopPropagation: () => void }) => {
      event.stopPropagation()
      console.log(`handleDetailClick:id=${params.id}`)
    },
    []
  )

  // 表示するアクションを返す関数です
  const getDetailAction = React.useCallback(
    (params: GridRowParams) => [
      <GridActionsCellItem
        icon={<SvgIcon component={godetail} sx={{ color: '#1e8cb0' }} />}
        label="編集"
        onClick={handleDetailClick(params)}
        color="inherit"
      />
    ],
    [handleDetailClick]
  )

  // グリッド列情報
  const cols: GridColDef[] = [
    {
      field: 'detailAction',
      headerName: ' ',  // セルの右側に罫線を表示するために全角スペースを表示する
      align: 'left',
      width: 60,
      type: 'actions',
      getActions: getDetailAction
    } as GridColDef,
    {
      field: 'id',
      headerName: ' ',  // セルの右側に罫線を表示するために全角スペースを表示する
      width: 50,
      headerAlign: 'center',
      align: 'right'
    },
    {
      field: 'name',
      headerName: '英字',
      width: 200,
      headerAlign: 'center',
      align: 'left'
    },
    {
      field: 'kana',
      headerName: '仮名',
      width: 200,
      headerAlign: 'center',
      align: 'left'
    },
    {
      field: 'birth',
      headerName: '生年月日',
      width: 150,
      headerAlign: 'center',
      align: 'center'
    }
  ]

  return (
      <div style={{ width: '100%' }}>
        <DataGridPro
          sx={styles.grid}     // --> 不具合対応のためcssで罫線を引く
          columns={cols}
          rows={rows}
          density="compact"
          autoHeight
          components={{
            Toolbar: GridToolbar,
          }}
	  showColumnRightBorder   // 列ヘッダセルの右側に線を引く
          // showCellRightBorder  // セルの右側に線を引く   --> 不具合対応のためcssで罫線を引く
        />
      </div>
  )
}

const styles = {
  grid: {
    '.MuiDataGrid-toolbarContainer': {
      borderBottom: 'solid 1px rgba(224, 224, 224, 1)'  // ついでにツールバーの下に罫線を引く
    },
    '.MuiDataGrid-row .MuiDataGrid-cell:not(:last-child)': {
      borderRight: 'solid 1px rgba(224, 224, 224, 1) !important'
    },
    // 2022/06/01 追記 列ヘッダの最終セルの右側に罫線が表示されなくなった・・・
    // 列ヘッダの最終列の右端に罫線を表示する
     '.MuiDataGrid-columnHeadersInner': {
      borderRight: 'solid 1px rgba(224, 224, 224, 1) !important'
    }
  }
}
罫線が引けました。

Discussion