📊
[統計学] ポアソンの小数法則の証明と可視化
はじめに
この記事はポアソンの小数法則の証明と可視化を行なっている. なお, ポアソン分布の性質については下記の記事にまとめている.
ポアソンの小数法則
以下が成り立つ.
証明
注意
以下に注意する.
指数関数のマクローリン展開
導出にあたり以下の式を用いるので先に証明する.
証明:
下記のマクローリン展開を実行する. なお,
上式において
マクローリン展開の可視化 | Shundeveloper
左辺の変形
- 右辺第五行の総積に
n^{-x} n-(n-x)=x
左辺を変形した式の極限をとる
可視化
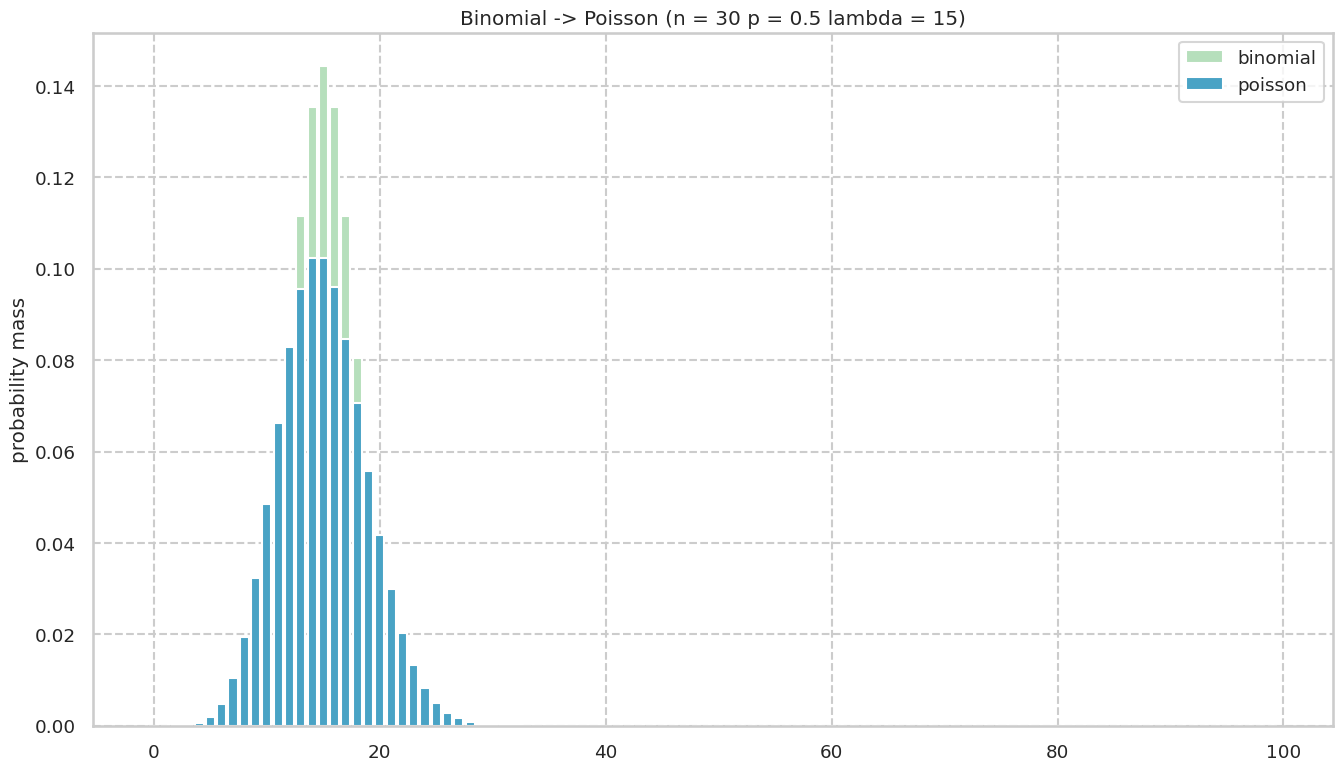
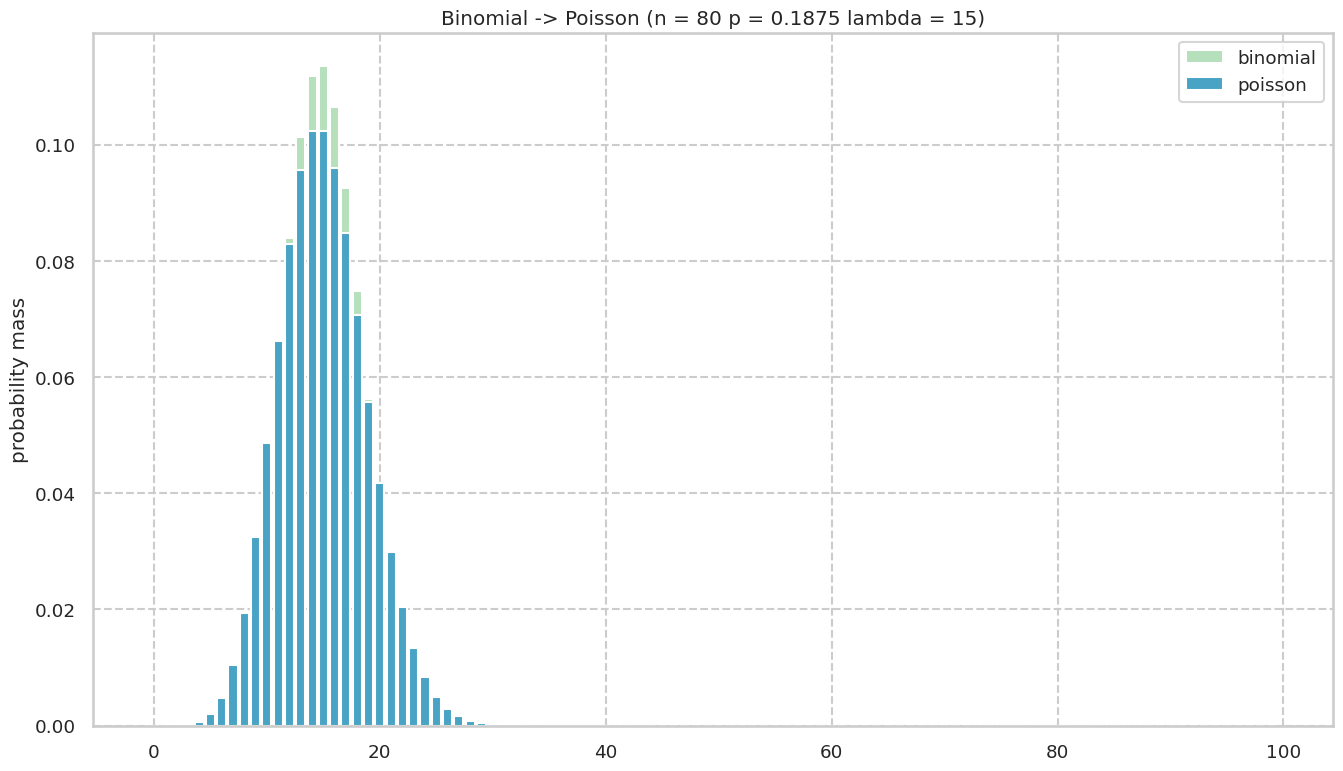
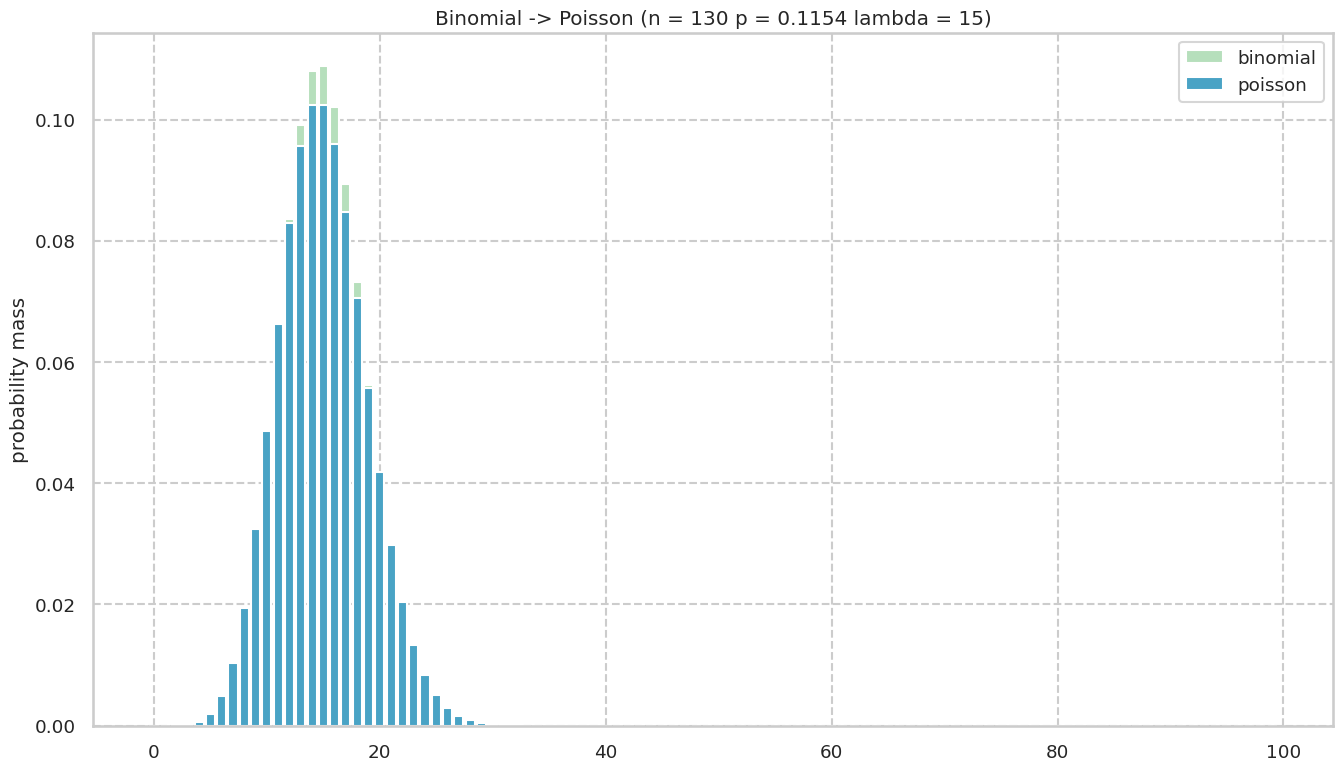
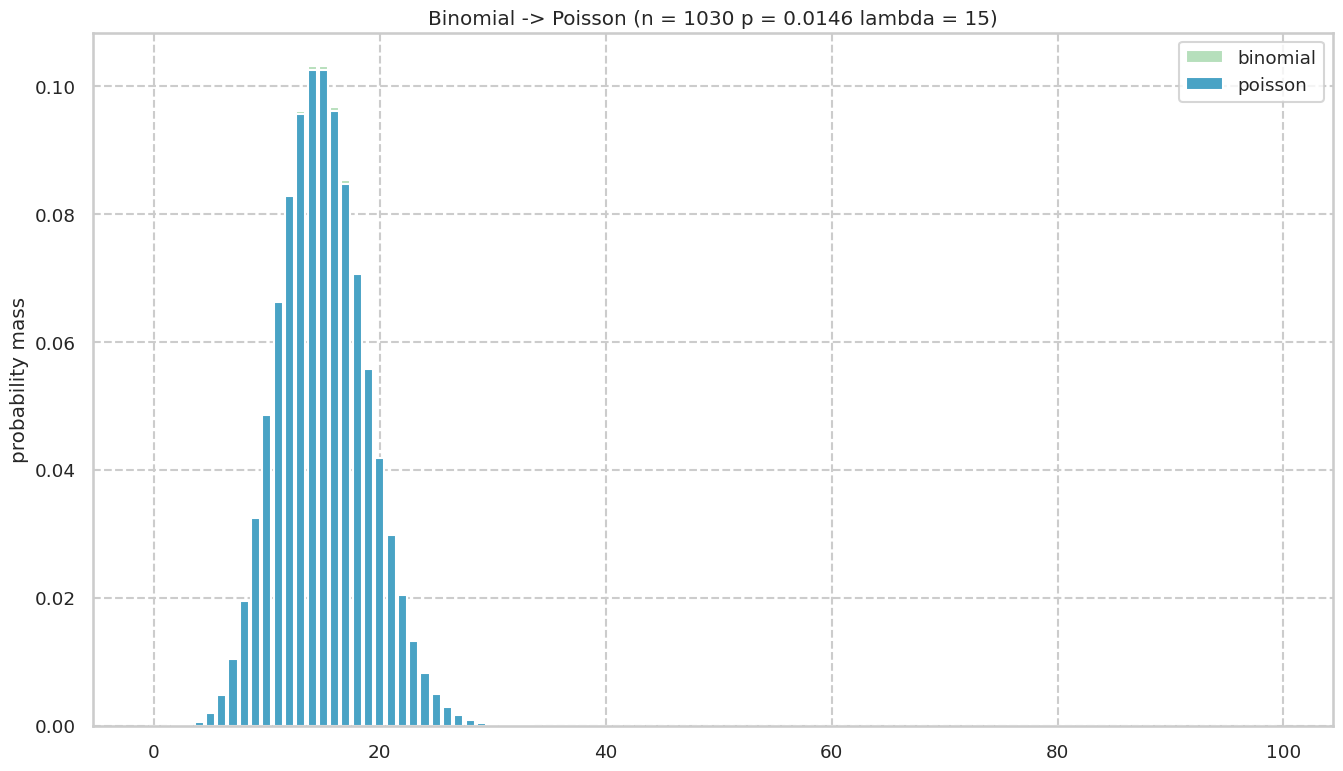
証明ができたのでシュミレーションして近似ができることを確認する.
実験用コード
シュミレーションに使うクラスを作成.
import math
import numpy as np
import matplotlib.pyplot as plt
import seaborn as sns
from scipy.stats import binom, poisson

class Poisson:
    def __init__(
        self,
        n_: float,
        lambda_: float
    ) -> None:
        """
            Explain
            ------
            constructor. create three property.

            Parameter
            ------
            self: Poisson
            n_: float
            lambda_: float
        """
        self.n_ = n_
        self.lambda_ = lambda_
        self.p_ =  self.lambda_/self.n_

    def plot(
        self,
    ) -> None:
        """
            Parameter
            ------
            self: Poisson
        """
        # create array for plot
        x = np.arange(0, 100, 1)
        binomial_list = [binom.pmf(k, n=self.n_, p=self.p_) for k in x]
        poisson_list = [poisson.pmf(k, self.lambda_) for k in x]

        # seaborn settings
        sns.set()
        sns.set_style('whitegrid', {'grid.linestyle': '--'})
        sns.set_context('talk', 0.8, {'lines.linewidth': 0})
        sns.set_palette('GnBu', 2, 0.9)

        # make plot title
        basic_title: str = 'Binomial -> Poisson'
        n_info = ' (n = ' + str(round(self.n_, 4))
        p_info = ' p = ' + str(round(self.p_, 4))
        lambda_info = ' lambda = ' + str(round(self.lambda_, 4)) + ')'

        title = basic_title + n_info + p_info + lambda_info

        # plot
        fig=plt.figure(figsize=(16,9))
        ax1 = fig.add_subplot(1, 1, 1)
        ax1.set_title(title)
        ax1.set_ylabel('probability mass')
        ax1.bar(x, binomial_list)
        ax1.bar(x, poisson_list)
        ax1.legend(['binomial', 'poisson'])
        plt.show()

    def add_n(self, num: int) -> None:
        """
            add num to self.n_ and calc new self.p_

            Parameter
            ------
            self: Poisson
            num: int
        """
        if isinstance(num, int) is False:
            raise TypeError("type of num must be int")
        self.n_ += num
        self.p_ =  self.lambda_/self.n_
インスタンスを作成してポアソンの小数法則をシュミレーションする.
po = Poisson(n_=30, lambda_=15)
for i in range(3):
    po.plot()
    po.add_n(num=50)
結果


1000回にもなるとほとんど同じように見える.
po = Poisson(n_=30, lambda_=15)
po.add_n(num=1000)
po.plot()


Discussion