16s rRNAのデータを使ったpicrust2による機能的存在量予測
はじめに
Bacteriaの群集構造のプロファイリングにおいて最も一般的なアプローチは、高度に保存された16S rRNA領域の配列を決定することです。
一方、16s rRNAの解析は、サンプリングされた群集の機能構成に関する直接的な情報は提供されないといった制約があります。これについては、マーカー遺伝子配列のプロファイルに基づく群集の機能予測をするツールであるPICRUSt(Phylogenetic Investigation of Communities by Reconstruction of Unobserved States)が存在しています。
一方、PICRUStは、OTU(Operational Taxonomic Units)のみを使用するため、ASV(Amplicon Sequence Variants)には未対応であり、使用している遺伝子ファミリーとpathwayのデータベースが古いなど予測精度に限界が生じていました。
PICRUSt2はPICRUStを拡張したもので、ASVに対応したほか、最新のデータベースを使用することでより多くの遺伝子ファミリーを扱うことが可能でpathwayの予測精度も向上し、ユーザー定義のデータベースを利用できるようになりました。
そういった改良版のPICRUSt2でも、全ゲノムの一部の情報をもとに機能予測をしているので、参照ゲノムの充実度やデータベースのボリュームによるバイアス、16sのプライマーバイアスの影響を受けることには留意して使用する必要がります。
ここでは、そんなPICRUSt2の解析を実施してみようと思います。
1. 環境の構築
こちらの記事で説明したsingularityコンテナにQIIME2をインストールして実行環境を整える流れで進めました。
1.1 .defファイル
以前用意したQIIME2のバージョンはQIIME2-2024.2だったが、q2-picrust2がQIIME2-2024.5に対応しているようなので、Singularityコンテナの定義ファイルを一部修正してインストール。
qiime2-2024-05.def
Bootstrap: docker
From: ubuntu:22.04

%post
    # Install
	apt update && apt upgrade -y
	apt install -y \
        wget \
        build-essential

    # make directory
    mkdir -p /opt

    # Install miniconda
    wget https://repo.anaconda.com/miniconda/Miniconda3-latest-Linux-x86_64.sh
    bash Miniconda3-latest-Linux-x86_64.sh -b -p /opt/miniconda3

    . /opt/miniconda3/etc/profile.d/conda.sh

    # Activate
    conda activate base
    conda update --yes --all

    # Install mamba
    conda install conda-forge::mamba

    # Install qiime2 amplicon 2024.02
    wget https://data.qiime2.org/distro/amplicon/qiime2-amplicon-{{ qiime2_version }}-py39-linux-conda.yml
    mamba env create -n qiime2-amplicon-{{ qiime2_version }} --file qiime2-amplicon-{{ qiime2_version }}-py39-linux-conda.yml
    conda activate qiime2-amplicon-{{ qiime2_version }}

    # Install picrust2
    mamba install q2-picrust2=2024.5 -c conda-forge -c bioconda -c picrust

    # cache clear
    conda clean -a

%environment
    # Setting variable for run
    export PATH=/opt:/opt/miniconda3/bin:/opt/miniconda3/envs/qiime2-amplicon-{{ qiime2_version }}/bin:${PATH}
    export LC_ALL=ja_JP.UTF-8
    . /opt/miniconda3/etc/profile.d/conda.sh
    conda activate qiime2-amplicon-{{ qiime2_version }}

%runscript
    exec "$@"

%labels
    Author Author
    Build_date 2024.09.03
    Version v1.0

%help
	This container for 16s amplicon sequence analysis using qiime2 version 2024.05.
singularityのbuildコマンドでdefファイルからSingularityコンテナをビルドする。
singularity build --fakeroot --build-arg qiime2_version="2024.5" qiime2-2024-05.sif qiime2-2024-05.def
またよく使われる周辺ツールのdefファイルは以下の通り。後で使うのでこちらもBuildしておく。
qiime2_othertools.def
Bootstrap: docker
From: ubuntu:22.04

%post
    # Install
	apt update && apt upgrade -y
	apt install -y \
        wget

    # make directory
    mkdir -p /opt

    # Install miniconda
    wget https://repo.anaconda.com/miniconda/Miniconda3-latest-Linux-x86_64.sh
    bash Miniconda3-latest-Linux-x86_64.sh -b -p /opt/miniconda3

    . /opt/miniconda3/etc/profile.d/conda.sh

    # Activate
    conda activate base
    conda update --yes --all

    # set channel
    conda config --append channels conda-forge
    conda config --append channels bioconda

    # Install mamba
    conda install conda-forge::mamba

    # Install informatics tools
    mamba create -n info-tools \
    python=3.10 \
    fastp=0.23.4 \
    multiqc=1.21 \
    seqkit=2.8.1 \
    parallel \
    aria2 \
    pigz \
    sra-tools=3.0 \
    parallel-fastq-dump \
    seqfu

%environment
    # Setting variable for run
    export PATH=/opt:/opt/miniconda3/bin:/opt/miniconda3/envs/info-tools/bin:${PATH}
    export LC_ALL=ja_JP.UTF-8

%labels
    Author Author
    Build_date 2024.04.21
    Version v1.1

%help
	This container for informatics tools with 16s amplicon sequence analysis using qiime2 version 2024.5.
singularity build --fakeroot qiime2_othertools.sif qiime2_othertools.def
2. 解析
PICRUSt2には以下の2ファイルが必要となる。
1.table.qzaファイル
2.rep-seqs.qzaファイル
以下の論文の16s rRNAのシーケンスデータを使用して解析を進める (前回と同じ)。
Metadataをダウンロードして、SraRunTable.txtのAssay TypeでAMPLICONのAccession Noを抽出する。フィルタリング後のファイルは以前作成したので以下のページからダウンロードして使用した(SraRunTable.txt)。
2.1 配列データの取得
SraRunTable.txtのうち必要な情報をフィルタリングし、ファイルの1列目の2行目以降を抽出して、arrayとして`data_arrayに代入する。
Accession Numberは全部で298サンプルありそのまま実行するとsraファイルだけで2GB程度になる。もしStrageを節約したい場合は、shufでランダムに配列情報を取得して新しいarrayを作成する。
# Accession Numnberのarray化
mapfile -t data_array < <(awk -F '[,]' 'NR > 1 {print $1}' "SraRunTable.txt")
サポート用のコンテナ内にインストールしておいたaria2を使用して、sraファイルをダウンロードする。
# SRA用のフォルダ作成
mkdir 00sra

# sraファイルのダウンロード
for i in ${data_array[@]}; do
    singularity exec qiime2_othertools.sif aria2c \
    -x 16 \
    -ctrue \
    --dir=00sra \
    https://sra-pub-run-odp.s3.amazonaws.com/sra/${i}/${i}
done
続いて、こちらもコンテナ内にダウンロードしておいたparallel-fastq-dumpとpigzを使用して、sra形式からPaierd Endのfastq.gzファイルを生成する。
# フォルダの作成
mkdir 00fq

# sra形式 -> fastq -> fastq.gz
printf "%s\n" "${data_array[@]}" | xargs -I {} -P 4 singularity exec qiime2_othertools.sif sh -c "
parallel-fastq-dump \
--sra-id 00sra/{} \
--threads 8 \
--outdir 00fq/ \
--split-files;

pigz -p 8 00fq/{}*fastq
"
Accession Numberをxargsに渡し、並列でコマンドを実行している。
-
printf "%s\n" "${data_array[@]}"- 配列の要素を改行で区切って出力します。これにより、各行が xargs によって個別のコマンドとして扱われる
-
xargs -I {} -P 4- -I {} は置換文字列 {} を使用して、入力行をコマンドの任意の位置に挿入できるようにする
- -P 4 は同時に実行するプロセスの最大数を4に設定します。この数はシステムのリソースに応じて調整可能
-
singularity exec qiime2_othertools.sif sh -c "...":- singularity exec でコンテナ内部でシェルコマンドを実行します。sh -c は複数のコマンドを含む一連のシェルコマンドを扱うために使用される
これでfastq.gzファイルが生成できた。
2.2 Manifestファイルの作成とQiime2へのデータのインポート
以降ちょっと古いですが、以下の記事を参考に進める。
singularity exec qiime2_othertools.sif \
seqfu metadata \
--format manifest \
-1 "_1" \
-2 "_2" \
--threads 32 \
00fq > Manifest.tsv
続いて、qiime tools importで解析対象のfastqファイル群をqza形式に変換。
--input-pathにはさっき作成した、Pathが記載されているManifest.tsvを指定。--typeと--iput-formatはこちらを参考にして選択。
mkdir -p 01output/qza 01output/qzv log

singularity exec qiime2-2024-05.sif qiime tools import \
--type 'SampleData[PairedEndSequencesWithQuality]' \
--input-format PairedEndFastqManifestPhred33V2 \
--input-path Manifest.tsv \
--output-path 01output/qza/00demux.qza \
2>&1 | tee log/qiime_demux.log
2.3 DADA2によるデノイジング、エラー配列の修正
論文にはMiseqで250PEのシーケンスを下との記載があるが、編集前のSraRunTable.txtには600bpのアンプリコンをシーケンス(300PE)したとの情報があります。seqkitで確認しても、R1, R2ともに300bpあったので300PEで間違いないでしょう。
DADA2の処理についても論文に記載のパラメーターに準拠して解析を実行しており、DADA2のpooling methodにはpseudo-poolingを使用したと記載があったので、--p-pooling-method puseudoとしています。
--p-pooling-methodに選択できる、'independent', 'pseudo'については、実行時間が増えるもののpuseudoのほうが感度は高い模様。
また、過去のissueで議論されているように、pooling-methodをpuseudoにした場合、chimera-methodもpooldにすることが望ましいようで、将来的に実装されるとのことみたいだが今の所実装されておらず、デフォルトのconsensusが指定されている。今回はそのままとした。
singularity exec qiime2-2024-05.sif \
qiime dada2 denoise-paired \
--i-demultiplexed-seqs ./01output/qza/00demux.qza \
--p-trim-left-f 0 \
--p-trim-left-r 0 \
--p-trunc-len-f 250 \
--p-trunc-len-r 180 \
--p-pooling-method pseudo \
--o-representative-sequences ./01output/qza/02rep-seqs-dada2_f250_r180.qza \
--o-table ./01output/qza/02table-dada2_f250_r180.qza \
--o-denoising-stats ./01output/qza/02stats-dada2_f250_r180.qza \
--p-n-threads 0 \
--verbose 2>&1 | tee log/qiime_dada2.log
2.4 read filtering
論文の情報に従いリード数でテーブルデータに対してフィルタリングを実施する。
singularity exec qiime2-2024-05.sif \
qiime feature-table filter-features \
--i-table 01output/qza/02table-dada2_f250_r180.qza \
--p-min-frequency 2500 \
--o-filtered-table 01output/qza/03frequency-filtered-table.qza
次に、フィルタリング後に残った情報に対応する配列データを抽出する。この作業をしないとテーブルデータと齟齬が出る。
singularity exec qiime2-2024-05.sif \
qiime feature-table filter-seqs \
--i-data 01output/qza/02rep-seqs-dada2_f250_r180.qza \
--i-table 01output/qza/03frequency-filtered-table.qza \
--o-filtered-data 01output/qza/03filtered-rep-seqs.qza
これで、table.qzaとrep-seq.qzaが準備できた。
3.1 PICRUSt2の実行
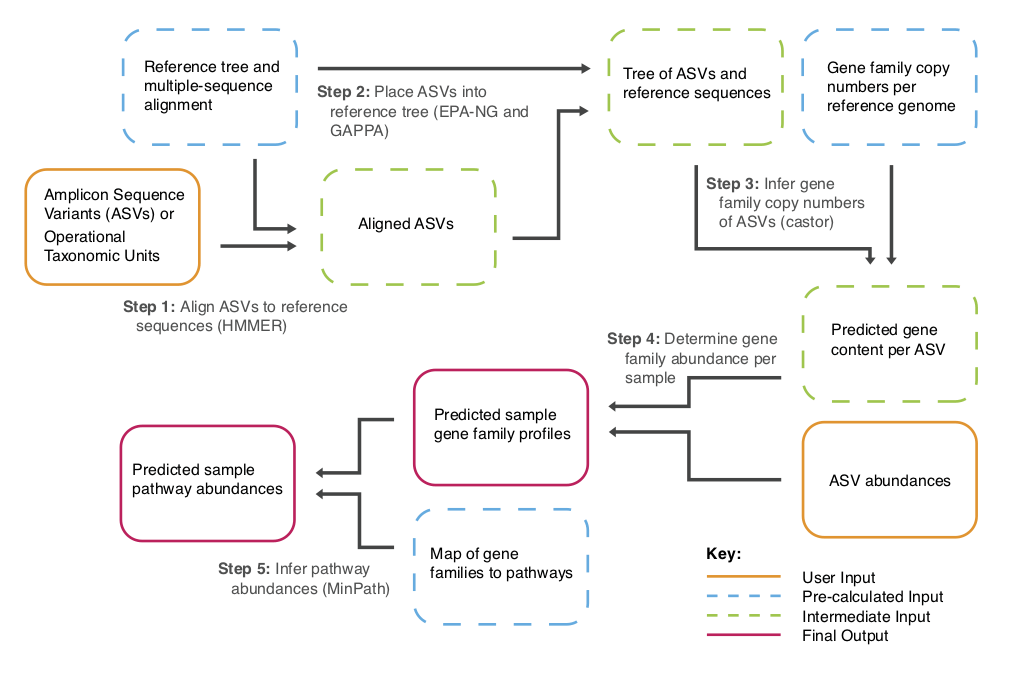
DADA2のDenoising終了で、PICRUSt2のInputファイルを生成までが完了した。PICRUSt2は以下のようなフローで処理が進む。

オプションは以下の通り。
USAGE PICRUSt2
Usage: qiime picrust2 full-pipeline [OPTIONS]

  QIIME 2 plugin for default 16S PICRUSt2 pipeline

Inputs:
  --i-table ARTIFACT FeatureTable[Frequency]
                       The feature table containing sequence abundances per
                       sample.                                      [required]
  --i-seq ARTIFACT FeatureData[Sequence]
                       Sequences (e.g. ASVs or representative OTUs)
                       corresponding to the abundance table given.  [required]
Parameters:
  --p-threads INTEGER  Number of threads/processes to use during workflow.
    Range(1, None)                                                [default: 1]
  --p-hsp-method TEXT Choices('mp', 'emp_prob', 'pic', 'scp',
    'subtree_average') Which hidden-state prediction method to use.
                                                               [default: 'mp']
  --p-placement-tool TEXT Choices('epa-ng', 'sepp')
                       Placement tool to use when placing sequences into
                       reference tree. EPA-ng is the default, but SEPP is less
                       memory intensive.                   [default: 'epa-ng']
  --p-min-align PROPORTION
    Range(0.0, 1.0)    Proportion of the total length of an input query
                       sequence that must align with reference sequences. Any
                       sequences with lengths below this value after making an
                       alignment with reference sequences will be excluded
                       from the placement and all subsequent steps.
                                                                [default: 0.8]
  --p-max-nsti NUMBER  Max nearest-sequenced taxon index for an input ASV to
    Range(0.0, None)   be output.                               [default: 2.0]
  --p-edge-exponent NUMBER
    Range(0.0, None)   Setting for maximum parisomony hidden-state
                       prediction. Specifies weighting transition costs by the
                       inverse length of edge lengths. If 0, then edge lengths
                       do not influence predictions. Must be a non-negative
                       real-valued number.                      [default: 0.5]
  --p-skip-minpath / --p-no-skip-minpath
                       Do not run MinPath to identify which pathways are
                       present as a first pass (on by default).
                                                              [default: False]
  --p-no-gap-fill / --p-no-no-gap-fill
                       Do not perform gap filling before predicting pathway
                       abundances (gap filling is on otherwise by default).
                                                              [default: False]
  --p-skip-norm / --p-no-skip-norm
                       Skip normalizing sequence abundances by predicted
                       marker gene copy numbers (typically 16S rRNA genes).
                       The normalization step will be performed automatically
                       unless this option is specified.       [default: False]
  --p-highly-verbose / --p-no-highly-verbose
                       Print all commands being written as well as all
                       standard output of wrapped tools. This can be
                       especially useful for debugging. Note that this option
                       requires that the --verbose option is also set (which
                       is an internal QIIME 2 option that indicates that
                       STDOUT and STDERR should be printed out).
                                                              [default: False]
Outputs:
  --o-ko-metagenome ARTIFACT FeatureTable[Frequency]
                       Predicted metagenome for KEGG orthologs      [required]
  --o-ec-metagenome ARTIFACT FeatureTable[Frequency]
                       Predicted metagenome for EC numbers          [required]
  --o-pathway-abundance ARTIFACT FeatureTable[Frequency]
                       Predicted MetaCyc pathway abundances         [required]
Miscellaneous:
  --output-dir PATH    Output unspecified results to a directory
  --verbose / --quiet  Display verbose output to stdout and/or stderr during
                       execution of this action. Or silence output if
                       execution is successful (silence is golden).
  --example-data PATH  Write example data and exit.
  --citations          Show citations and exit.
  --help               Show this message and exit.
オプションの説明
-
--p-placement-tool
- クエリ配列を参照ツリーに配置するために使用する配置ツール (epa-ngまたはsepp) を指定。デフォルトは epa-ng。
-
--p-hsp-method
- 使用する隠れ状態予測方法を指定。デフォルトはmpで、高速であるpicも指定可能
-
--p-max-nsti
- シーケンスが参照系統樹内でどれだけ離れた位置にある必要があるかを指定。デフォルトのカットオフは2。PICRUSt2のテストに使用されたヒトのデータセットでは、このデフォルトのカットオフを超えるASVは16Sデータセットに誤って含まれていた18S シーケンスのみ。これは、このカットオフが非常に寛大であることを示している。
- 環境データセットの場合、このデフォルトのカットオフに基づいて、より高い割合のASVが除外される可能性があることに留意する。
-
--p-edge-exponent
- 最大節約隠れ状態予測の設定。エッジ長の逆数で遷移コストの重み付けを指定。0の場合、エッジ長は予測に影響ない。
- SEPPによる配置と最大節約による予測を実行している場合、エラーを回避するためにこのオプションを0に設定する。
-
--p-threads
- 使用するスレッド (または CPU) の数
以下のコマンドでPICRUSt2の full pipelineを実行する。
singularity exec qiime2-2024-05.sif qiime picrust2 full-pipeline \
--i-table 01output/qza/03frequency-filtered-table.qza \
--i-seq 01output/qza/03filtered-rep-seqs.qza \
--output-dir 01output/q2-picrust2_output \
--p-placement-tool epa-ng \
--p-threads 32 \
--p-hsp-method mp \
--p-max-nsti 2 \
--p-highly-verbose \
--verbose \
2>&1 | tee log/qiime_qicrust2.log
5分程度で終了。30GB程度のメモリを消費していることを確認。続いてVisualization。
- EC
singularity exec qiime2-2024-05.sif qiime feature-table summarize \
--i-table 01output/q2-picrust2_output/ec_metagenome.qza  \
--o-visualization 01output/qzv/ec_metagenome.qzv
- KEGG
singularity exec qiime2-2024-05.sif qiime feature-table summarize \
--i-table 01output/q2-picrust2_output/ko_metagenome.qza  \
--o-visualization 01output/qzv/ko_metagenome.qzv
- MetaCyc
singularity exec qiime2-2024-05.sif qiime feature-table summarize \
--i-table 01output/q2-picrust2_output/pathway_abundance.qza \
--o-visualization 01output/qzv/pathway_abundance.qzv
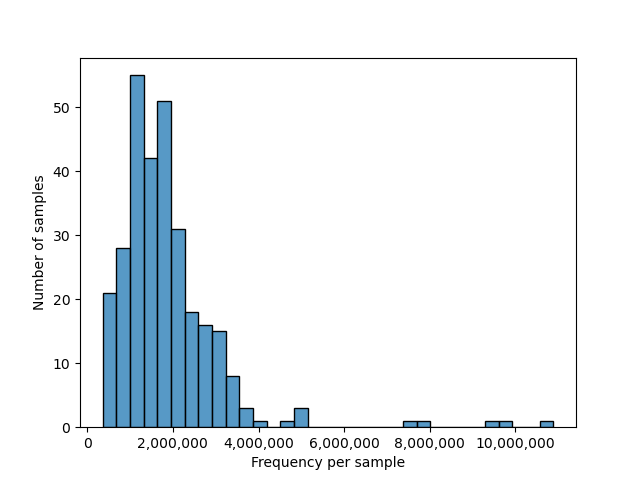
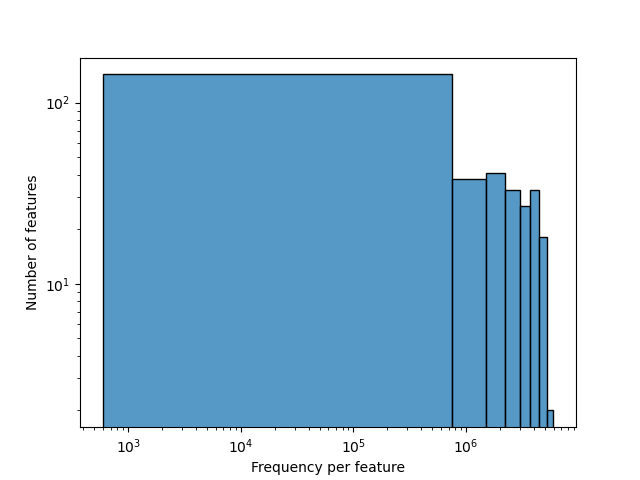
qiime2 viewでpathway_abundance.qzvを確認すると、1タブ目(Overview)にはpathway abundanceの分布や

featureの頻度のが確認できるFigがあります。

2タブ目(Interactive Sample Detail)は、Depthの調整による残存サンプルの確認できるページです。

注意点として、このファイルは相対的な存在量の単位 (パーセントなど) ではなく、各ASVに対する予測機能的存在量の合計に各 ASVの存在量(入力読み取り数)をかけ合わせたものであることに留意してください。
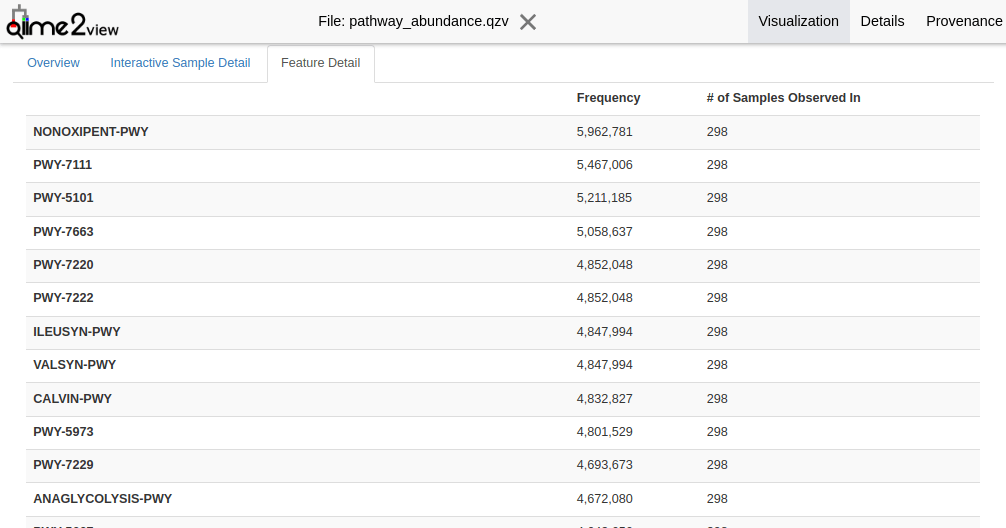
3つ目のタブ(Feature Detail)には、MetaCycのpathway IDごとの頻度と、検出サンプル数が記載されています。

適当に最上段のIDを検索するとピルビン酸発酵からイソブタノールへの改変経路に関するものでした。どこまで整合性の取れる情報かはおいておいても、16s rRNA領域の配列情報からこのような代謝に関連する情報を紐付けられるのは大変面白いですね。
次に、このpathway IDごとの頻度をもとに多様性解析を実行します。まず、しきい値を2タブ目の情報か、以下のコマンドでExportしたファイルから判断します。今回はとりあえず全サンプルを解析に使用するために最小値を採用します。
singularity exec qiime2-2024-05.sif qiime diversity core-metrics \
--i-table 01output/q2-picrust2_output/pathway_abundance.qza \
--p-sampling-depth 356233 \
--m-metadata-file Manifest.tsv \
--output-dir 01output/pathabun_core_metrics_out \
--p-n-jobs 1
singularity exec qiime2-2024-05.sif qiime diversity core-metrics \
--i-table 01output/q2-picrust2_output/ec_metagenome.qza \
--p-sampling-depth 1998582 \
--m-metadata-file Manifest.tsv \
--output-dir 01output/ec_abun_core_metrics_out \
--p-n-jobs 1
singularity exec qiime2-2024-05.sif qiime diversity core-metrics \
--i-table 01output/q2-picrust2_output/ko_metagenome.qza \
--p-sampling-depth 3983405 \
--m-metadata-file Manifest.tsv \
--output-dir 01output/ko_abun_core_metrics_out \
--p-n-jobs 1
得られた量的データをテキストデータにするには、以下のようにBiomファイルに一度変換する必要があります。
apps=(ec_metagenome ko_metagenome pathway_abundance)

for app in ${apps[@]}; do
    singularity exec qiime2-2024-05.sif qiime tools export \
    --input-path 01output/q2-picrust2_output/${app}.qza \
    --output-path  01output/${app}_exported
done
Biomファイルをプレーンテキストに変換。
apps=(ec_metagenome ko_metagenome pathway_abundance)

for app in ${apps[@]}; do
    singularity exec qiime2-2024-05.sif biom convert \
    -i 01output/${app}_exported/feature-table.biom \
    -o 01output/${app}_exported/feature-table.tsv \
    --to-tsv
done
後はggpicrust2などを用いて、差分分析と視覚化などを進めると論文にも使えそうな統計解析結果とFigが手に入る。
Discussion