【Wave analytics Method】What is Spectral Contrast?
1. Spectral Contrast
Spectral Contrast shows the relation between the highest and lowest values in specific frequency bands. (intermediate values will be ignored)
1.1 Definition
Spectral contrast measures the differenece in energy between the peaks(haighest values) and valleys(lowest values) within specific frequency bands. The primary focus is on the differenece or contrast between the most intense and least intense frequencies component within each band.
・Example
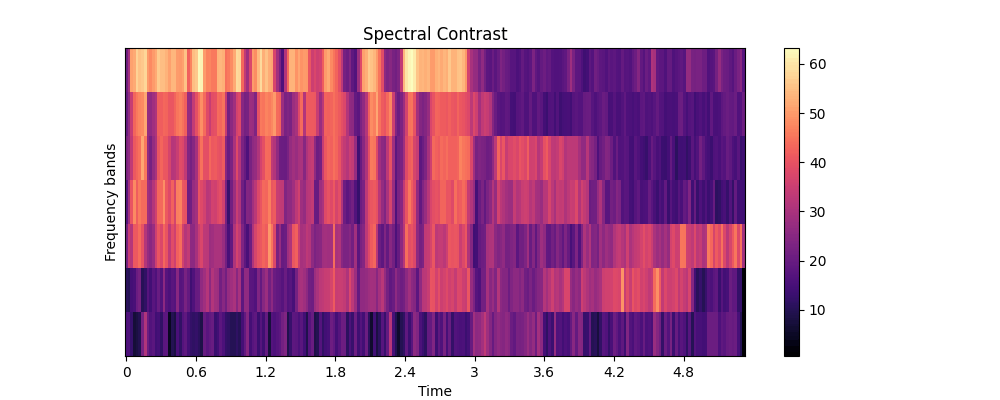
1.2 Frequency Bands
The frequency spectrum is divided into bands, typically on a logarithmic scale to match the human perception of frequency. For each band, the spectral contrast is calculated by comparing the peak and valley energy levels.
2. What It Highlights
Spectral Contrast emphasis on extremes. By focusing on the peaks and valleys, spectral contrast highlights the most prominent and the least noticeable parts of the signal, witch can indicate dynamic changes in the spectrum.
Also, intermediates are ignored in Spectral Contrast. It can be helpful in applications like music genre classification or audio segmentation, where the extremes(e.g., the loudest instruments or most subdued parts) play a key role in identifying patterns or characteristics.
3. Calculate Flow
- Frame the signal
- Windowing
- Fourier Transform
- Frequency Binning
- Calculate Spectral Peaks and Valleys
- Compute Spectral Contrast
Explained in detail below.
3.1 Frame the signal
First, Determine the time length to apply Transform.
Commonly used window size s for calculation Spectral Contrast range from 20 milliseconds to 100 milliseconds. Here are some typical values.
- 20-40 milliseconds: This range provides a good balance between time and frequency resolution and is often used for analyzing transient and percussive sounds
- 50 milliseconds: This is a coomon choice for general-purpose audio analysis and works well for a wide range of audio signals.
- 100 milliseconds: This longer window size emphasizes frequency resolution over time resolution and as useful for analyzing more stationary or slowly varying sounds.
3.2 Windowing
It will be applied to prevent Spectral Leakage.
I explained it in here.
3.3 Fourier Transform
The Discrete Fourier Transform is applied to each windowed frame to obtain the frequency domain representation of the signal.
3.4 Frequency Binning
The frequency range is divided into a seires of frequency bands or bins (typically logarithmic, alined with musical notes or Mel scale).
3.5 Calcurate Spectral Peaks and Valleys
for each frequency band, compute the maximum (peak) and minimum (valley) energy with in that band.
3.6 Compute Spectral Contrast
For each band, calculate the spectral contrast by taking the difference between the peak and the valley enegies, typically in decibels(dB).
The general formula is:
Spectral Contrast
Here's a detailed breakdown of each component of the formula.
- Peak Value
This is the highest point of the energy spectrum in each band. - Valley Value
This is the lowest point of the energy spectrum in each band. - Ratio of Peak and Valley
THe formula takes the ratio of the Peak Value to the Valley Value. This ratio highlights the enrgy difference between the most and least intence parts of the frequency band. - Logarithmic scale
Logarithmic Scaling helps in portraying a wide range of values in a compact form, which aligns better with human auditory perception. This scaling is akin to how decibels are used to maesure sound intensity. - Multiplication by 10
Finnaly, the lagarithmic value is multiplied by 10. This step is typical in converting logarithmic ratios into decibels(dB), which are a standard unit for expressing audio levels in terms of perceived loudness or intenisty.
4. Applications
4.1 Music and Speech Analysis
Spectral contrast can reveal differences in musical styles or speech patterns by examining how varied the energy is within each frequency.
Example, it is useful for tasks like music genre classification or audio quality assessment.
4.2 Texture and Complexity
Higher spectral contrast might indicate more complex or textured audio, while lower spectral contrast suggests smoother, more uniform content.
Summary
Spectral Contrast shows the relation between the peaks and valleys within specific frequency bands. It expresses intensity of change in specified frequency band in a time window.
This time is over. Thank you for reading.
Discussion