【Window function】How do we prevent Spectral Leakage?【Method】
1. Window Function
What is the window function? It's like a filter.
It works to decrease wave amplitude in both end of the window.
2. What will happen?
Visualization about window function are below.
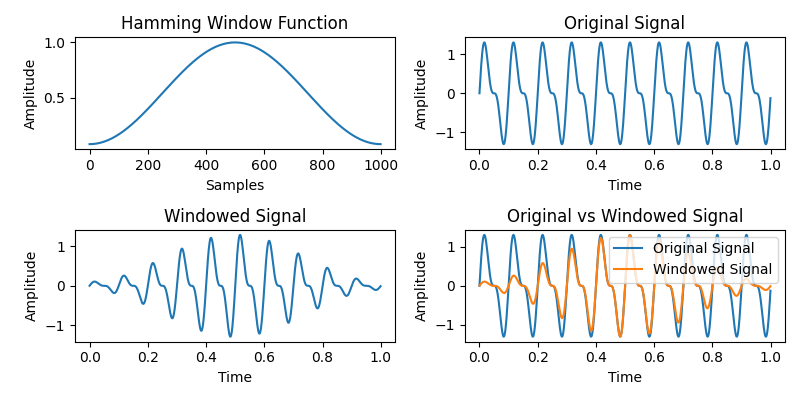
It reducing the amplitude of the signal towards both end of the window.
This reduction in amplitude is known as "tapering" or "fading" at the window boudaries.
3. Purpose
Mainly purpose of window function is to prevent spectral leakage.
But, What is this? Let's take a quick look.
3.1 Spectral Leakage
Spectral Leakage is a phenomenon that spectrum power 'leak' to nearby range when applying data transform like FFT with finite signals.
It happens when transforming unnatullay separated finite signals.
FFT
FFT transform time domain signal into frequency domain one. A result of FTT shows values of frequency component that was included original(time domain) signal, and a graph of these values is called a 'spectrum'.
Code that apply FFT
import matplotlib.pyplot as plt
import matplotlib.ticker as ticker
import numpy as np

# config
fs = 500 # sampling rate(Hz) : Number of sampling per a second
T = 1/fs # sampling interval(s)
frec = 1 # wave frequency
length = 10 # wave length

x = np.linspace(0, length, length*fs)
y = np.sin(x * np.pi * 2 * frec)

# visualize wave
fig,ax = plt.subplots(figsize = (10,8))
ax.plot(x, y)
ax.xaxis.set_major_locator(ticker.MultipleLocator(1))
ax.grid('major')
ax.set_xlabel('Time(s)')
ax.set_ylabel('Amplitude')
plt.savefig('signal-1Hz.png')
plt.show()

# perform fft
fft_values = np.fft.fft(y)
frequencies = np.fft.fftfreq(len(fft_values), d=1/500)
fig,ax = plt.subplots(figsize = (10,8))
ax.plot(frequencies[:len(frequencies)//2//5], np.abs(fft_values[:len(fft_values)//2//5]))
ax.set_xlim(0,10)
ax.xaxis.set_major_locator(ticker.MultipleLocator(1))
ax.set_xlabel('Frequency(Hz)')
ax.set_ylabel('Power')
plt.savefig('spectrum-1Hz.png')
plt.show()

print(np.argmax(fft_values[:len(fft_values)//2//5]))
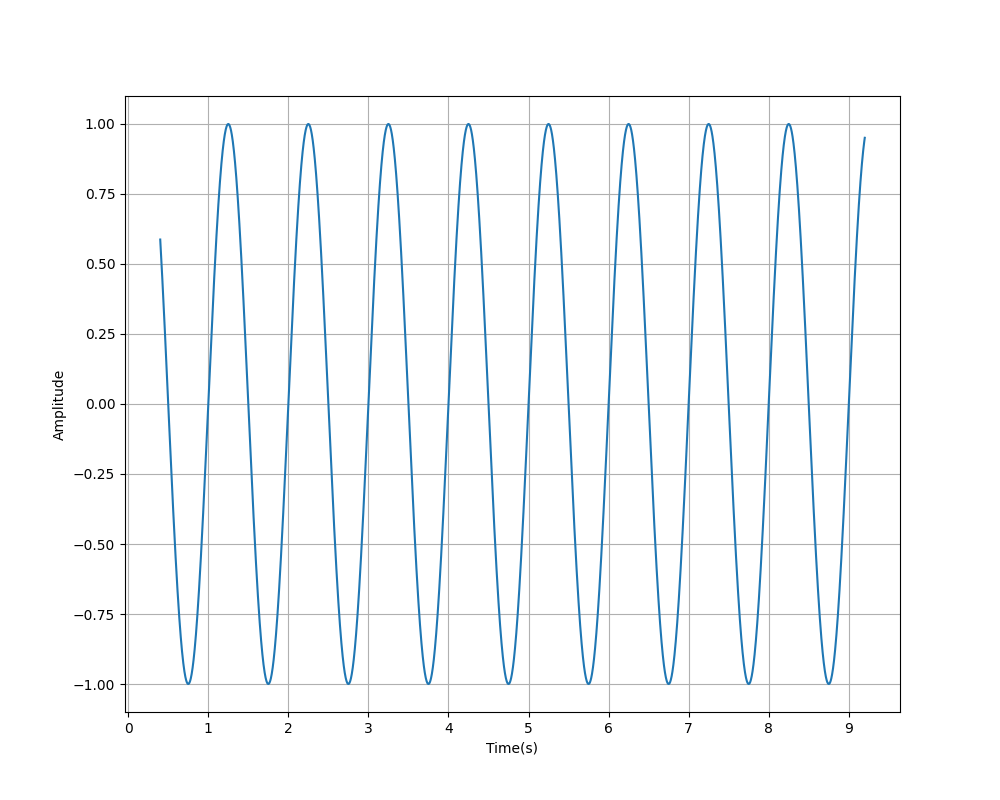
・Input signal(1Hz sin wave)

・Spectrum(From 1Hz sin wave)
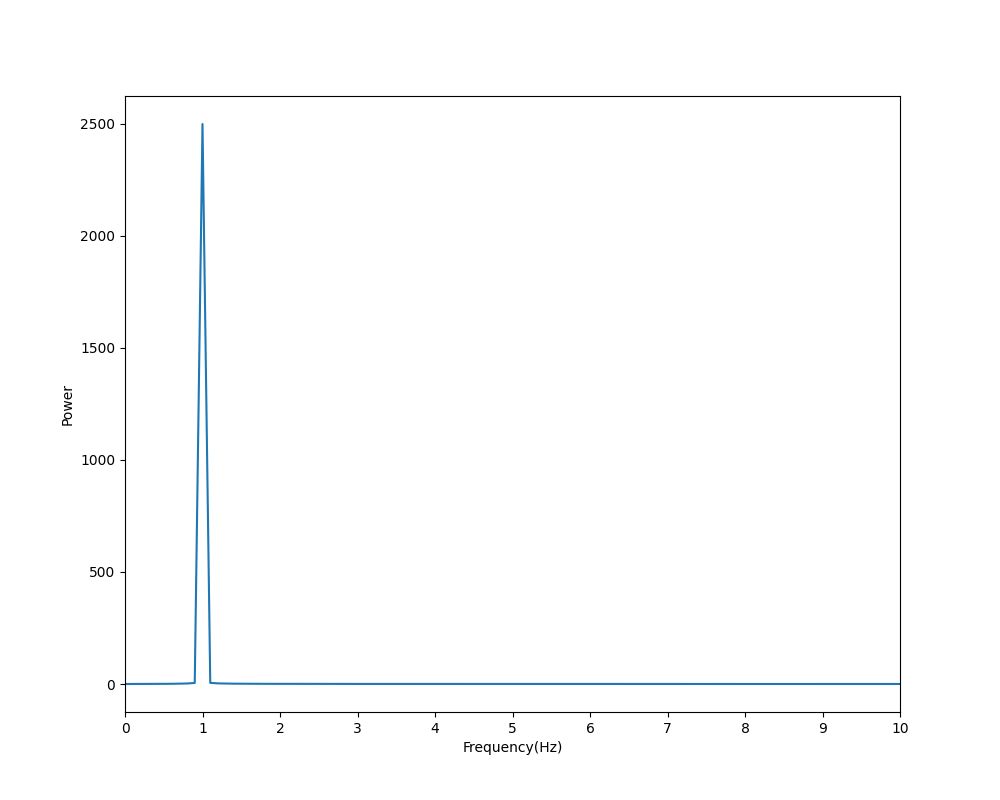
It shows that waves with a frequency of 1Hz were strongly included.
It's correct. No leaking has occured.
Spectral Leakage
The above input had a well-ordered input with respect to time.
In this time, we try to add some shift to time direction of input.
Code that apply FFT
import matplotlib.pyplot as plt
import matplotlib.ticker as ticker
import numpy as np

# config
fs = 500 # sampling rate(Hz) : Number of sampling per a second
T = 1/fs # sampling interval(s)
frec = 1 # wave frequency
length = 10 # wave length

x = np.linspace(0, length, length*fs)[200:-400]
y = np.sin(x * np.pi * 2 * frec)[:]
print(len(x),len(y))

# visualize wave
fig,ax = plt.subplots(figsize = (10,8))
ax.plot(x, windowed_y)
ax.xaxis.set_major_locator(ticker.MultipleLocator(1))
ax.grid('major')
ax.set_xlabel('Time(s)')
ax.set_ylabel('Amplitude')
plt.savefig('signal-1Hz-timeShited.png')
plt.show()

# perform fft
fft_values = np.fft.fft(windowed_y)
frequencies = np.fft.fftfreq(len(fft_values), d=1/500)
fig,ax = plt.subplots(figsize = (10,8))
ax.plot(frequencies[:len(frequencies)//2//5], np.abs(fft_values[:len(fft_values)//2//5]))
ax.set_xlim(0,10)
ax.set_xlabel('Frequency(Hz)')
ax.set_ylabel('Power')
plt.savefig('Spectrum-1Hz-timeShited.png')
plt.show()

print(np.argmax(fft_values[:len(fft_values)//2//5]))
・Input (Time shifted 1Hz sin wave)
・Spectrum (From time shifted 1Hz sin wave)

Althogth the frequencies are the same, you can see 'spread' in output spectrum, it's the 'Leakage'. It happens because FTT expect infinite signal, but input has finite signal with unnatural boundalies. This different cause leakage. This will hinder the analysis.
Spectral Leakage is happen when input has unnatural boundaries with both end of wave, But the data that has unnatural boundaries are found in various place, like during general recording and conversion during FTT.
4. How prevent Spectral Leakage?
The cause of Spectral Leakage is unnaturalness of boudaries. So, we can reduce the effects that exist near the boudaries by applying a window function.
More precisely, the window function reduces the amplitude of the signal towards both end of the window. This also reduces the influence of values at both ends of the waveform.
Let's see the effect of window function.
Code that apply FFT (After window-function)
import matplotlib.pyplot as plt
import matplotlib.ticker as ticker
import numpy as np

# config
fs = 500 # sampling rate(Hz) : Number of sampling per a second
T = 1/fs # sampling interval(s)
frec = 1 # wave frequency
length = 10 # wave length

x = np.linspace(0, length, length*fs)[200:-400]
y = np.sin(x * np.pi * 2 * frec)[:]
print(len(x),len(y))

# Define the window function (Hamming window)
window = np.hamming(len(y))

# Apply the window function to the signal
windowed_y = y * window

# visualize wave
fig,ax = plt.subplots(figsize = (10,8))
ax.plot(x, windowed_y)
ax.xaxis.set_major_locator(ticker.MultipleLocator(1))
ax.grid('major')
ax.set_xlabel('Time(s)')
ax.set_ylabel('Amplitude')
plt.savefig('signal-1Hz-timeShited-withWindowFunction.png')
plt.show()

# perform fft
fft_values = np.fft.fft(windowed_y)
frequencies = np.fft.fftfreq(len(fft_values), d=1/500)
fig,ax = plt.subplots(figsize = (10,8))
ax.plot(frequencies[:len(frequencies)//2//5], np.abs(fft_values[:len(fft_values)//2//5]))
ax.set_xlim(0,10)
ax.set_xlabel('Frequency(Hz)')
ax.set_ylabel('Power')
plt.savefig('Spectrum-1Hz-timeShited-withWindowFunction.png')
plt.show()

print(np.argmax(fft_values[:len(fft_values)//2//5]))
・Input (Time shifted 1Hz sin wave after window-function)

・Spectrum (From time shifted 1Hz sin wave after window-function)

Yeah, we get a somewhat stable spectrum by multiplying the input with a window function before FFT, which helps to address the unnatural boundaries in the input signal.
It's effect of window function.
Summary
Window function like a filter. It reducing the amplitude of the signal towards both end of the window, and it causes a reduction in Spectral Leakage when applying FFT.
This time is over. Thank you for reading.
Discussion