日本発祥のテクニカル指標「一目均衡表」を通知してみた【Python】
背景
キノコードさんの動画を見て株式のテクニカル分析に挑戦してみました。
※単なる「やってみた」系です!💦
先人たちの知恵をお借りするなどして解決できたことを、この場をお借りして感謝するとともに、大変恐縮ですが 自分のメモ として、こちらへまとめておきます。
★末尾に記載していた課題が解決したため、掲載内容を修正しました。(2021/08/08)
◆◆当日が休場日の場合は一目均衡表の作成ならびに通知を行なわないように修正しました。(2021/09/21)
◆◆tweepyのアップデートに伴い、ユーザー認証部分を OAuth1UserHandler へ変更
(2022/04.10)
キノコードさんの動画
【Pythonでファイナンス分析(株・FX)】日本発祥のテクニカル指標「一目均衡表」の作成方法
環境
(開発)
Windows 10 64bit (20H2)
Python 3.9.5
VS Code
手順
1. 各種ライブラリのインストール
最初に躓いたのが テクニカル指標を簡単に生成可能な TA-Lib というライブラリのインストール。
解決方法は👇に共有しておきます。
2. 「一目均衡表」の作成
「一目均衡表」の作成は動画を見ながら進めれば、あら簡単!できあがり! ( ´艸`)
株価は動画と同じく、^N225(日経平均株価)です。
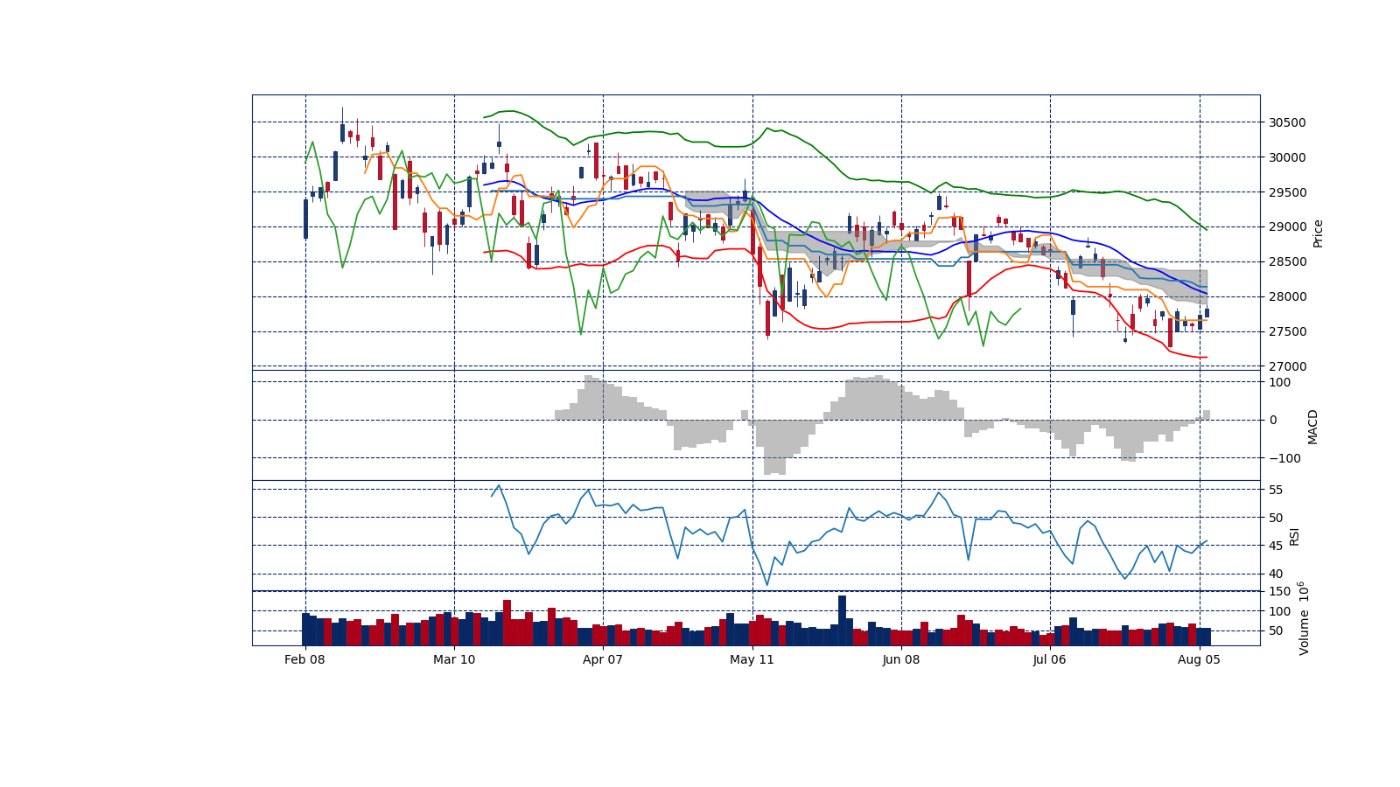
それじゃぁ、あんまりなので、最終的に作成したグラフを添付して、SlackやTwitterへ通知してみましたよ~。
3. Slack/twitterへの通知
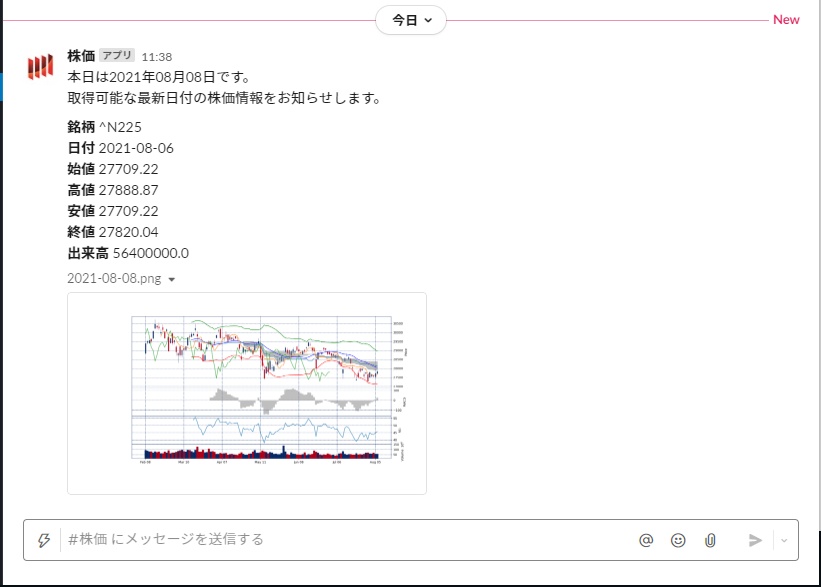
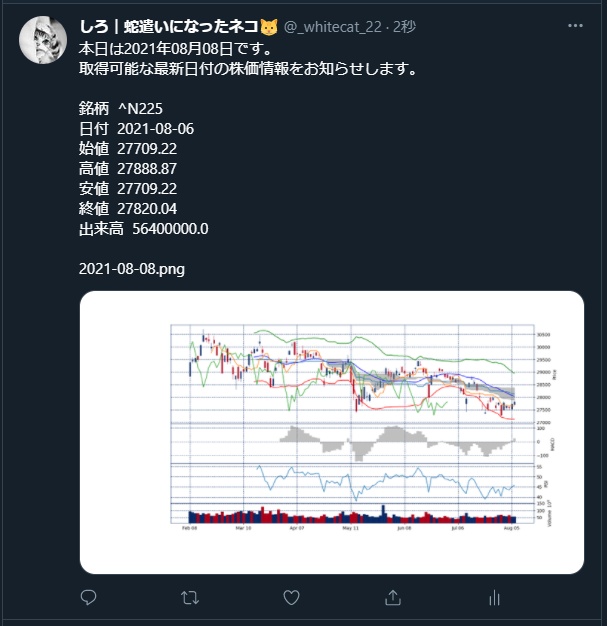
通知結果
- Slack
コード
作成したコードは下記になります。ご参考まで。
try:
    #from notifiers import unzip_requirements
    import unzip_requirements
except ImportError:
    print('Import Error - unzip_requirements')
    pass
except Exception as e:
    print(e)
    pass

import csv
import datetime
import os
from os.path import join, dirname
import mplfinance as mpf
from pandas_datareader import data
import pandas as pd
from dotenv import load_dotenv
from dateutil.relativedelta import relativedelta

import matplotlib.pyplot as plt
import talib as ta

#from notifiers import slack
#from notifiers import twitter
import tweepy
from decimal import Decimal, ROUND_HALF_UP
from slack_sdk.errors import SlackApiError
from slack_sdk import WebClient

import json
import logging

# settins for logging
logger = logging.getLogger()
logger.setLevel(logging.INFO)

# Load env variants
dotenv_path = join(dirname(__file__), '.env')
load_dotenv(dotenv_path)
load_dotenv(verbose=True)
stock_code = os.environ.get("STOCK_CODE")

is_today = 'N'

# Get today's date for getting the stock price and csv&image filename
today = datetime.date.today()

# tmp directory is present by default on Cloud Functions, so guard it
if not os.path.isdir('/tmp'):
    os.mkdir('/tmp')

FILENAME = '%s.csv' % str(today)


"""
json: Format the data to be sent by the SLack API into JSON
requests: HTTP client
"""
# WebClient insantiates a client that can call API methods
# When using Bolt, you can use either `app.client` or the `client` passed to listeners.
client = WebClient(token=os.environ.get("SLACK_BOT_TOKEN"))
# ID of channel that you want to upload file to
token = os.environ.get("SLACK_BOT_TOKEN")
channel_id = os.environ.get("SLACK_CHANNEL_ID")

"""
json: Format the data to be sent by the Twitter API into JSON
requests: HTTP client
"""
# 各種twitterのKeyをセット CONSUMER_KEY, CONSUMER_SECRET, ACCESS_KEY, ACCESS_KEY_SECRET
CONSUMER_KEY = os.environ.get('CONSUMER_KEY')
CONSUMER_SECRET = os.environ.get('CONSUMER_SECRET')
ACCESS_KEY = os.environ.get('ACCESS_KEY')
ACCESS_KEY_SECRET = os.environ.get('ACCESS_KEY_SECRET')

# tweepyの設定
auth = tweepy.OAuth1UserHandler(
    CONSUMER_KEY, CONSUMER_SECRET, ACCESS_KEY, ACCESS_KEY_SECRET)
api = tweepy.API(auth)


class Slack():
    """
    Notification Class to configure the settings for the Slack API
    """
    def __init__(self, date, ohlcv):
        self.__date = date
        self.text = self.__format_text(ohlcv)

    @property
    def date(self):
        """
        Property of date to be displayed in Slack text
        :return: Date
        """
        return self.__date

    def __format_text(self, ohlcv):
        """
        Create params data for sending Slack notification with API.
        :param dict[str, str, str, str, str, str] ohlcv:
        :type ohlcv: {
            'Date': '2020-12-29',
            'Open': '7620',
            'High': '8070',
			'Low': '7610',
			'Close': '8060',
			'Volume': '823700'
        }
        :return: String
        """
        open_ = Decimal(str(ohlcv['Open'])).quantize(
            Decimal('0.01'), rounding=ROUND_HALF_UP)
        high_ = Decimal(str(ohlcv['High'])).quantize(
            Decimal('0.01'), rounding=ROUND_HALF_UP)
        low_ = Decimal(str(ohlcv['Low'])).quantize(
            Decimal('0.01'), rounding=ROUND_HALF_UP)
        close_ = Decimal(str(ohlcv['Close'])).quantize(
            Decimal('0.01'), rounding=ROUND_HALF_UP)

        text = f"本日は{self.date.strftime('%Y年%m月%d日')}です。\n" \
               f"取得可能な最新日付の株価情報をお知らせします。 \n\n"\
               f"*銘柄*  {str(stock_code)}\n" \
               f"*日付*  {str(ohlcv['Date'])}\n" \
               f"*始値*  {str(open_)}\n" \
               f"*高値*  {str(high_)}\n" \
               f"*安値*  {str(low_)}\n" \
               f"*終値*  {str(close_)}\n" \
               f"*出来高*  {float(ohlcv['Volume'])}"
        return text

    def post(self):
        """
        POST request to Slack file upload API
        API docs: https://slack.com/api/files.upload
        """
        # The name of the file you're going to upload
        file = open(f"/tmp/{str(self.date)}.png", 'rb')
        title = f"{str(self.date)}.png"
        # Call the files.upload method using the WebClient
        # Uploading files requires the `files:write` scope
        try:
            client.files_upload(
                channels=channel_id,
                initial_comment=self.text,
                file=file,
                title=title
            )
        except Exception as e:
            print(e)


class Twitter():
    """
    Notification Class to configure the settings for the Twitter API
    """
    def __init__(self, date, ohlcv):
        self.__date = date
        self.text = self.__format_text(ohlcv)

    @property
    def date(self):
        """
        Property of date to be displayed in Slack text
        :return: Date
        """
        return self.__date

    def __format_text(self, ohlcv):
        """
        Create params data for sending Twitter notification with API.
        :param dict[str, str, str, str, str, str] ohlcv:
        :type ohlcv: {
            'Date': '2020-12-29',
            'Open': '7620',
            'High': '8070',
			'Low': '7610',
			'Close': '8060',
			'Volume': '823700'
        }
        :return: String
        """
        open_ = Decimal(str(ohlcv['Open'])).quantize(
            Decimal('0.01'), rounding=ROUND_HALF_UP)
        high_ = Decimal(str(ohlcv['High'])).quantize(
            Decimal('0.01'), rounding=ROUND_HALF_UP)
        low_ = Decimal(str(ohlcv['Low'])).quantize(
            Decimal('0.01'), rounding=ROUND_HALF_UP)
        close_ = Decimal(str(ohlcv['Close'])).quantize(
            Decimal('0.01'), rounding=ROUND_HALF_UP)

        text = f"本日は{self.date.strftime('%Y年%m月%d日')}です。\n" \
               f"取得可能な最新日付の株価情報をお知らせします。 \n\n"\
               f"銘柄  {str(stock_code)}\n" \
               f"日付  {str(ohlcv['Date'])}\n" \
               f"始値  {str(open_)}\n" \
               f"高値  {str(high_)}\n" \
               f"安値  {str(low_)}\n" \
               f"終値  {str(close_)}\n" \
               f"出来高  {float(ohlcv['Volume'])}"
        return text

    def post(self):
        """
        POST request to Twitter API
        API docs: https://developer.twitter.com/en/docs/twitter-api/api-reference-index
        """
        # The name of the file you're going to upload
        file = open(f"/tmp/{str(self.date)}.png", 'rb')
        title = f"{str(self.date)}.png"
        # Call the files.upload method using the WebClient
        # Uploading files requires the `files:write` scope
        try:
            file_names = ['/tmp/' + title, ]
            media_ids = []
            for filename in file_names:
                res = api.media_upload(filename)
                media_ids.append(res.media_id)
            # tweet with multiple images
            api.update_status(status=self.text + "\n\n" +
                              title, media_ids=media_ids)
        except Exception as e:
            print(e)


def generate_stock_chart_image():
    """
    Generate a six-month stock chart image with mplfinance
    """
    dataframe = pd.read_csv(
        f"/tmp/{str(today)}.csv", index_col=0, parse_dates=True)
    # The return value `Date` from yahoofinance is sorted by asc, so change it to desc for plot
    dataframe = dataframe.sort_values('Date')
    date = dataframe.index

    # 基準線
    high = dataframe['High']
    low = dataframe['Low']

    max26 = high.rolling(window=26).max()
    min26 = low.rolling(window=26).min()

    dataframe['basic_line'] = (max26 + min26) / 2

    dataframe.tail()
    """
    plt.figure(figsize=(16, 6))
    plt.plot(dataframe['basic_line'], label='basic')
    plt.xlabel('Date')
    plt.ylabel('Price')
    plt.legend()
    plt.grid()
    #plt.show()
    """
    # 転換線
    high9 = high.rolling(window=9).max()
    low9 = low.rolling(window=9).min()

    dataframe['turn_line'] = (high9 + low9) / 2

    dataframe.tail()
    """
    plt.figure(figsize=(16, 6))
    plt.plot(dataframe['basic_line'], label='basic')
    plt.plot(dataframe['turn_line'], label='turn')
    plt.xlabel('Date')
    plt.ylabel('Price')
    plt.legend()
    plt.grid()
    #plt.show()
    """
    # 雲形
    dataframe['span1'] = (dataframe['basic_line'] + dataframe['turn_line']) / 2

    high52 = high.rolling(window=52).max()
    low52 = low.rolling(window=52).min()

    dataframe['span2'] = (high52 + low52) / 2

    dataframe.tail()
    """
    plt.figure(figsize=(16, 6))
    plt.plot(dataframe['basic_line'], label='basic')
    plt.plot(dataframe['turn_line'], label='turn')
    plt.fill_between(date, dataframe['span1'], dataframe['span2'],
                     facecolor="gray", alpha=0.5, label="span")
    plt.xlabel('Date')
    plt.ylabel('Price')
    plt.legend()
    plt.grid()
    #plt.show()
    """
    # 遅行線
    dataframe['slow_line'] = dataframe['Adj Close'].shift(-25)

    dataframe.head()
    """
    plt.figure(figsize=(16, 6))
    plt.plot(dataframe['basic_line'], label='basic')
    plt.plot(dataframe['turn_line'], label='turn')
    plt.fill_between(date, dataframe['span1'], dataframe['span2'],
                     facecolor="gray", alpha=0.5, label="span")
    plt.plot(dataframe['slow_line'], label='slow')
    plt.xlabel('Date')
    plt.ylabel('Price')
    plt.legend()
    plt.grid()
    #plt.show()
    """
    # ボリンジャーバンド用のdataframe追加
    dataframe["upper"], dataframe["middle"], dataframe["lower"] = ta.BBANDS(
        dataframe['Adj Close'], timeperiod=25, nbdevup=2, nbdevdn=2, matype=0)
    dataframe.tail()

    # ボリンジャーバンドプロット
    apds = [mpf.make_addplot(dataframe['upper'], color='g'),
            mpf.make_addplot(dataframe['middle'], color='b'),
            mpf.make_addplot(dataframe['lower'], color='r')
            ]

    # MACD用のdataframe追加
    dataframe['macd'], dataframe['macdsignal'], dataframe['macdhist'] = ta.MACD(
        dataframe['Adj Close'], fastperiod=12, slowperiod=26, signalperiod=9)
    dataframe.tail()

    # RSIデータフレーム追加
    dataframe["RSI"] = ta.RSI(dataframe["Adj Close"], timeperiod=25)
    dataframe.tail()

    # 基準線、転換線、雲、遅行線の追加
    apds = [mpf.make_addplot(dataframe['upper'], color='g'),
            mpf.make_addplot(dataframe['middle'], color='b'),
            mpf.make_addplot(dataframe['lower'], color='r'),
            mpf.make_addplot(dataframe['macdhist'], type='bar',
                             width=1.0, panel=1, color='gray', alpha=0.5, ylabel='MACD'),
            mpf.make_addplot(dataframe['RSI'], panel=2,
                             type='line', ylabel='RSI'),
            mpf.make_addplot(dataframe['basic_line']),  # 基準線
            mpf.make_addplot(dataframe['turn_line']),  # 転換線
            mpf.make_addplot(dataframe['slow_line']),  # 遅行線
            ]
    """
    # 保存
    mpf.plot(dataframe, type='candle', addplot=apds, figsize=(30, 10), style='sas',
             volume=True, volume_panel=3, panel_ratios=(5, 2, 2, 1), savefig=f"/tmp/{str(today)}.png")

    # ローソク足
    mpf.plot(dataframe, type='candle', figsize=(16, 6),
             style='sas', xrotation=0, volume=True, addplot=apds)
    """
    """
    mplfinanceに凡例を追加する方法は現状これしかないようです(https://github.com/matplotlib/mplfinance/issues/181)
    mplfinanceのfill_between(https://github.com/matplotlib/mplfinance/blob/master/examples/plot_customizations.ipynb)
    """
    labels = ["basic", "turn", "slow", "span"]

    fig, ax = mpf.plot(dataframe, type='candle', figsize=(16, 9),
                       style='sas', xrotation=0, volume=True, addplot=apds, returnfig=True,
                       volume_panel=3, panel_ratios=(5, 2, 2, 1),
                       fill_between=dict(
                           y1=dataframe['span1'].values, y2=dataframe['span2'].values, alpha=0.5, color='gray'),
                       savefig=f"/tmp/{str(today)}.png"
                       )
    ax[0].legend(labels)
    #plt.grid()
    #plt.show()
    """
    mpf.plot(dataframe, type='candle', figratio=(12, 4),
             volume=True, mav=(5, 25), style='sas',
             savefig=f"/tmp/{str(today)}.png")
    """

def generate_csv_with_datareader():
    global is_today
    """
    Generate a csv file of OHLCV with date with yahoofinance API
    """
    # 株価推移の開始日を指定(6ヶ月を指定)
    start_date = today - relativedelta(months=6)
    # end_date = today + relativedelta(days=1)
    # yahoofinanceのライブラリ経由でAPIを叩く(stock_codeは環境変数で株コードを指定)
    df = data.DataReader(stock_code, 'yahoo', start_date, today)
    #df = data.get_data_yahoo(stock_code, start=start_date, end=end_date)
    df = df[['High', 'Low', 'Open', 'Close', 'Adj Close', 'Volume']]
    df.tail()

    # APIで取得したデータを一旦CSVファイルにする
    df = df.sort_values(by='Date', ascending=False)
    df.to_csv(f"/tmp/{str(today)}.csv")
    # print(df)

    wk_date = df.index[0].strftime('%Y-%m-%d')
    wk_today = today.strftime('%Y-%m-%d')

    if wk_date == wk_today:
        is_today = 'Y'

def lambdahandler(event, context):
    global is_today
    """
    lambda_handler
    """
    logging.info(json.dumps(event))

    print('event: {}'.format(event))
    print('context: {}'.format(context))
    """
    The main function that will be executed when this Python file is executed
    """
    generate_csv_with_datareader()

    if is_today == 'Y':

        generate_stock_chart_image()

        #if "challenge" in event["body"]:
        #    return event["body"]["challenge"]

        with open(f"/tmp/{str(today)}.csv", 'r', encoding="utf-8") as file:
            # Skip header row
            reader = csv.reader(file)
            header = next(reader)
            for i, row in enumerate(csv.DictReader(file, header)):
                # Send only the most recent data to Slack notification
                if i == 0:
                    Slack(today, row).post()
                    Twitter(today, row).post()

    return {
        'statusCode': 200,
        'body': 'ok'
    }


if __name__ == "__main__":
    print(lambdahandler(event=None, context=None))
※2021/07/01午後(JST)以降、yahoofinance.com の履歴データAPIが廃止されたため、pandas-datareader で株価を取得することができなくなっていましたが、> 0.10.0 へバージョンアップすることで解消されました。
★コンテナイメージによるLambdaへのデプロイにおける過程でエラーが生じ、その解決策として、Sub化していた slack.py, twitter.py をMainプログラムへ統合しました。
もっと上手い方法があるかも知れません。何卒ご容赦を。
参考
対象動画の書き起こしブログ:
編集後記
株価や為替、暗号資産の値動きなどの分析・予測には様々な指標が用いられます。
多くの指標がありますが、ご自身の投資目的や経験に基づいて、最適な指標を選ぶことが求められます。いろいろな指標の算出を試してみるのも新たな発見があり、面白いと思います。
テクニカル分析によって、投資に興味を持った方はぜひ予測や、実際の投資にもチャレンジしてみてはいかがでしょうか。
私も機械学習について理解を深めて、予測まで漕ぎ着けたいと思います。
●課題
★解決しました。(2021/08/08)
libta_lib.so.0: cannot open shared object file: No such file or directory
これについては、Dockerfile にて、RUN cp -pa /usr/local/lib/libta_lib.so.0* /var/task/ と記述することで、該当のファイルを Lambda からの起動時に読み込むことができました。
Dockerfile
FROM public.ecr.aws/lambda/python:3.8
ENV AWS_DEFAULT_REGION ap-northeast-1

# install build libs
RUN yum groupinstall -y "Development Tools" \
    && yum install -y which openssl

RUN yum -y install wget
RUN yum -y install tar
RUN yum -y install gzip

# install TA-Lib
WORKDIR /tmp
RUN wget --quiet http://prdownloads.sourceforge.net/ta-lib/ta-lib-0.4.0-src.tar.gz -O ta-lib-0.4.0-src.tar.gz && \
    tar -zxvf ta-lib-0.4.0-src.tar.gz && \
    cd ta-lib/ && \
    ./configure --prefix=/usr/local/ && \
    make && \
    make check && \
    make install && \
    cd .. && \
    python3 -m pip install TA-Lib && \
    rm -R ta-lib ta-lib-0.4.0-src.tar.gz

RUN export LD_LIBRARY_PATH=/usr/local/lib:$LD_LIBRARY_PATH

RUN cp -pa /usr/local/lib/libta_lib.so.0* /var/task/

RUN python3 -m pip install --upgrade TA-Lib --user --global-option='build_ext' --global-option="-I/usr/local/include" --global-option="-L/usr/local/lib"

RUN python3 -m pip install numpy

COPY ./requirements.txt /opt/
RUN python3 -m pip install --upgrade pip && \
    python3 -m pip install -r /opt/requirements.txt -t /var/task

WORKDIR /var/task
COPY handler.py .

CMD [ "handler.lambdahandler" ]
requirements.txt
Cycler
Pillow
awslambdaric
cPython
certifi
chardet
idna
kiwisolver
lxml
matplotlib
mplfinance
# numpy
pandas-datareader
pandas
pyparsing
python-dateutil
python-dotenv
pytz
six
slack-sdk
# TA-Lib
urllib3
boto3
tweepy
aiohttp
- 参考:
(★以上、2021/08/08 追記)
元の課題
↓↓↓↓↓↓↓
Lambda での定期実行としたく、コンテナイメージからのデプロイを試みていますが、関数を実行すると、TA-Libを呼び出す際にエラーが発生してしまいます。
libta_lib.so.0: cannot open shared object file: No such file or directory
⇒ DockerFileの指定方法が悪く、TA-Lib内のruntimeファイルをインストールできていないのではと推測しています。引き続き、原因究明・解決に努めます。
{
  "errorMessage": "Unable to import module 'handler': libta_lib.so.0: cannot open shared object file: No such file or directory",
  "errorType": "Runtime.ImportModuleError",
  "stackTrace": []
}
START RequestId: eabdc8a8-a22f-4e07-88b4-dda1582b5bb6 Version: $LATEST
Import Error - unzip_requirements
OpenBLAS WARNING - could not determine the L2 cache size on this system, assuming 256k
[WARNING]    2021-06-06T07:01:46.095Z        Matplotlib created a temporary config/cache directory at /tmp/matplotlib-i7nui6jm because the default path (/home/sbx_user1051/.config/matplotlib) is not a writable directory; it is highly recommended to set the MPLCONFIGDIR environment variable to a writable directory, in particular to speed up the import of Matplotlib and to better support multiprocessing.
[ERROR] Runtime.ImportModuleError: Unable to import module 'handler': libta_lib.so.0: cannot open shared object file: No such file or directory
Traceback (most recent call last):
END RequestId: eabdc8a8-a22f-4e07-88b4-dda1582b5bb6
REPORT RequestId: eabdc8a8-a22f-4e07-88b4-dda1582b5bb6    Duration: 4599.39 ms    Billed Duration: 4600 ms    Memory Size: 1024 MB    Max Memory Used: 80 MB
Discussion