🚀
Box-Muller変換の証明とシュミレーション
Box-Muller変換
はじめに以下の確率変数を定義する.
以下の確率変数変換を考える.
このとき,以下が成り立つ.
証明
はじめに以下の確率変数を定義する.
この確率変数について,以下の変数変換を考える.
逆変換は以下である.
ここで,ヤコビアンは以下のように計算される.
これで,
次に,曲座標変換を用いる.
ここで,
上式を用いると,ヤコビアンを計算できる.
よって求めるX, Yの分布は以下のように定まる.
したがって、
シュミレーション
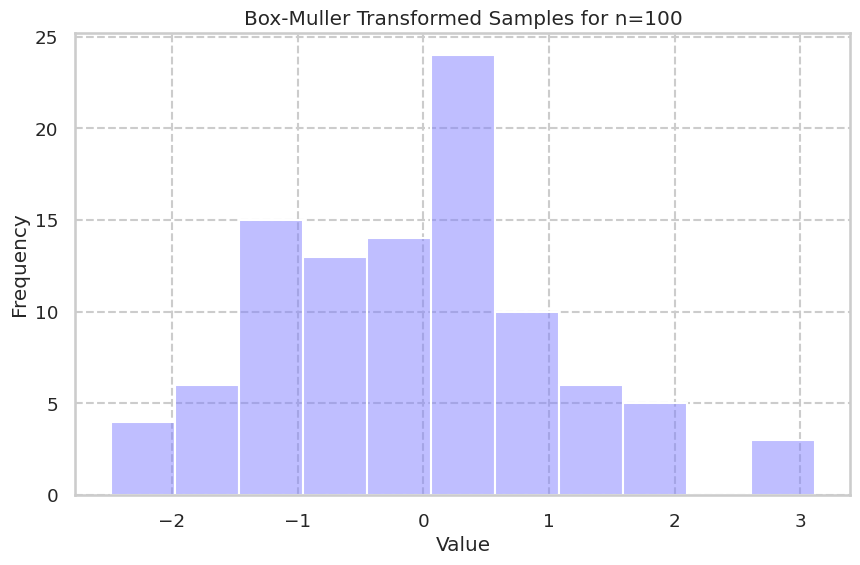
実際にこの変換がうまくいくのか検証を行う.
プログラムを作成する
描画する部分以外は標準関数とmath mouduleのみで動く.実装に際して,generate_samples(n: int)でn // 2を行なっているが,これは,Box-Muller変換が一度に二つの確率変数を生成するためである.
from typing import Tuple

import random
import math
import matplotlib.pyplot as plt
import seaborn as sns


def generate_uniform_random_pair() -> Tuple[float, float]:
    """ 独立に一様分布に従う2つの乱数を生成する。 """
    u1 = random.random()
    u2 = random.random()
    return u1, u2

def box_muller_transform(u1: float, u2: float) -> Tuple[float, float]:
    """ Box-Muller 変換を使用して、独立に一様分布に従う2つの乱数を正規分布に確率変数変換する。 """
    z0 = math.sqrt(-2.0 * math.log(u1)) * math.cos(2.0 * math.pi * u2)
    z1 = math.sqrt(-2.0 * math.log(u1)) * math.sin(2.0 * math.pi * u2)
    return z0, z1

def generate_samples(n: int):
    """ n 個の正規分布に変換された乱数を生成する。 """
    samples = []
    for _ in range(n // 2):
        u1, u2 = generate_uniform_random_pair()
        z0, z1 = box_muller_transform(u1, u2)
        samples.append(z0)
        samples.append(z1)
    return samples[:n]

# Seaborn and Matplotlibの準備
sns.set()
sns.set_style("whitegrid", {'grid.linestyle': '--'})
sns.set_context("talk", 0.8, {"lines.linewidth": 0})
colors = sns.color_palette("cool", 5)

# サンプルサイズを指定
sample_sizes = [10, 50, 100, 1000, 10000]

# それぞれのサイズでシュミレーションを行い, 結果を描画する
for i, n in enumerate(sample_sizes):
    samples = generate_samples(n)
    plt.figure(figsize=(10, 6))  # Fixed size for all figures
    sns.histplot(samples, kde=True, color=colors[i], binwidth=0.5)
    plt.title(f'Box-Muller Transformed Samples for n={n}')
    plt.xlabel('Value')
    plt.ylabel('Frequency')
    plt.show()
結果
nのオーダーが


二項分布の正規近似との比較
二項分布のnを大にすると正規近似できる.


n=10000で比べるとあまり違いはわからない.

計算速度
Colabで回していた時に気づいたが,Box-Muller変換によるサンプリングは重い.
Marsaglia polar methodやZiggurat algorithmなどと比べると,三角関数と対数関数を使っている影響かもしれない.(ベンチマークは他の方に譲ります)
Discussion