Amazon Managed Grafana 環境を AWS CLI で作成して S3 のメトリクスを表示してみた
Amazon Managed Grafana で S3 のメトリクスを表示してみた
上記の CLI 版です。
前提
- AWS Organizations の管理アカウントで IAM Identity Center を有効化済み
- IAM Identity Center でユーザーを作成済み
- コマンド実行環境は CloudShell
- GUI から Managed Grafana 環境を作成したことがあるアカウントを使用
1. Managed Grafana ワークスペースの作成
create-workspace — AWS CLI 2.28.25 Command Reference
workspace-role-arn には GUI から Managed Grafana 環境を作成した際に作成された AmazonGrafanaServiceRole-xxx という IAM ロールの ARN を指定します。
$ aws grafana create-workspace \
--account-access-type CURRENT_ACCOUNT \
--authentication-providers AWS_SSO \
--permission-type SERVICE_MANAGED \
--workspace-role-arn your-iam-role
2. IAM Identity Center ユーザーの割り当て
update-permissions — AWS CLI 2.28.25 Command Reference
- workspace-id: 手順 1 で作成した環境の ID
- users の id: IAM Identity Center ユーザーのユーザー ID
$ aws grafana update-permissions \
--workspace-id workspace-id \
--update-instruction-batch '[
    {
        "action": "ADD",
        "role": "ADMIN",
        "users": [
            {
                "id": "user-id",
                "type": "SSO_USER"
            }
        ]
    }
]'
3. データソースのサービスマネージド型ポリシーの有効化
update-workspace — AWS CLI 2.28.25 Command Reference
データソースの追加だけでは IAM ロールにポリシーが付与されないため、明示的にポリシーをアタッチします。
$ aws grafana update-workspace \
--workspace-id workspace-id \
--workspace-data-sources CLOUDWATCH

$ aws iam attach-role-policy \
--role-name your-iam-role-name \
--policy-arn arn:aws:iam::aws:policy/service-role/AmazonGrafanaCloudWatchAccess
AWS CLI での手順はここまででです。
Grafana ワークスペース内での操作については Grafana HTTP API で実施します。
ただし、API の利用にあたってトークンの作成が必要なため、GUI からトークンを作成します。
4. トークンの作成
Grafana ワークスペースへのアクセス後、Administration > User and access > Service accounts をひらきます。
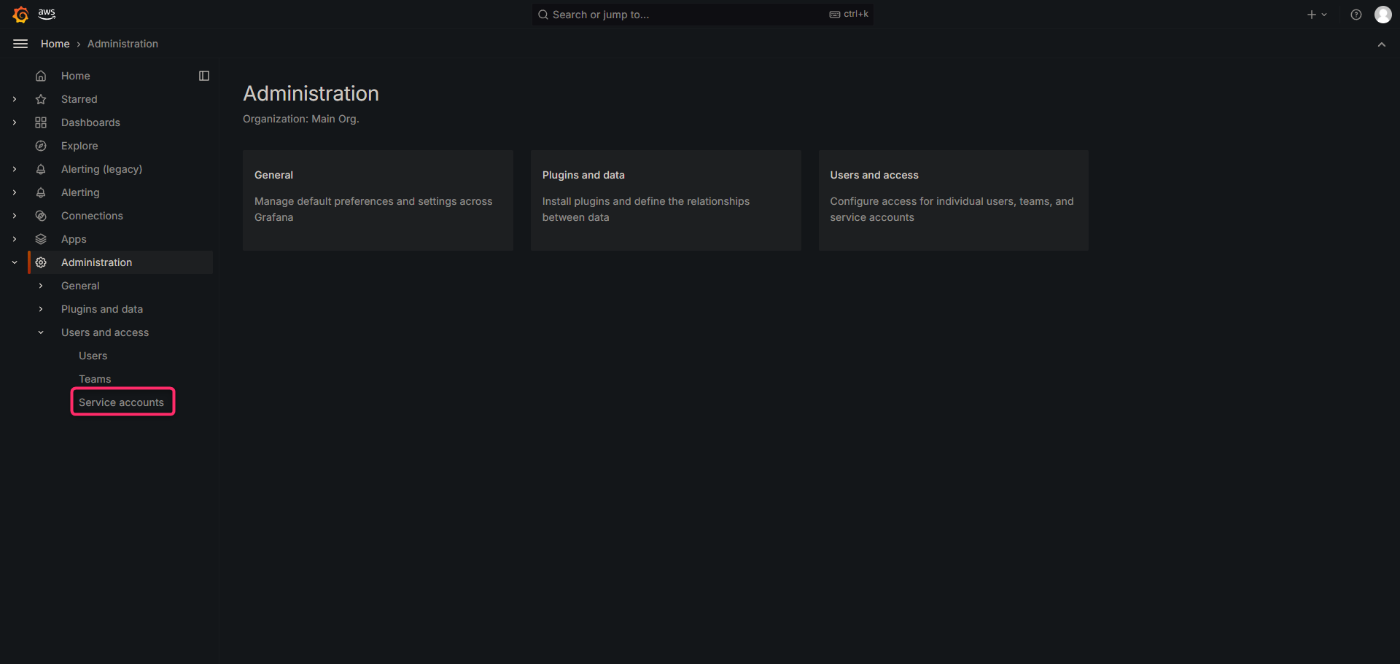
Add service account をクリックします。
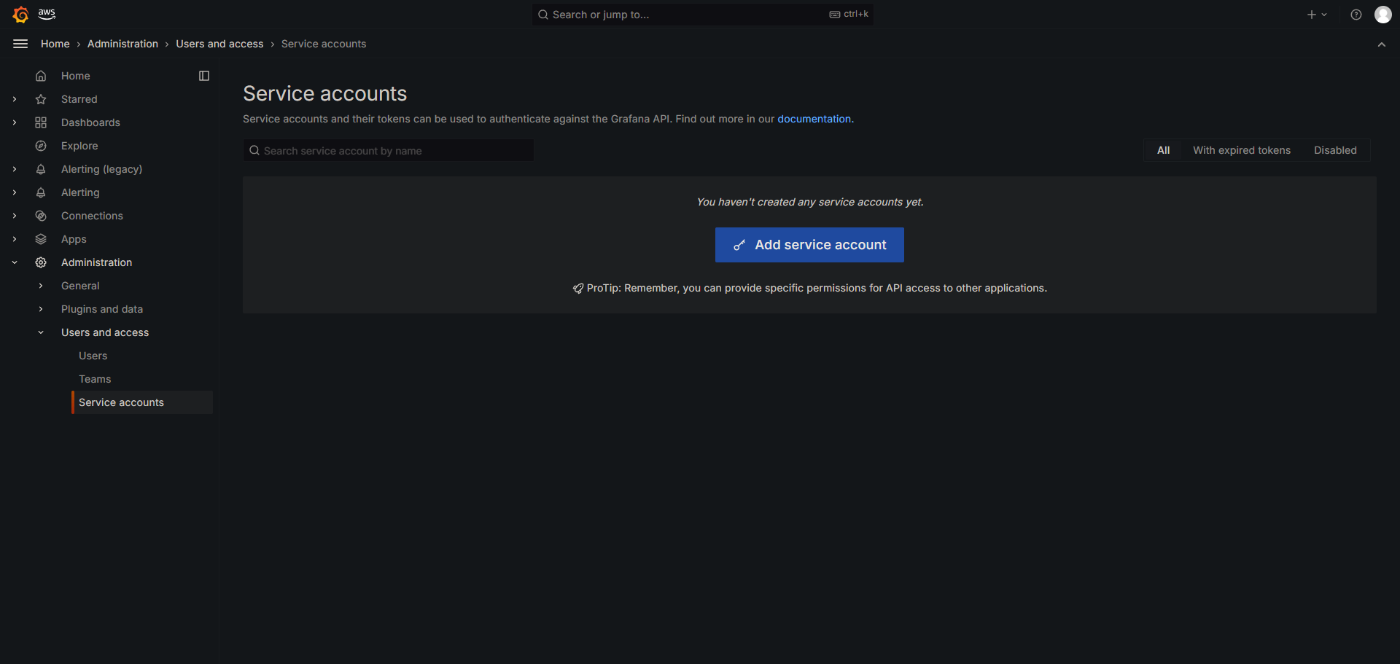
任意の Display name を入力し、Role は Admin を選択して Create をクリックします。

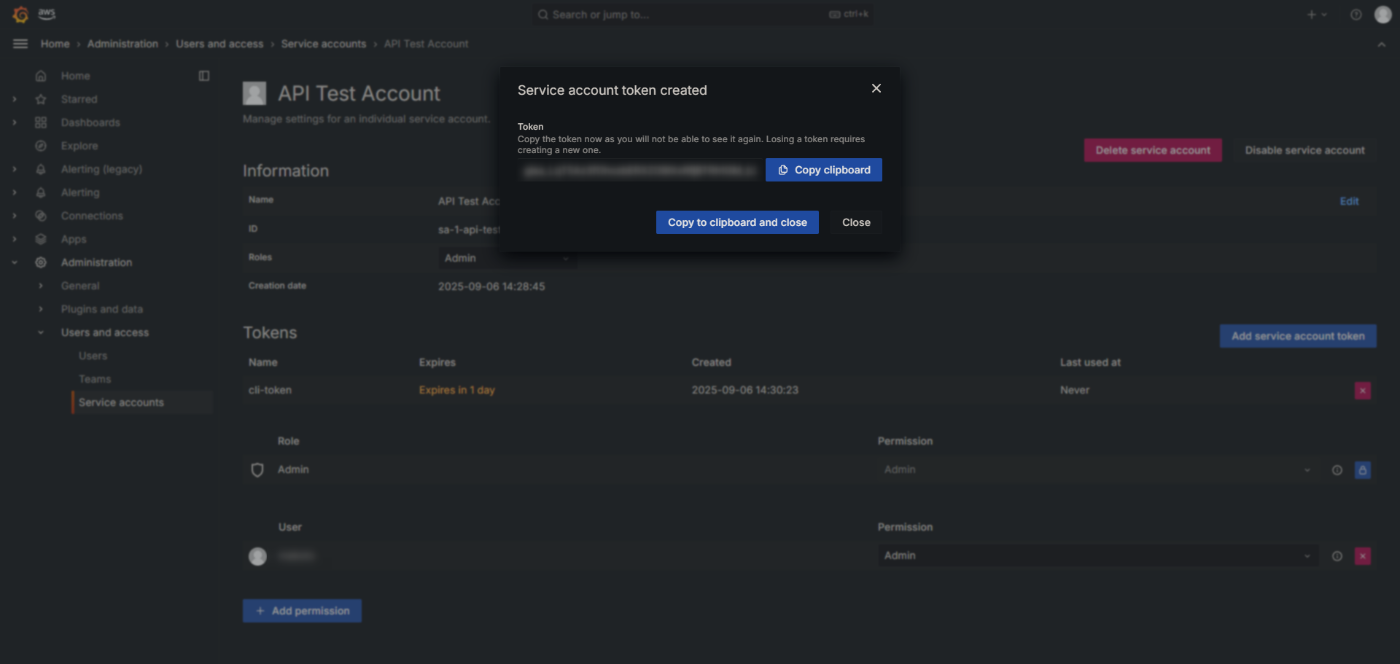
Add service account token をクリックします。

任意の Display name を入力し、Generate token をクリックします。

トークンの値はこの画面でのみ確認可能なため、必ずコピーしておいてください。
5. API のテスト
トークンを使用して Grafana HTTP API エンドポイントに接続してみます。
- YOUR_TOKEN: 手順 4 でコピーしたトークンの値
- YOUR_WORKSPACE_URL: Amazon Managed Grafana のワークスペース URL
$ curl -H "Authorization: Bearer YOUR_TOKEN" \
-H "Content-Type: application/json" \
"YOUR_WORKSPACE_URL/api/org"

# 以下のようなレスポンスを取得できれば OK
{
  "id": 1,
  "name": "Main Org.",
  "address": {
    "address1": "",
    "address2": "",
    "city": "",
    "zipCode": "",
    "state": "",
    "country": ""
  }
}
6. データソースの追加
CloudWatch をデータソースに追加します。
curl -X POST \
     -H "Authorization: Bearer YOUR_TOKEN" \
     -H "Content-Type: application/json" \
     -d '{
       "name": "CloudWatch-API",
       "type": "cloudwatch",
       "access": "proxy",
       "jsonData": {
         "defaultRegion": "ap-northeast-1"
       }
     }' \
     "YOUR_WORKSPACE_URL/api/datasources"

# 以下のようなレスポンスを取得できれば OK
{
  "datasource": {
    "id": 1,
    "uid": "dex8b5vgvp79cf",
    "orgId": 1,
    "name": "CloudWatch-API",
    "type": "cloudwatch",
    "typeLogoUrl": "public/app/plugins/datasource/cloudwatch/img/amazon-web-services.png",
    "access": "proxy",
    "url": "",
    "user": "",
    "database": "",
    "basicAuth": false,
    "basicAuthUser": "",
    "withCredentials": false,
    "isDefault": true,
    "jsonData": { "defaultRegion": "ap-northeast-1" },
    "secureJsonFields": {},
    "version": 1,
    "readOnly": false
  },
  "id": 1,
  "message": "Datasource added",
  "name": "CloudWatch-API"
}
データソースの追加状況は以下のコマンドで確認できます。
$ curl -H "Authorization: Bearer YOUR_TOKEN" \
       -H "Content-Type: application/json" \
       "YOUR_WORKSPACE_URL/api/datasources"

# 以下のようなレスポンスを取得できれば OK
[
  {
    "id": 1,
    "uid": "dex8b5vgvp79cf",
    "orgId": 1,
    "name": "CloudWatch-API",
    "type": "cloudwatch",
    "typeName": "CloudWatch",
    "typeLogoUrl": "public/app/plugins/datasource/cloudwatch/img/amazon-web-services.png",
    "access": "proxy",
    "url": "",
    "user": "",
    "database": "",
    "basicAuth": false,
    "isDefault": true,
    "jsonData": { "defaultRegion": "ap-northeast-1" },
    "readOnly": false
  }
]
7. S3 のメトリクスを取得してみる
CloudWatch データソースから S3 のメトリクスを取得してみます。
- datasource の uid: 手順 6 のデータソース作成時に取得した uid
- BucketName: メトリクスを確認したい S3 バケット名
curl -X POST \
     -H "Authorization: Bearer YOUR_TOKEN" \
     -H "Content-Type: application/json" \
     -d '{
       "queries": [
         {
           "refId": "A",
           "datasource": {
             "type": "cloudwatch",
             "uid": "uid"
           },
           "region": "ap-northeast-1",
           "namespace": "AWS/S3",
           "metricName": "NumberOfObjects",
           "dimensions": {
             "BucketName": "your-bucket-name",
             "StorageType": "AllStorageTypes"
           },
           "statistic": "Average",
           "period": "86400"
         }
       ],
       "from": "now-7d",
       "to": "now"
     }' \
     "YOUR_WORKSPACE_URL/api/ds/query"

# 以下のようなレスポンスを取得できれば OK
{
  "results": {
    "A": {
      "status": 200,
      "frames": [
        {
          "schema": {
            "name": "NumberOfObjects",
            "refId": "A",
            "meta": {
              "typeVersion": [0, 0],
              "custom": "{\n\t\t\t\"period\": 86400,\n\t\t\t\"id\":     query317d84ebca96438789ea248dbdd2d9c3,\n\t\t}"
            },
            "fields": [
              {
                "name": "Time",
                "type": "time",
                "typeInfo": { "frame": "time.Time", "nullable": true }
              },
              {
                "name": "Value",
                "type": "number",
                "typeInfo": { "frame": "float64", "nullable": true },
                "labels": {
                  "BucketName": "xxx",
                  "StorageType": "AllStorageTypes"
                },
                "config": {
                  "displayNameFromDS": "NumberOfObjects",
                  "links": [
                    {
                      "title": "View in CloudWatch console",
                      "targetBlank": true,
                      "url": "https://ap-northeast-1.console.aws.amazon.com/cloudwatch/deeplink.js?region=ap-northeast-1..."
                    }
                  ]
                }
              }
            ]
          },
          "data": {
            "values": [
              [
                1756532520000, 1756618920000, 1756705320000, 1756791720000,
                1756878120000, 1756964520000
              ],
              [2610, 2610, 2610, 2610, 2610, 2610]
            ]
          }
        }
      ]
    }
  }
}
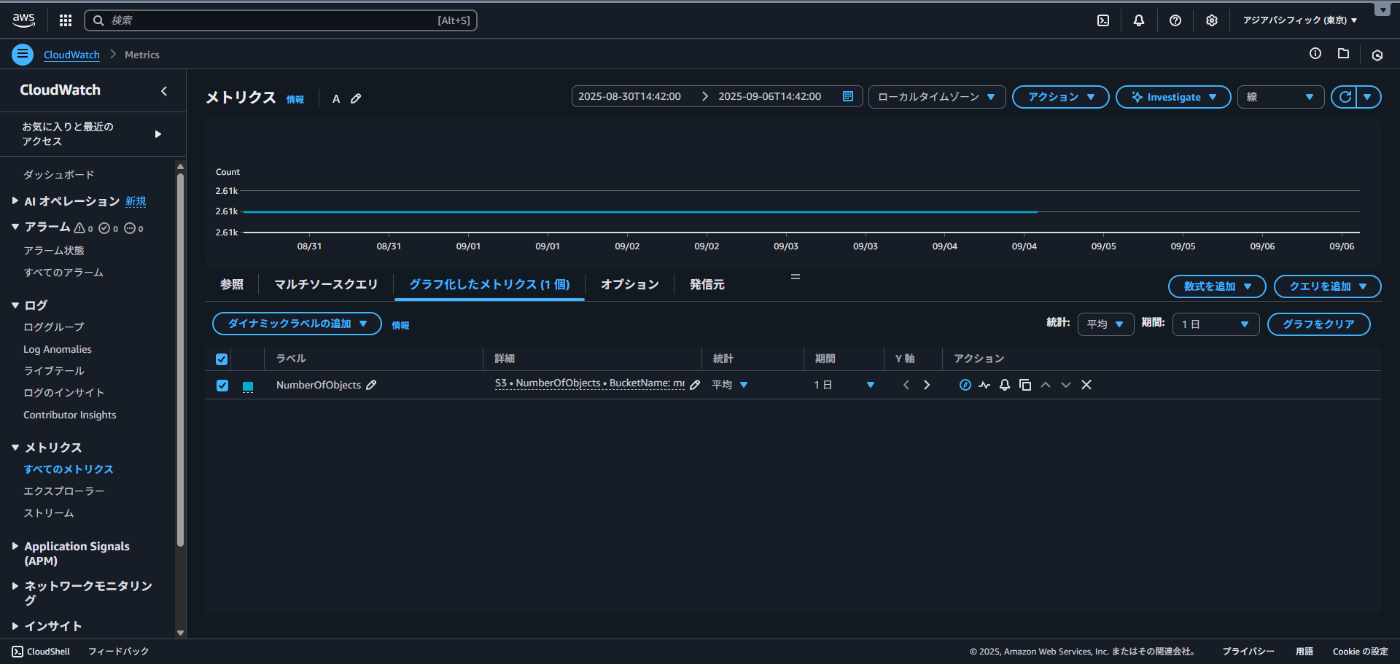
8. リンクを確認してみる
手順 7 のコマンドで取得した結果には url が含まれており、CloudWatch コンソールでメトリクスを表示できます。
まとめ
今回は Amazon Managed Grafana 環境を AWS CLI で作成して S3 のメトリクスを表示してみました。
どなたかの参考になれば幸いです。
Discussion