🙆
Matplotilb の rcParams を json から読み込む
Maplotlib の図の設定は rcParams で一括調整できます.
ただ,プログラムの冒頭にずらっと設定を列挙するのは,次の 2 点から微妙です.
- Notebook ファイルでは冒頭にタイトルや概要を記述することが多い.
その直下に全く本質的でない rcParams の情報が並んでいると,情報が不必要に分断される. - ファイルごとに同じ設定を書くのは避けたい.面倒なのと,設定を変更しにくいので.
そこで,rcParams を json ファイルに書き,それを python から読み込む方法を紹介します.
初期コード
import matplotlib.pyplot as plt
plt.rcParams.update({
    'font.size': 14,
    'figure.figsize': [5.6, 4],
    'figure.dpi': 120,
    'lines.linewidth': 2,
    'axes.grid': True,
    'axes.labelsize': 20,
    'axes.axisbelow': True,
    'grid.linestyle': ':',
    'grid.linewidth': 0.3,
    'grid.alpha': 0.3,
    'xtick.direction': 'in',
    'xtick.major.pad': 6,
    'xtick.top': True,
    'ytick.direction': 'in',
    'ytick.major.pad': 6,
    'ytick.right': True,
    'legend.handletextpad': 0.5
})
-
plt.rcParams.update:
plt.rcParamsは辞書なのでupdate()で上書きできる
ここから,辞書を json ファイルとして外部化します.
rcParams を json 形式で保存
rcParams.json
{
    "font": {
        "size": 14
    },
    "figure": {
        "figsize": [5.6,4],
        "dpi": 120
    },
    "lines": {
        "linewidth": 2
    },
    "axes": {
        "grid": true,
        "labelsize": 20,
        "axisbelow": true
    },
    "grid": {
        "linestyle": ":",
        "linewidth": 0.3,
        "alpha": 0.3
    },
    "xtick": {
        "direction": "in",
        "major.pad": 6,
        "top": true
    },
    "ytick": {
        "direction": "in",
        "major.pad": 6,
        "right": true
    },
    "legend": {
        "handletextpad": 0.5
    }
}
Python から json 形式の rcParams を読み込む
import matplotlib.pyplot as plt
import json
def to_rc_dict(dict): return {f'{k1}.{k2}': v for k1,d in dict.items() for k2,v in d.items()}
with open('rcParams.json') as f:
    plt.rcParams.update(to_rc_dict(json.load(f)))
- json.load: json ファイルを python オブジェクトとして保存
図の比較
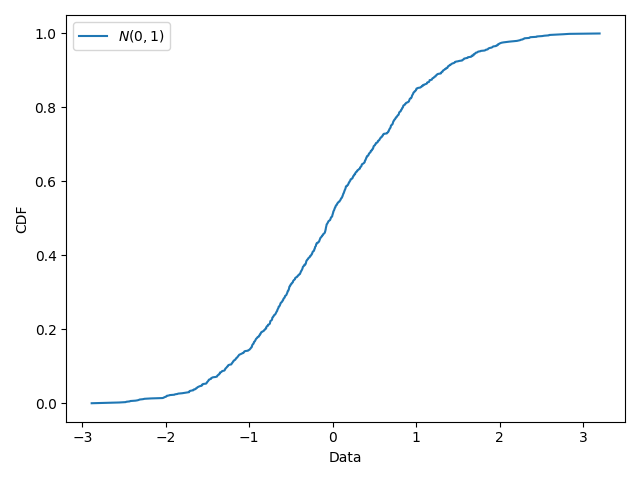
Matplotlib のデフォルト設定

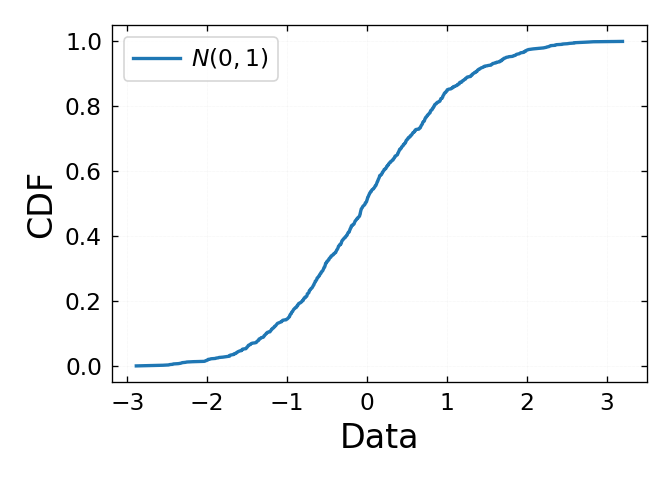
rcParams 設定後

デフォルト設定の不満点
- フォントが小さい
- 線が細い
- 数値の読み取りが楽になるよう
- 上と右にも
tickを生やしたい -
tickを内側に生やしたい(好みが分かれると思います) -
gridを入れたい.ただし,図の主役より目立たぬように.
- 上と右にも
-
gridが棒グラフよりも前面に表示される
参考
rcParams をカスタマイズする際,下記の記事が参考になると思います.
Discussion