🦭
【Processing Method】What is a Bandpass filter?
1. Bandpass filter
Bandpass filter is filter that hinder specific frequnecy range.
It only pass frequency band that was choiced.
・example
import numpy as np
import matplotlib.pyplot as plt
from scipy.signal import butter, filtfilt

# Sample rate and signal duration
fs = 1000  # Sample rate in Hz
t = np.arange(0, 1, 1/fs)  # Time vector

# Create a sample signal: sum of two sine waves (one low frequency, one high frequency)
f1, f2 = 5, 50  # Frequencies of the sine waves in Hz
signal = np.sin(2 * np.pi * f1 * t) + np.sin(2 * np.pi * f2 * t)

# Bandpass filter parameters
lowcut = 30
highcut = 70
order = 2

# Butterworth bandpass filter
nyq = 0.5 * fs  # Nyquist frequency
low = lowcut / nyq
high = highcut / nyq
b, a = butter(order, [low, high], btype='band')

# Apply the filter to the signal
filtered_signal = filtfilt(b, a, signal)

# Plot the original and filtered signals
plt.figure(figsize=(15, 6))

# Original signal
plt.subplot(2, 1, 1)
plt.plot(t, signal)
plt.title('Original Signal')
plt.xlabel('Time [seconds]')
plt.ylabel('Amplitude')

# Filtered signal
plt.subplot(2, 1, 2)
plt.plot(t, filtered_signal)
plt.title('Filtered Signal (Bandpass)')
plt.xlabel('Time [seconds]')
plt.ylabel('Amplitude')

plt.tight_layout()
plt.show()

This structure is eazy.
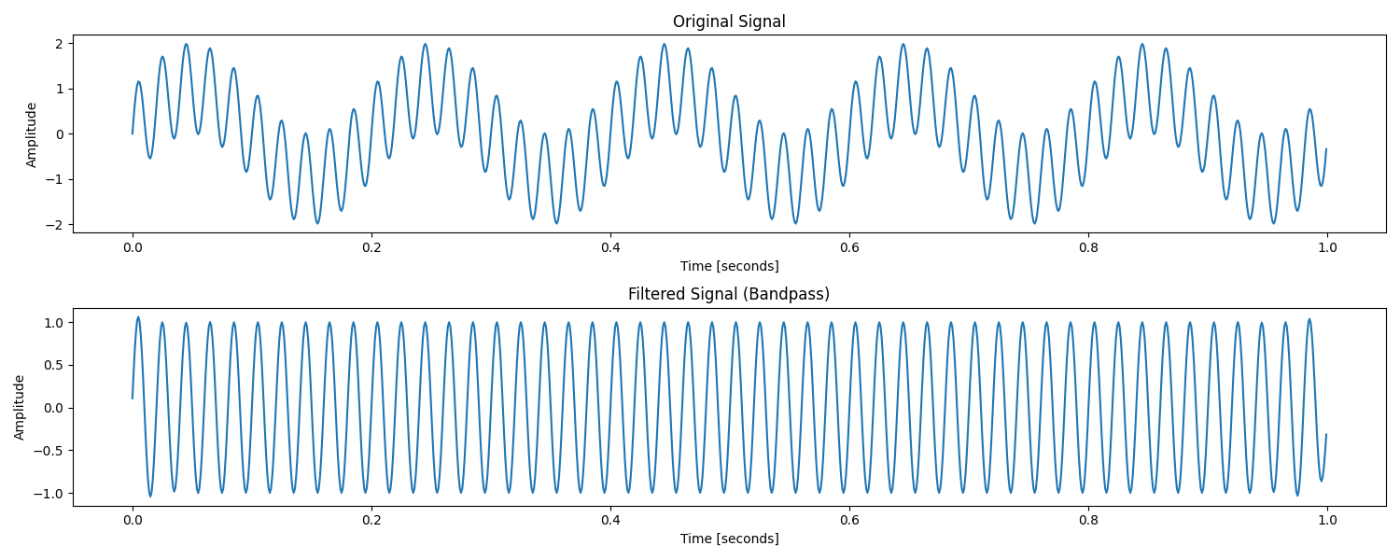
Original Signal contains frequency 5Hz and 50Hz.
But Filtered Signal contains only 50Hz because 5Hz component is filterd.
The band that will filter by bandpass filter is decided by each person who execute filtetring.
Summary
This time, I explained about Bandpass filter.
Thanks to reading.

Discussion