【Data Method】Normalization VS Standardization
1. Which is better Normalization VS Standardization?
Q. Both standardization and normalization are ways to align the input range, but which is better?
A. Try both.
2. Normalization
Definition: Rescaling the data to a range of [0, 1] or [-1, 1].
Formula:
Feature
・Useful when you know the data is not normally distributed. (standardization can treat it better)
・Works well for distance-based algorithms like k-Nearest Neighbors (k-NN), support vector machines (SVMs), or neural networks, where distances between features are important.
Drawbacks
・Sensitive to outliers since the range is based on the minimum and maximum values.
3. Standardization
Definition: Rescaling the data to have a mean of 0 and a standard deviation of 1 (z-score normalization).
Formula:
where
Feature
・Preferred when the data follows a Gaussian (normal) distribution, or you expect the features to have different scales but similar ranges.
・Works well for algorithms that assume normally distributed data, such as linear regression, logistic regression, or any algorithm involving gradient descent.
・Less sensitive to outliers compared to normalization, as the calculation is based on the mean and standard deviation rather than min and max values.
Drawbacks
・The values are transformed into units of standard deviation from the mean. This is not suitable as input for some models like GDBT(Value the magnitude) and has less interpretability.
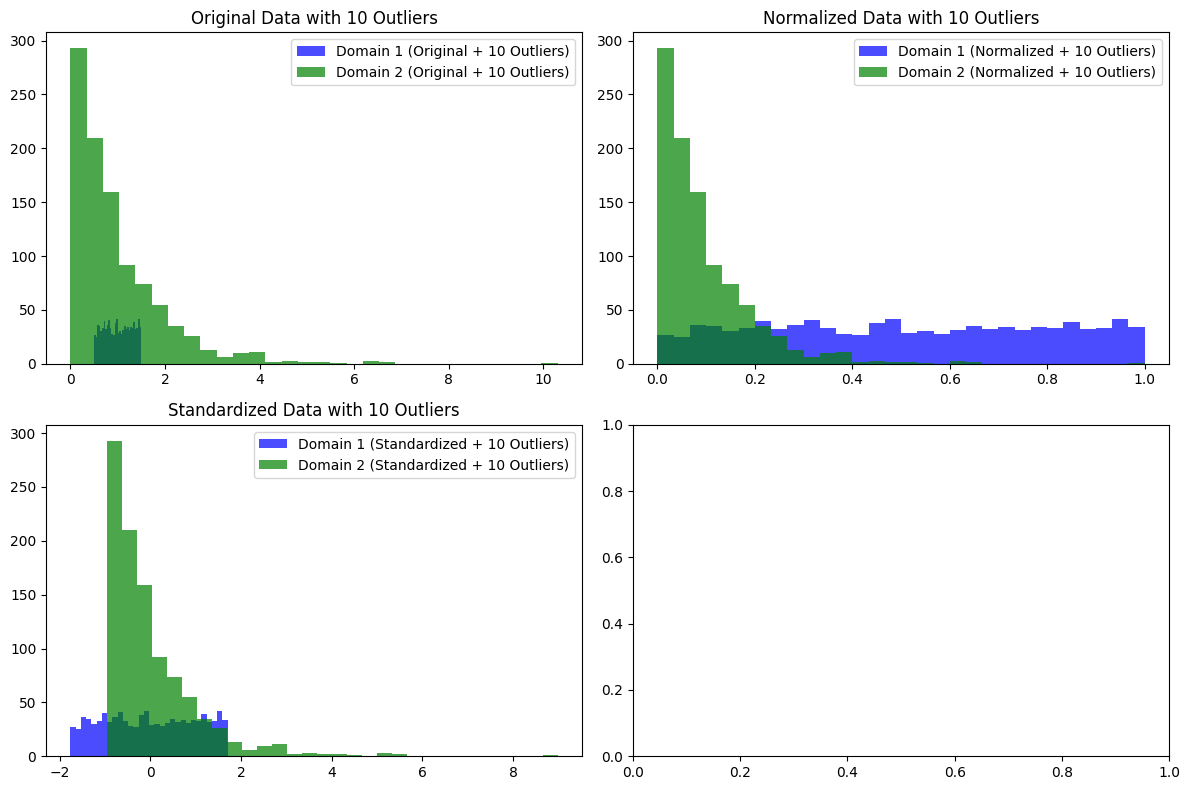
4. Campare with code
・Visualize both
import numpy as np
import matplotlib.pyplot as plt
from sklearn.preprocessing import StandardScaler, MinMaxScaler

gaussian_with_outliners = False
uniform_and_expnential = True

if gaussian_with_outliners:
    # Define the domains for the data
    domain_1 = np.random.normal(1.5, 0.1, 1000)  # Normal distribution with mean 1.5
    domain_2 = np.random.normal(4.5, 0.1, 1000)  # Normal distribution with mean 2.5

    # Add 10 outliers: 8 to the first domain, and 2 to the second domain
    outliers_1 = np.full(20, 3)  # 10 outliers with value 8
    outliers_2 = np.full(20, 3)  # 10 outliers with value 2

    # Append the outliers to the domains
    domain_1_with_outliers = np.append(domain_1, outliers_1)
    domain_2_with_outliers = np.append(domain_2, outliers_2)
elif uniform_and_expnential:
    domain_1 = np.random.uniform(0.5, 1.5, 1000)  # Uniform distribution between 0.5 and 1.5
    domain_2 = np.random.exponential(1.0, 1000)   # Exponential distribution with lambda=1.0

    domain_1_with_outliers = domain_1
    domain_2_with_outliers = domain_2
else:
    domain_1 = np.random.normal(1.5, 0.1, 1000)  # Normal distribution with mean 1.5
    domain_2 = np.random.normal(4.5, 0.1, 1000)  # Normal distribution with mean 2.5


# Apply normalization (Min-Max Scaling)
scaler = MinMaxScaler()
normalized_1_with_outliers = scaler.fit_transform(domain_1_with_outliers.reshape(-1, 1)).flatten()
normalized_2_with_outliers = scaler.fit_transform(domain_2_with_outliers.reshape(-1, 1)).flatten()

# Apply standardization (Z-score normalization)
scaler = StandardScaler()
standardized_1_with_outliers = scaler.fit_transform(domain_1_with_outliers.reshape(-1, 1)).flatten()
standardized_2_with_outliers = scaler.fit_transform(domain_2_with_outliers.reshape(-1, 1)).flatten()

# Plot the original, normalized, and standardized data with 10 outliers
fig, ax = plt.subplots(2, 2, figsize=(12, 8))

# Original data with 10 outliers
ax[0, 0].hist(domain_1_with_outliers, bins=30, color='blue', alpha=0.7, label='Domain 1 (Original + 10 Outliers)')
ax[0, 0].hist(domain_2_with_outliers, bins=30, color='green', alpha=0.7, label='Domain 2 (Original + 10 Outliers)')
ax[0, 0].set_title("Original Data with 10 Outliers")
ax[0, 0].legend()

# Normalized data with 10 outliers
ax[0, 1].hist(normalized_1_with_outliers, bins=30, color='blue', alpha=0.7, label='Domain 1 (Normalized + 10 Outliers)')
ax[0, 1].hist(normalized_2_with_outliers, bins=30, color='green', alpha=0.7, label='Domain 2 (Normalized + 10 Outliers)')
ax[0, 1].set_title("Normalized Data with 10 Outliers")
ax[0, 1].legend()

# Standardized data with 10 outliers
ax[1, 0].hist(standardized_1_with_outliers, bins=30, color='blue', alpha=0.7, label='Domain 1 (Standardized + 10 Outliers)')
ax[1, 0].hist(standardized_2_with_outliers, bins=30, color='green', alpha=0.7, label='Domain 2 (Standardized + 10 Outliers)')
ax[1, 0].set_title("Standardized Data with 10 Outliers")
ax[1, 0].legend()

# Adjust layout
plt.tight_layout()

# Show the plot
plt.show()
・Gaussian

・unifrom and exponential

When the distribution is Gaussian and there are outliers at around 2%, standardization clearly appears to function better as normalization.
When it comes to normal distribution and exponential distribution, each has its own characteristics.
As such, the optimal normalization differs depending on the distribution of the data for the problem you are working on, so you should apply the appropriate method for your problem, keeping in mind that "model performance is fundamentally improved by using universal inputs during training and inference."
5. Summary
This time, I compared standardization and normalization.
In conclusion, it is important to use them appropriately depending on the problem, but I think it will be easier to design them if you consider their respective characteristics and behaviors, and what inputs will improve the model's performance.
That's all for today. Thank you for reading.
Discussion