【Wave Analytics Method】What is CWT/Scarogram
1. CWT/Scarogram
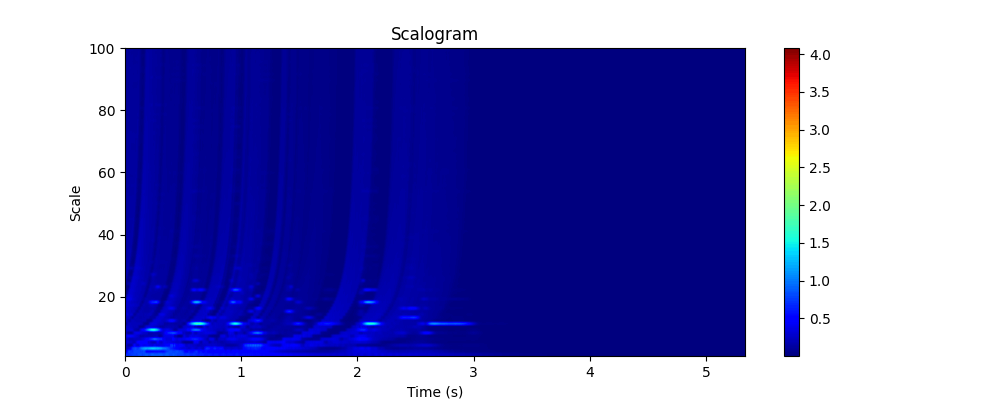
Scarogram is a 2-dimentional image created by applying CWT(Continous Wavelet Transform) to 1-dimentional signal.
・Scarogram
2. Wavelet Transform
2.1 Wavelet
What is wavelet? It is a function that take time as an argument. Generally, be represented as
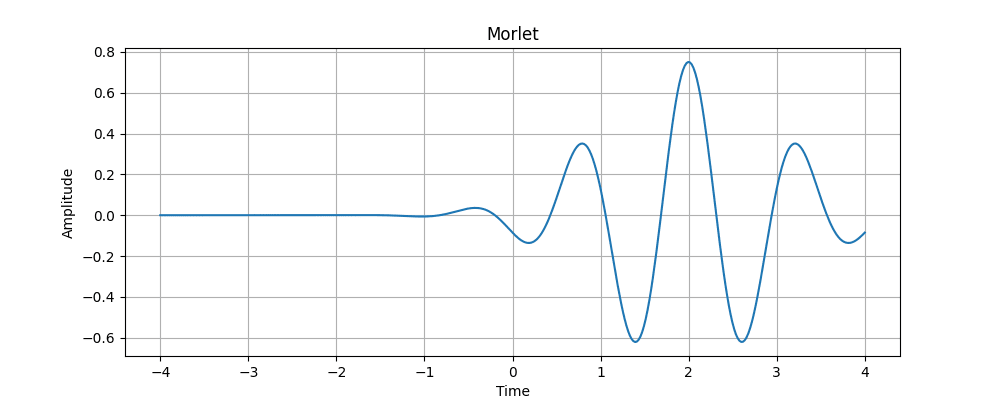
Wavelet has a variety of types. Morlet is a famous one.
・Wavelet

To be a proper wavelet, function has to satisfy 2 main constraints.
- Zero mean:
\int^{+ \infty}_{- \infty} \Psi (t)dt = 0 - Finite energy:
\int^{+ \infty}_{- \infty} |\Psi(t)|^2 dt < \infty
Example, sin function not satisfy condition 2, because it has infinite energy.
You can think of those constraints as indicating a converging fanction with zero mean.
2.2 Adjust Wavelet
In below, choice morlet as wavelet.
Morlet
・Morlet

When we adjust
・
b = 2
・
a = 0.5

Thorefore, we can create various morlet by control
b = -2, a = 0.25

2.3 Wavelet Transform
Wavelet Transform create image that one axis represent frequency, and one another represent time from signal.
・Wavelet Transform
The right arrow represent Wavelet Transform, what is going on there? Let's check in below.
・Calculation 1
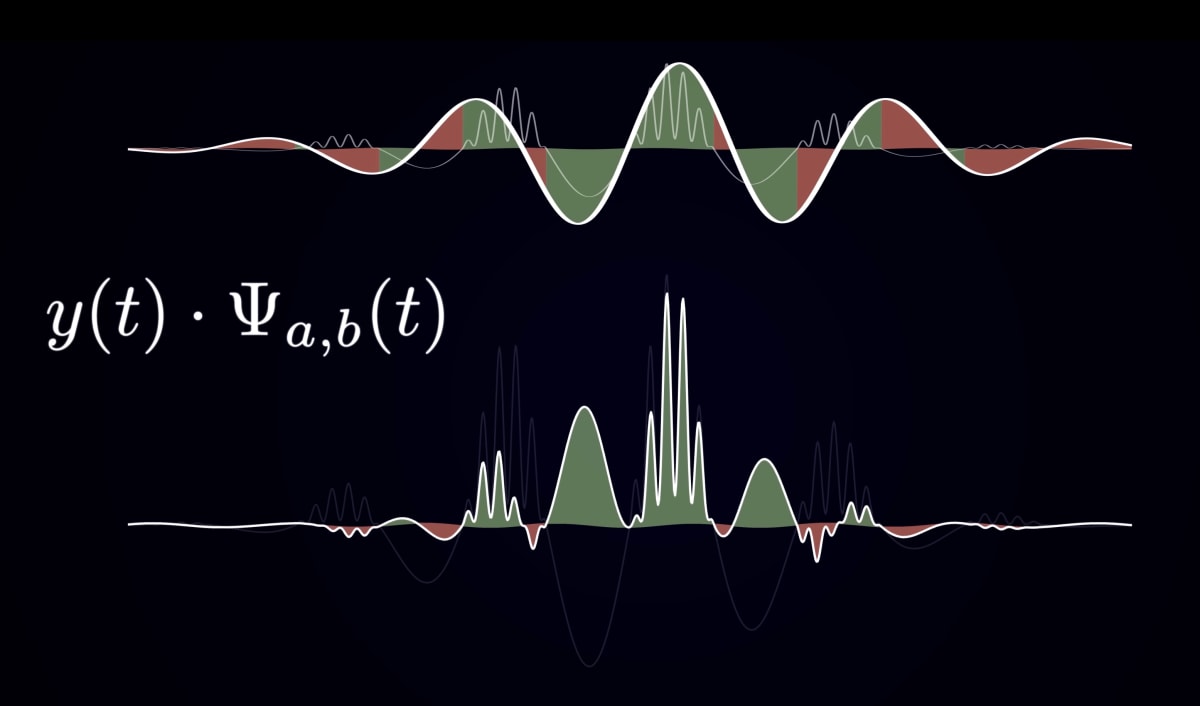
This calculation creates a new wave(ex. above jagged wave) that shows how similar each function is. At every point, if the values of each function(
Created wave represent similarity of two waves y(t) and Ψ.
・Calculation 2
This formula calculates the total area of overlap between the Morlet and the original formula, assuming that if the overlapped parts have the same sign, it is a plus, and if they have different signs, it is a minus.
In other words, it shows the degree of overlap between morlet and the original signal.
2.4 Imaginary part
Wavelet has a imaginary part. And as same with real part,
It provide more generality to Wave Transform(WT).
2.5 Result of Transform
The
Parameter b
If you change parameter b, T shows similarity between two functions in the according time. It makes a one-dimensional wave that shows where there is a similar wave to wavelte with frequency of
Parameter a
When you repeat the same process in changing parameter a, you can obtain various waves that show where each wave has the same frequency corresponding to parameter a.
Power
In this time, we got
After obtaining
Power
Scarogram
When you get this far, all you have to do is color map the frequency components of each power and arrange them in time. And you'll get Scarogram.
It's same operation when you create spectrogram.
It shows at what time in the original waveform a waveform with the same frequency component (varied by
summary
This time, I explained about CWT/Scarogram.
Thank you for reading.
Reference
(1) Wavelets: a mathematical microscope, Artem Kirsanov
Discussion