【Data Method】HSV color space explained
1. About HSV color space
The HSV color space (Hue, Saturation, Value) is a way to represent colors in a more human-perceptive way compared to the traditional RGB (Red, Green, Blue) model. It is widely used in graphics software and image processing because it corresponds more closely to how humans perceive colors.
The simple explanation images are here(with opencv):
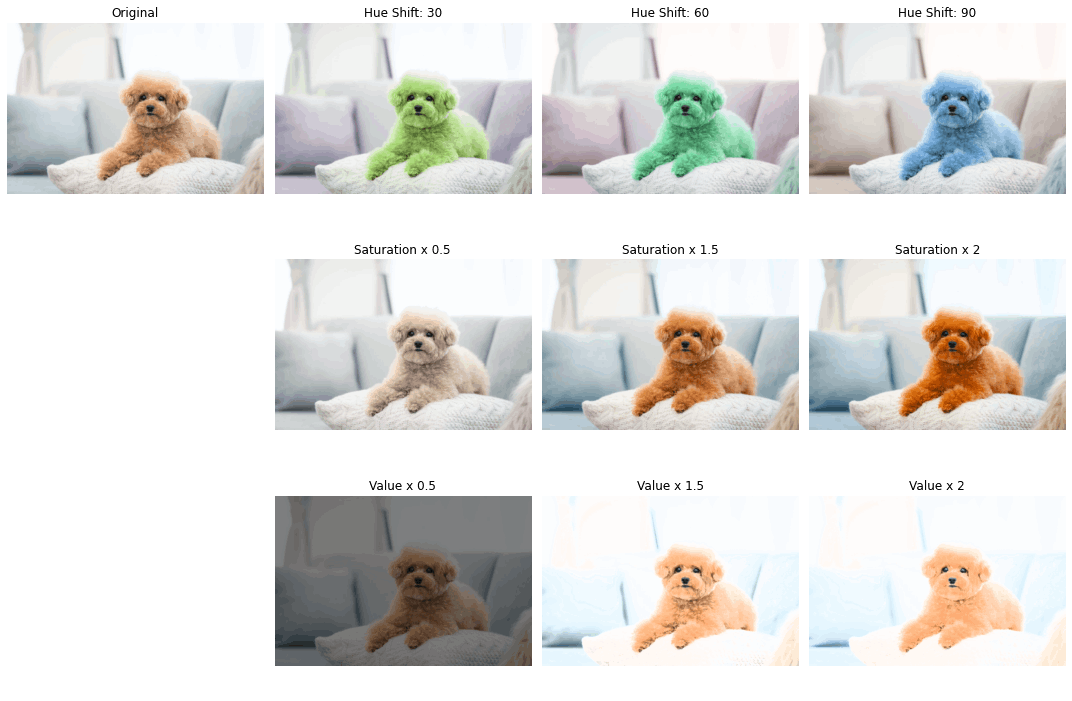
2. Hue (H)
Hue represents the type of color, or the dominant wavelength. It is measured in degrees on a color wheel, ranging from 0 to 360.
Examples of hue values:
・ 0° = Red
・ 60° = Yellow
・ 120° = Green
・ 180° = Cyan
・ 240° = Blue
・ 300° = Magenta
・ 360°(0°) = Red
※opencv uses 0~179 instead of 0~360
3. Saturation (S)
Saturation measures the intensity or purity of the color. It ranges from 0 to 100%, where 0% means the color is a shade of gray (desaturated), and 100% means it’s a pure, vivid color.
Lower saturation values create a "washed out" or "pastel" effect, while higher saturation makes colors more vibrant.
4. Value (V)
Value (also called brightness or lightness) represents the brightness of the color. It ranges from 0% to 100%, where 0% is completely black and 100% is the full brightness of the hue.
As the value decreases, the color darkens, and at 0%, it becomes black regardless of the hue and saturation.
5. HSV exchange code
HSV exchange code is here:
# hsv from rgb
import cv2
import matplotlib.pyplot as plt

# Load image in RGB format
image = cv2.imread('/Users/yuto/Downloads/dog_origin.png')
image_rgb = cv2.cvtColor(image, cv2.COLOR_BGR2RGB)  # Convert BGR (OpenCV default) to RGB

# Convert RGB to HSV
image_hsv = cv2.cvtColor(image_rgb, cv2.COLOR_RGB2HSV)

# Plot the original RGB image and its HSV representation
fig, ax = plt.subplots(1, 2, figsize=(12, 6))

# Show the original RGB image
ax[0].imshow(image_rgb)
ax[0].set_title("Original RGB Image")
ax[0].axis('off')

# Show the HSV image (in OpenCV's HSV format)
ax[1].imshow(image_hsv)
ax[1].set_title("Image in HSV Color Space")
ax[1].axis('off')

plt.show()


# for torch.tensor input
def F_rgb2hsv(rgb: torch.Tensor) -> torch.Tensor:
    cmax, cmax_idx = torch.max(rgb, dim=1, keepdim=True)
    cmin = torch.min(rgb, dim=1, keepdim=True)[0]
    delta = cmax - cmin
    hsv_h = torch.empty_like(rgb[:, 0:1, :, :])
    cmax_idx[delta == 0] = 3
    hsv_h[cmax_idx == 0] = (((rgb[:, 1:2] - rgb[:, 2:3]) / delta) % 6)[cmax_idx == 0]
    hsv_h[cmax_idx == 1] = (((rgb[:, 2:3] - rgb[:, 0:1]) / delta) + 2)[cmax_idx == 1]
    hsv_h[cmax_idx == 2] = (((rgb[:, 0:1] - rgb[:, 1:2]) / delta) + 4)[cmax_idx == 2]
    hsv_h[cmax_idx == 3] = 0.
    hsv_h /= 6.
    hsv_s = torch.where(cmax == 0, torch.tensor(0.).type_as(rgb), delta / cmax)
    hsv_v = cmax
    return torch.cat([hsv_h, hsv_s, hsv_v], dim=1)
6. Summary
I explained HSV color space in this time.
HSV format is widely used in graphics software and image processing because it corresponds more closely to how humans perceive colors.
Discussion