【Python】実践データ分析100本ノック 第9章
この記事は、現場で即戦力として活躍することを目指して作られた現場のデータ分析の実践書である「Python 実践データ分析 100本ノック(秀和システム社)」で学んだことをまとめています。
ただし、本を参考にして、自分なりに構成などを変更している部分が多々あるため、ご注意ください。細かい解説などは是非本をお手に取って読まれてください。

【リンク紹介】
・【一覧】Python実践データ分析100本ノック
・これまで書いたシリーズ記事一覧
目的
カメラから取得した映像を用いて画像認識を行い、必要な情報を取得するための流れを学ぶ
※人の顔ががっつり映っている画像なので、出力結果は各自でご確認ください。
Import
# 必要に応じてインストールする
!pip install colorama > /dev/null
%%time

import cv2                                              # 画像処理・画像解析を行う
import numpy as np
import pandas as pd
from google.colab.patches import cv2_imshow             # google colabで画像を表示させる
from colorama import Fore, Style, init                  # Pythonの文字色指定ライブラリ
from IPython.display import display_html, clear_output
from gc import collect                                  # ガーベッジコレクション
import matplotlib.pyplot as plt
from matplotlib.animation import FuncAnimation          # アニメーションの作成
from IPython.display import HTML                        # HTMLを表示させる
import dlib                                             # 目・鼻・口・輪郭を特徴点で表現する
import math

# GoogoleドライブをGoogle Colabにマウント(連携)させるライブラリ
from google.colab import drive
drive.mount('/content/drive')
%%time

# テキスト出力の設定
def PrintColor(text:str, color = Fore.GREEN, style = Style.BRIGHT):
    print(style + color + text + Style.RESET_ALL);

# displayの表示設定
pd.set_option('display.max_columns', 50);
pd.set_option('display.max_rows', 50);

print()
collect()
Knock81:画像データを読み込む
必要なデータを読み込んでいきます。
なお、テキストのデータダウンロードは以下に格納されています。
%%time

# 画像ファイルを読み込む
img = cv2.imread('/content/drive/MyDrive/Colab Notebooks/Chapter09/img/img01.jpg')

# 高さと幅の情報を取得
height, width = img.shape[:2]
# height, width = img.shape[0], img.shape[1]でも可

print()
collect()
%%time

# 高さと幅の情報を出力する
print('画像幅: ' + str(width))
print('画像高さ: ' + str(height))

# 画像を出力する
cv2_imshow(img)
Knock82:映像データを読み込む
まずは映像データ(以下動画とする)を読み込んで、各情報を取得します。
%%time

"""情報取得"""
cap    = cv2.VideoCapture('/content/drive/MyDrive/Colab Notebooks/Chapter09/mov/mov01.avi')     # 動画の読み込み
width  = cap.get(cv2.CAP_PROP_FRAME_WIDTH)     # 動画の解像度(横)の値を確認する
height = cap.get(cv2.CAP_PROP_FRAME_HEIGHT)    # 動画の解像度(縦)の値を確認する
count  = cap.get(cv2.CAP_PROP_FRAME_COUNT)     # 動画の層フレーム数を確認する
fps    = cap.get(cv2.CAP_PROP_FPS)             # 動画のFPSを取得する

print()
collect()
%%time

print('画像幅: ' + str(width))
print('画像高さ: ' + str(height))
print('総フレーム数: ' + str(count))
print('FPS: ' + str(fps))

print()
collect()
%%time

"""動画のフレーム画像化"""
num        = 0
num_frame  = 100
list_frame = []

while(cap.isOpened()):
    # フレーム毎に切り出す(capに画像情報が格納されていれば、retにTrueを格納)
    # 参考資料:https://www.shangtian.tokyo/entry/2020/04/15/220123
    ret, frame = cap.read()

    # フレーム画像を書き出す
    if ret:
        # 色の順番を変更する(※注釈1)
        frame_rgb = cv2.cvtColor(frame, cv2.COLOR_BGR2RGB)
        # 色の順番を変更したうえで、切り出したフレームを格納する
        list_frame.append(frame_rgb)
        # キーボードが押されて、かつ そのキーが「q」であること:https://www.sololearn.com/en/Discuss/1879301/what-it-means-0xff-ordq
        if cv2.waitKey(1) & 0xFF == ord('q'):
            break
        if num > num_frame:
            break
    num = num + 1

print('動画のフレーム化処理を完了しました')
cap.release()

print()
collect()
※注釈1
OpenCVライブラリで扱う色の順番はBRG(青赤緑)であるのに対して、
Matplotlibで扱う色の順番はRGB(赤緑青)です。
そのため、色の順番を変更するためにcv2.cvtColor()を用いて変更しています。
参考資料:
%%time

"""フレーム画像をアニメーションに変換"""
plt.figure()
# list_frame[0]を画像として表示する
patch = plt.imshow(list_frame[0])
# 座標の表示をoffにする
plt.axis('off')

def animate(i):
    patch.set_data(list_frame[i])

anim = FuncAnimation(plt.gcf(),                  # 現在のfigureオブジェクトを取得。つまりlist_frame[0]のこと
                     animate,                    # グラフ更新関数。引数にframeで指定したものが代入される
                     frames = len(list_frame),   # フレームを設定
                     interval = 1000 / 30.0
                    )

plt.close()

"""アニメーションを表示"""
HTML(anim.to_jshtml())
参考資料:
Knock83:動画を画像に分割し、保存する
映像データを画像データに分割して保存します。
%%time

cap   = cv2.VideoCapture('/content/drive/MyDrive/Colab Notebooks/Chapter09/img/img01.jpg')
num   = 0
count = cap.get(cv2.CAP_PROP_FRAME_COUNT)

while(cap.isOpened()):
    # フレーム毎に切り出す(capに画像情報が格納されていれば、retにTrueを格納)
    ret, frame = cap.read()

    # 画像情報がcapに格納されていれば、それらを画像に分割して格納する
    if ret:
        filepath = 'snapshot/shapshot_' + str(num) + '.jpg'
        cv2.imwrite(filepath, frame)

    num = num + 1

    if num >= count:
        break

cap.release()
cv2.destroyAllWindows()
Knock84:画像内のどこに人がいるのかを検出する
人の認識を行うために、「HOG(Histogram of Oriented Gradients)特徴量」を用います。
参考資料:
%%time

"""準備"""
# インスタンス化
hog = cv2.HOGDescriptor()
# cv2.HOGDescriptor_getDefaultPeopleDetector()でヒトのモデルをセットする
hog.setSVMDetector(cv2.HOGDescriptor_getDefaultPeopleDetector())
hogParams = {'winStride'      : (8, 8),
             'padding'        : (32, 32),
             'scale'          : 1.05,
             'hitThreshold'   : 0,
             'groupThreshold' : 5
            }

print()
collect()
%%time

"""検出"""
img      = cv2.imread('/content/drive/MyDrive/Colab Notebooks/Chapter09/img/img01.jpg')
gray     = cv2.cvtColor(img, cv2.COLOR_BGR2GRAY)
# 検出されたヒトの位置情報を格納する
human, r = hog.detectMultiScale(gray, **hogParams)

if (len(human) > 0):
    for (x, y, w, h) in human:
        cv2.rectangle(img,
                      (x, y),
                      (x + w, y + h),
                      (255, 255, 255),
                      3
                     )

cv2_imshow(img)
cv2.imwrite('temp.jpg', img)
Knock85:画像内の人の顔を検出する
CascadeClassifierを用いて顔検出を行います。
%%time

"""準備"""
# ファイルの保存先に合わせてパスを格納してください。
# 正面顔を認識するモデルを格納する
cascade_file = '/content/drive/MyDrive/Colab Notebooks/Chapter09/haarcascade_frontalface_alt.xml'
# インスタンス化し、cascade_file(正面顔認識モデル)を引数として渡す
cascade      = cv2.CascadeClassifier(cascade_file)

"""検出"""
img       = cv2.imread('/content/drive/MyDrive/Colab Notebooks/Chapter09/img/img02.jpg')
gray      = cv2.cvtColor(img, cv2.COLOR_BGR2GRAY)
# 検出されたヒトの顔の位置情報を格納する
face_list = cascade.detectMultiScale(gray, minSize = (50, 50))

print()
collect()
%%time

"""検出した顔に印をつける"""
for (x, y, w, h) in face_list:
    color = (0, 0, 225)
    pen_w = 3
    cv2.rectangle(img,
                  (x, y),
                  (x + w, y + h),
                  color,
                  thickness = pen_w
                 )

cv2_imshow(img)
cv2.imwrite('temp.jpg', img)
Knock86:画像内の人がどこに顔を向けているのかを検出する
%%time

"""準備"""
# 68点の顔器官のモデルを格納する
predictor = dlib.shape_predictor('/content/drive/MyDrive/Colab Notebooks/Chapter09/shape_predictor_68_face_landmarks.dat')
# 正面顔のモデルを格納する
detector  = dlib.get_frontal_face_detector()

"""検出"""
img  = cv2.imread('/content/drive/MyDrive/Colab Notebooks/Chapter09/img/img02.jpg')
# インスタンス化
dets = detector(img, 1)

for k, d in enumerate(dets):
    # インスタンス化
    shape = predictor(img, d)

    # 顔領域の表示
    color_f     = (0, 0, 225)
    color_l_out = (255, 0, 0)
    color_l_in  = (0, 0, 255)
    line_w      = 3
    circle_r    = 3
    fontType    = cv2.FONT_HERSHEY_SIMPLEX
    fontSize    = 1
    cv2.rectangle(img,
                  (d.left(), d.top()),
                  (d.right(), d.bottom()),
                  color_f,
                  line_w
                 )
    cv2.putText(img,
                str(k),
                (d.left(), d.top()),
                fontType,
                fontSize,
                color_f,
                line_w
                )

    # 重心を導出する箱を用意
    num_of_points_out = 17
    num_of_points_in  = shape.num_parts - num_of_points_out
    gx_out = 0
    gy_out = 0
    gx_in  = 0
    gy_in  = 0

    for shape_point_count in range(shape.num_parts):
        shape_point = shape.part(shape_point_count)
        # print('顔器官No.{} 座標位置: ({}, {})'.format(shape_point_count, shape_point.x, shape_point.y))

        # 器官ごとに描画
        if shape_point_count < num_of_points_out:
            cv2.circle(img,
                       (shape_point.x, shape_point.y),
                       circle_r,
                       color_l_out,
                       line_w
                       )
            gx_out = gx_out + shape_point.x / num_of_points_out
            gy_out = gy_out + shape_point.y / num_of_points_out
        else:
            cv2.circle(img,
                       (shape_point.x, shape_point.y),
                       circle_r,
                       color_l_out,
                       line_w
                      )
            gx_in = gx_in + shape_point.x / num_of_points_in
            gy_in = gy_in + shape_point.y / num_of_points_in

    # 重心位置を描画
    cv2.circle(img,
               (int(gx_out), int(gy_out)),
               circle_r,
               (0, 0, 255),
               line_w
               )
    cv2.circle(img,
               (int(gx_in), int(gy_in)),
               circle_r,
               (0, 0, 0),
               line_w
               )

    # 顔の方位を計測
    theta  = math.asin(2 * (gx_in - gx_out) / (d.right() - d.left()))
    radian = theta * 180 / math.pi
    print('顔方位:{} (角度:{}度)'.format(theta, radian))

    # 顔方位を表示
    if radian < 0:
        textPrefix = 'left'
    else:
        textPrefix = 'right'

    textShow = textPrefix + str(round(abs(radian), 1)) + 'deg.'
    cv2.putText(img,
                textShow,
                (d.left(), d.top()),
                fontType,
                fontSize,
                color_f,
                line_w
                )

cv2_imshow(img)
cv2.imwrite('temp.jpg', img)
Knock87:検出した情報を統合し、タイムラプスをつくる
タイムラプスとは、数フレームから1フレームのみを取り出した「早送り」動画のことです。
%%time

print('タイムラプス生成を開始します') # 私の環境では処理完了までに2分かかりました。

"""映像取得"""
cap    = cv2.VideoCapture('/content/drive/MyDrive/Colab Notebooks/Chapter09/mov/mov01.avi')
width  = int(cap.get(cv2.CAP_PROP_FRAME_WIDTH))
height = int(cap.get(cv2.CAP_PROP_FRAME_HEIGHT))

"""hog宣言"""
hog = cv2.HOGDescriptor()
hog.setSVMDetector(cv2.HOGDescriptor_getDefaultPeopleDetector())
hogParams = {'winStride'      : ( 8,  8),
             'padding'        : (32, 32),
             'scale'          : 1.05,
             'hitThreshold'   : 0,
             'groupThreshold' : 5
            }

"""タイムプラス作成"""
movie_name = 'timelapse.avi'
fourcc     = cv2.VideoWriter_fourcc('X', 'V', 'I', 'D')
video      = cv2.VideoWriter(movie_name,
                             fourcc,
                             30,
                             (width, height)
                             )

num = 0
while(cap.isOpened()):
    ret, frame = cap.read()
    if ret:
        if (num % 10 == 0):
            gray     = cv2.cvtColor(frame, cv2.COLOR_BGR2GRAY)
            human, r = hog.detectMultiScale(gray, **hogParams)

            if (len(human) > 0):
                for (x, y, w, h) in human:
                    cv2.rectangle(frame,
                                  (x, y),
                                  (x + w, y + h),
                                  (255, 255, 255),
                                  3
                                 )

            video.write(frame)

    else:
        break

    num = num + 1

video.release()
cap.release()
cv2.destroyAllWindows()
print('タイムラプス生成を修了しました。')
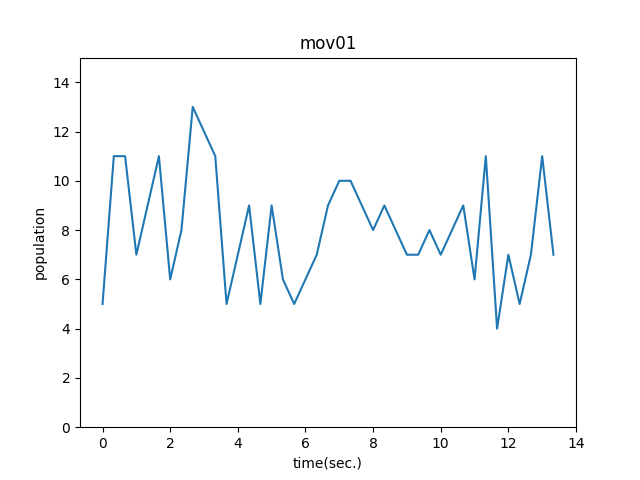
Knock88:全体像をグラフにして可視化する
映像から人を検出したうえで、その時系列変化を可視化します。
%%time

print('分析を開始します') # 私の環境では処理完了までに2分かかりました。

"""映像取得"""
cap = cv2.VideoCapture('/content/drive/MyDrive/Colab Notebooks/Chapter09/mov/mov01.avi')
fps = cap.get(cv2.CAP_PROP_FPS)

"""hog宣言"""
hog = cv2.HOGDescriptor()
hog.setSVMDetector(cv2.HOGDescriptor_getDefaultPeopleDetector())
hogParams = {'winStride'      : (8, 8),
             'padding'        : (32, 32),
             'scale'          : 1.05,
             'hitThreshold'   : 0,
             'groupThreshold' : 5
            }

num     = 0
list_df = pd.DataFrame(columns = ['time', 'people'])

while(cap.isOpened()):
    ret, frame = cap.read()

    if ret:
        if (num % 10 == 0):
            gray     = cv2.cvtColor(frame, cv2.COLOR_BGR2GRAY)
            human, r = hog.detectMultiScale(gray, **hogParams)

            if (len(human) > 0):
                for (x, y, w, h) in human:
                    cv2.rectangle(frame,
                                  (x, y),
                                  (x + w, y + h),
                                  (255, 255, 255),
                                  3
                                 )
            tmp_se  = pd.Series([num / fps, len(human)], index = list_df.columns)
            list_df = list_df.append(tmp_se, ignore_index = True)

            if cv2.waitKey(1) & 0xFF == ord('q'):
                break

    else:
        break

    num = num + 1

cap.release()
cv2.destroyAllWindows()
print('分析を修了しました')
データフレームの可視化結果を描画します。
%%time

plt.plot(list_df['time'], list_df['people'])

plt.title('mov01')
plt.xlabel('time(sec.)')
plt.ylabel('population')
plt.ylim(0, 15)

# グラフを保存
plt.savefig('mov01.png')

plt.show()
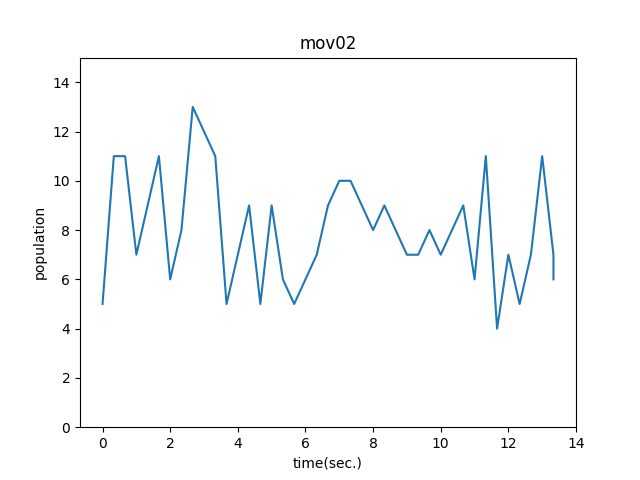
Knock89:人通りの変化をグラフで確認する
異なる動画データを用いて同じ分析を行います。
%%time

print('分析を開始します') # 私の環境では処理完了までに2分かかりました。

"""映像取得"""
cap = cv2.VideoCapture('/content/drive/MyDrive/Colab Notebooks/Chapter09/mov/mov02.avi')
fps = cap.get(cv2.CAP_PROP_FPS)

"""hog宣言"""
hog = cv2.HOGDescriptor()
hog.setSVMDetector(cv2.HOGDescriptor_getDefaultPeopleDetector())
hogParams = {'winStride'      : (8, 8),
             'padding'        : (32, 32),
             'scale'          : 1.05,
             'hitThreshold'   : 0,
             'groupThreshold' : 5
            }

num      = 0
list_df2 = pd.DataFrame(columns = ['time', 'people'])

while(cap.isOpened()):
    ret, frame = cap.read()

    if ret:
        if (num % 10 == 0):
            gray     = cv2.cvtColor(frame, cv2.COLOR_BGR2GRAY)
            human, r = hog.detectMultiScale(gray, **hogParams)

            if (len(human) > 0):
                for (x, y, w, h) in human:
                    cv2.rectangle(frame,
                                  (x, y),
                                  (x + w, y + h),
                                  (255, 255, 255),
                                  3
                                 )
            tmp_se   = pd.Series([num / fps, len(human)], index = list_df.columns)
            list_df2 = list_df.append(tmp_se, ignore_index = True)

            if cv2.waitKey(1) & 0xFF == ord('q'):
                break

    else:
        break

    num = num + 1

cap.release()
cv2.destroyAllWindows()
print('分析を修了しました')
データフレームの可視化結果を描画します。
%%time

plt.plot(list_df2['time'], list_df2['people'])

plt.title('mov02')
plt.xlabel('time(sec.)')
plt.ylabel('population')
plt.ylim(0, 15)

# グラフを保存
plt.savefig('mov02.png')

plt.show()
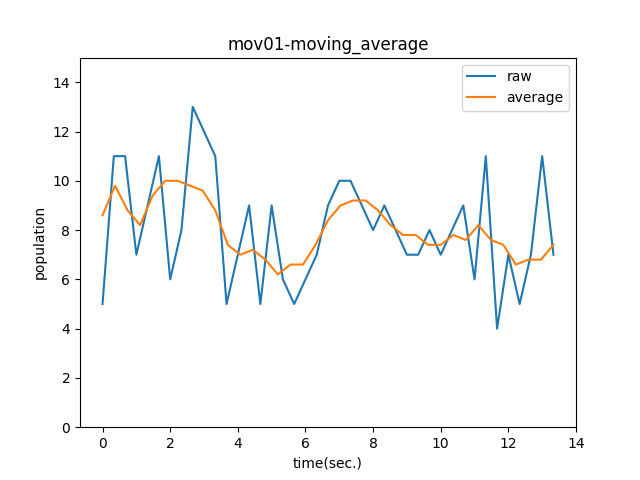
Knock90:移動平均を計算することでノイズの影響を除去する
%%time

# 移動平均
def moving_average(x, y):
    y_conv = np.convolve(y, np.ones(5) / float(5), mode = 'valid')
    x_dat  = np.linspace(np.min(x), np.max(x), np.size(y_conv))
    return x_dat, y_conv
# それぞれの移動平均を描画する
plt.plot(list_df['time'], list_df['people'], label = 'raw')
ma_x, ma_y = moving_average(list_df['time'], list_df['people'])
plt.plot(ma_x, ma_y, label = 'average')

plt.title('mov01-moving_average')
plt.xlabel('time(sec.)')
plt.ylabel('population')
plt.ylim(0, 15)
plt.legend()

# グラフを保存
plt.savefig('mov01-moving_average.png')

plt.show()
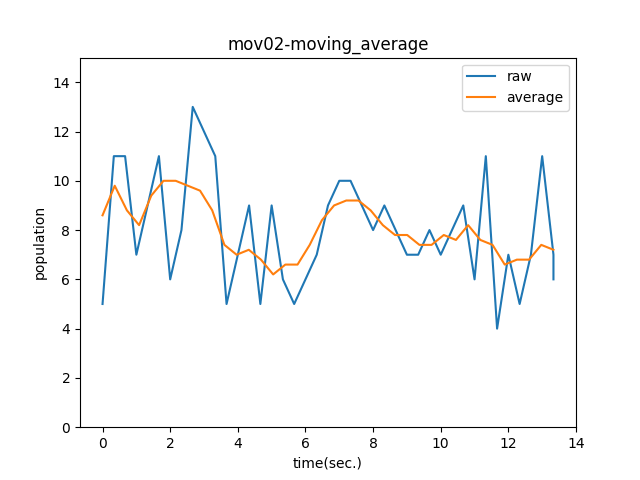
plt.plot(list_df2['time'], list_df2['people'], label = 'raw')
ma_x2, ma_y2 = moving_average(list_df2['time'], list_df2['people'])
plt.plot(ma_x2, ma_y2, label = 'average')

plt.title('mov02-moving_average')
plt.xlabel('time(sec.)')
plt.ylabel('population')
plt.ylim(0, 15)
plt.legend()

# グラフを保存
plt.savefig('mov02-moving_average.png')

plt.show()
最後に、2つの移動平均を同時に描画します。
plt.plot(ma_x,  ma_y,  label = '1st')
plt.plot(ma_x2, ma_y2, label = '2nd')

plt.xlabel('time(sec.)')
plt.ylabel('population')
plt.ylim(0, 15)
plt.legend()

# グラフを保存
plt.savefig('2-moving_average.png')

plt.show()

ご協力のほどよろしくお願いします。
Discussion