OpenLayers の少し便利な使い方
ブラウザで地図を表示するJavaScriptライブラリOpenLayers v6の個人的Tips集です。
OpenLayersはやろうと思えば大概のことはできるよくできたライブラリなのですが、その自在性故に設定がちょっとばかし難しく、いつも「あれどうやるんだっけな」となるため利用例のサンプルをまとめます。
クリックでの座標の取得法、レイヤーの重なり順の変え方、投影法のポイント、GeoJSONの表示の仕方などを扱ってます。
クリックイベントと座標
※forEachLayerAtPixelメソッドがv7以降では死にました。
const container = document.getElementById('popup');
const content = document.getElementById('popup-content');
const closer = document.getElementById('popup-closer');
const overlay = new ol.Overlay({
  element: container, // ここで渡した時点でbody内からcontainer要素が一度消える
});
const closeOverlay = function () {
  overlay.setPosition(undefined);
  closer.blur();
  return false;
};
closer.onclick = closeOverlay;

const polygon = {
  "type": "Feature",
  "geometry": {
    "type": "Polygon",
    "coordinates": [
      [
	[0, 0], [90, 0], [90, 60], [0, 60], [0, 0]
      ]
    ],
  },
};
const vectorSource = new ol.source.Vector();
vectorSource.addFeature(new ol.format.GeoJSON({
  dataProjection: "EPSG:4326",
  featureProjection: "EPSG:3857",
}).readFeature(polygon));

const map = new ol.Map({
  target: 'map',
  overlays: [overlay],
  layers: [
    new ol.layer.Tile({
      source: new ol.source.XYZ({
	url: "https://cyberjapandata.gsi.go.jp/xyz/seamlessphoto/{z}/{x}/{y}.jpg",
	attributions: "国土地理院(https://maps.gsi.go.jp/development/ichiran.html)",
	tilePixelRatio: window && window.devicePixelRatio ? window.devicePixelRatio : 1
	//  TileLayerをVectorLayerと一緒に表示してかつmap.forEachLayerAtPixelで値を拾うときは
	// tilePixelRatioを適切に設定していないとうまく動かないケースがある
      }),
      properties: {
	id: "Tile"
      },
    }),
    new ol.layer.Vector({
      source: vectorSource,
      style: new ol.style.Style({
	fill: new ol.style.Fill({
	  color: "rgba(0, 255, 0, 0.5)",
	}),
	stroke: new ol.style.Stroke({
	  color: "rgba(0, 255, 0, 1)",
	  width: 1,
	}),
      }),
      extent: ol.proj.transformExtent([0,0,90,60], "EPSG:4326", "EPSG:3857"),
      id: "Vector"
    }),
    new ol.layer.Graticule({
      strokeStyle: new ol.style.Stroke({
	color: "rgba(255,0,0,0.9)",
	width: 3,
	lineDash: [0.5, 4],
      }),
      showLabels: true,
      id: "Graticule"
    })
  ],
  view: new ol.View({
    center: ol.proj.fromLonLat([40, 40]),
    zoom: 1
  }),
});

map.on('singleclick', function (evt) {
  let layers= "";
  map.forEachLayerAtPixel(map.getEventPixel(evt.originalEvent), (layer) => {
    const id = layer.get('id');
    layers += id + ",";

    return false; // trueを返すと初めにヒットしたレイヤーで処理が止まる
  }, {
    layerFilter: (layer) => {
      const extent = layer.getExtent();
      // layerにextentが設定されていた場合、クリックがextent内か判定
      return !Array.isArray(extent) ||
	ol.extent.containsCoordinate(extent, evt.coordinate);
    }
  });
  if(layers.length > 1)
    layers = layers.slice(0, layers.length - 1);

  content.innerHTML =  `
    <dl>
      <dt>
	pixel
      </dt>
      <dd>
	${JSON.stringify(map.getEventPixel(evt.originalEvent))}
      </dd>
      <dt>
	lon/lat
      </dt>
      <dd>
	${JSON.stringify(ol.proj.toLonLat(evt.coordinate))}
      </dd>
      <dt>
	EPSG:3857での座標
      </dt>
      <dd>
	${JSON.stringify(evt.coordinate)}
      </dd>
      <dt>
	クリックしたレイヤー(上から順)
      </dt>
      <dd>
	${layers}
      </dd>
    </dl>
  `;
  overlay.setPosition(evt.coordinate);
});
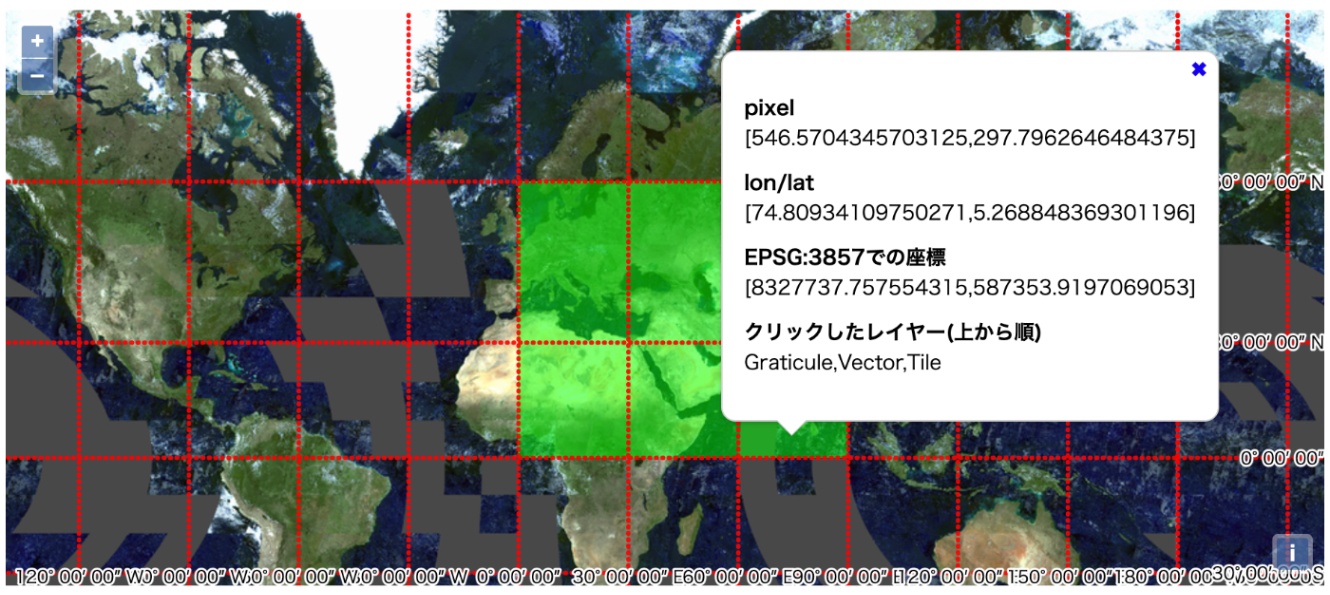
ベースマップとしてのseamlessphoto、ポリゴン(左下[0, 0]、右上[90, 60])、OpenLayersに用意されている緯度経度線レイヤーを表示しています。
そしてクリックした地点の座標と、その地点にあるレイヤーの名前を表示します。
ポイントは
- TileLayerにtilePixelRatioを設定しています。おまじない。これをしないとforEachLayerAtPixelで値を拾うときはうまく動かないケースがある。
-
map.forEachLayerAtPixelの第3引数にlayerFilterを設定すると対象とするレイヤーをフィルタリングできます。この例ではextentがレイヤーに設定されていた場合、クリック地点がextetnの範囲外の場合は処理を飛ばします。 -
evt.originalEventはmapの投影系での座標 -
ol.proj.toLonLat(evt.coordinate,)は地理座標系での座標(緯度経度) -
map.getEventPixel(evt.originalEvent))はmap上のpixel座標(左上が原点)
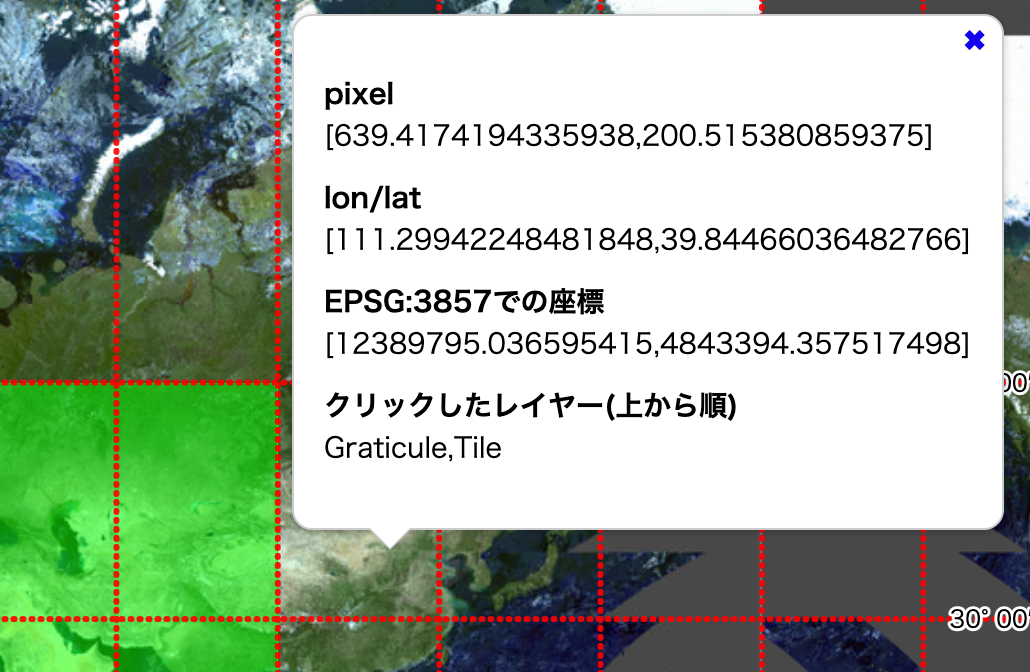
layerFilterによりフィルタリングされている例。クリック地点がポリゴンのレイヤーのextent外なため、idの表示に"Vector"が含まれない。
なおGeoJSONをVectorLayerとして表示する方法ですが、
GeoJSONが別ファイルに定義されている場合は公式のサンプルにあるように
 new VectorLayer({
  source: new VectorSource({
    url: 'data/geojson/countries.geojson',
    format: new GeoJSON(),
  })
});
sourceにurlを指定するのが楽ですが、
GeoJSONをJS内で記述するようなケースでは、
const vectorSource = new ol.source.Vector();
vectorSource.addFeature(new ol.format.GeoJSON({
  dataProjection: "EPSG:4326",
  featureProjection: "EPSG:3857",
}).readFeature(polygon));

new ol.layer.Vector({
  source: vectorSource
})
という書き方が最も楽かなと個人的には思ってます。
レイヤーの重なり順
const vectorSource1 = new ol.source.Vector();
vectorSource1.addFeature(new ol.format.GeoJSON({
  dataProjection: "EPSG:4326",
  featureProjection: "EPSG:3857",
}).readFeature({
  "type": "Feature",
  "geometry": {
    "type": "Polygon",
    "coordinates": [
      [
	[0, 5], [100, 5], [100, 65], [0, 65], [0, 5]
      ]
    ],
  },
}));
const vectorSource2 = new ol.source.Vector();
vectorSource2.addFeature(new ol.format.GeoJSON({
  dataProjection: "EPSG:4326",
  featureProjection: "EPSG:3857",
}).readFeature({
  "type": "Feature",
  "geometry": {
    "type": "Polygon",
    "coordinates": [
      [
	[40, -10], [80, -10], [80, 20], [40, 20], [40, -10]
      ]
    ],
  },
}));
const vectorSource3 = new ol.source.Vector();
vectorSource3.addFeature(new ol.format.GeoJSON({
  dataProjection: "EPSG:4326",
  featureProjection: "EPSG:3857",
}).readFeature({
  "type": "Feature",
  "geometry": {
    "type": "Polygon",
    "coordinates": [
      [
	[50, 0], [70, 0], [70, 10], [50, 10], [50, 0]
      ]
    ],
  },
}));
const vectorSource4 = new ol.source.Vector();
vectorSource4.addFeature(new ol.format.GeoJSON({
  dataProjection: "EPSG:4326",
  featureProjection: "EPSG:3857",
}).readFeature({
  "type": "Feature",
  "geometry": {
    "type": "Polygon",
    "coordinates": [
      [
	[45, -5], [85, -5], [85, 25], [45, 25], [45, -5]
      ]
    ],
  },
}));

const layer1 = new ol.layer.Tile({
  source: new ol.source.OSM(),
  properties: {
    id: "layer1"
  },
  zIndex: 0
});
const layer2 = new ol.layer.Vector({
  source: vectorSource1,
  style: new ol.style.Style({
    fill: new ol.style.Fill({
      color: "rgba(128, 128, 128, 0.5)",
    }),
    stroke: new ol.style.Stroke({
      color: "rgba(128, 128, 128, 1)",
      width: 1,
    }),
  }),
  properties: {
    id: "layer2"
  },
  zIndex: 1
});
const layer3 = new ol.layer.Tile({
  source: new ol.source.XYZ({
    url: "https://cyberjapandata.gsi.go.jp/xyz/seamlessphoto/{z}/{x}/{y}.jpg",
    attributions: "国土地理院(https://maps.gsi.go.jp/development/ichiran.html)",
  }),
  extent: ol.proj.transformExtent([60, -20, 120, 50], "EPSG:4326", "EPSG:3857"),
  properties: {
    id: "layer3"
  },
  zIndex: 2
});

const layer4 =  new ol.layer.Group({
  layers: [
    new ol.layer.Vector({
      source: vectorSource2,
      style: new ol.style.Style({
	fill: new ol.style.Fill({
	  color: "rgba(255, 0, 0, 0.7)",
	}),
	stroke: new ol.style.Stroke({
	  color: "rgba(255, 0, 0, 1)",
	  width: 2,
	}),
      }),
      properties: {
	id: "layer4_1"
      }
    }),
    new ol.layer.Vector({
      source: vectorSource3,
      style: new ol.style.Style({
	fill: new ol.style.Fill({
	  color: "rgba(0, 0, 255, 0.7)",
	}),
	stroke: new ol.style.Stroke({
	  color: "rgba(0, 0, 255, 1)",
	  width: 2,
	}),
      }),
      properties: {
	id: "layer4_2"
      },
      zIndex: 100 // 最前面
    }),
    new ol.layer.Vector({
      source: vectorSource4,
      style: new ol.style.Style({
	fill: new ol.style.Fill({
	  color: "rgba(0, 255, 0, 0.7)",
	}),
	stroke: new ol.style.Stroke({
	  color: "rgba(0, 255, 0, 1)",
	  width: 2,
	}),
      }),
      properties: {
	id: "layer4_3"
      }
    })
  ],
  properties: {
    id: "layer4"
  },
  zIndex: 3
});

const map = new ol.Map({
  target: "map",
  layers: [
    layer1, layer2, layer3, layer4
  ],
  view: new ol.View({
      center: ol.proj.fromLonLat([60, 20]),
      zoom: 2,
  })
});

const layerOrderList = (arr) => {
  return "<ul>" +
    (arr || map.getLayers().getArray()).reduce((prev, layer)=>{
      let child = "";
      if(typeof layer.getLayers === "function") {
	child = layerOrderList(layer.getLayers().getArray());
      }

      return prev +
	`<li>
	  <div>${layer.getProperties().id}: ${layer.getZIndex()}</div>${child}
	</li>`
    }, "")
    + "</ul>";
};
document.getElementById("list").innerHTML = layerOrderList();

document.getElementById("order").addEventListener("change", (e)=>{
  if(e.target.value === "asc") {
    layer1.setZIndex(0);
    layer2.setZIndex(1);
    layer3.setZIndex(2);
    layer4.setZIndex(3);
  }
  else if(e.target.value === "desc") {
    layer1.setZIndex(0);
    layer2.setZIndex(3);
    layer3.setZIndex(2);
    layer4.setZIndex(1);
  }
  else {
    layer1.setZIndex(10);
  }
  document.getElementById("list").innerHTML = layerOrderList();
});
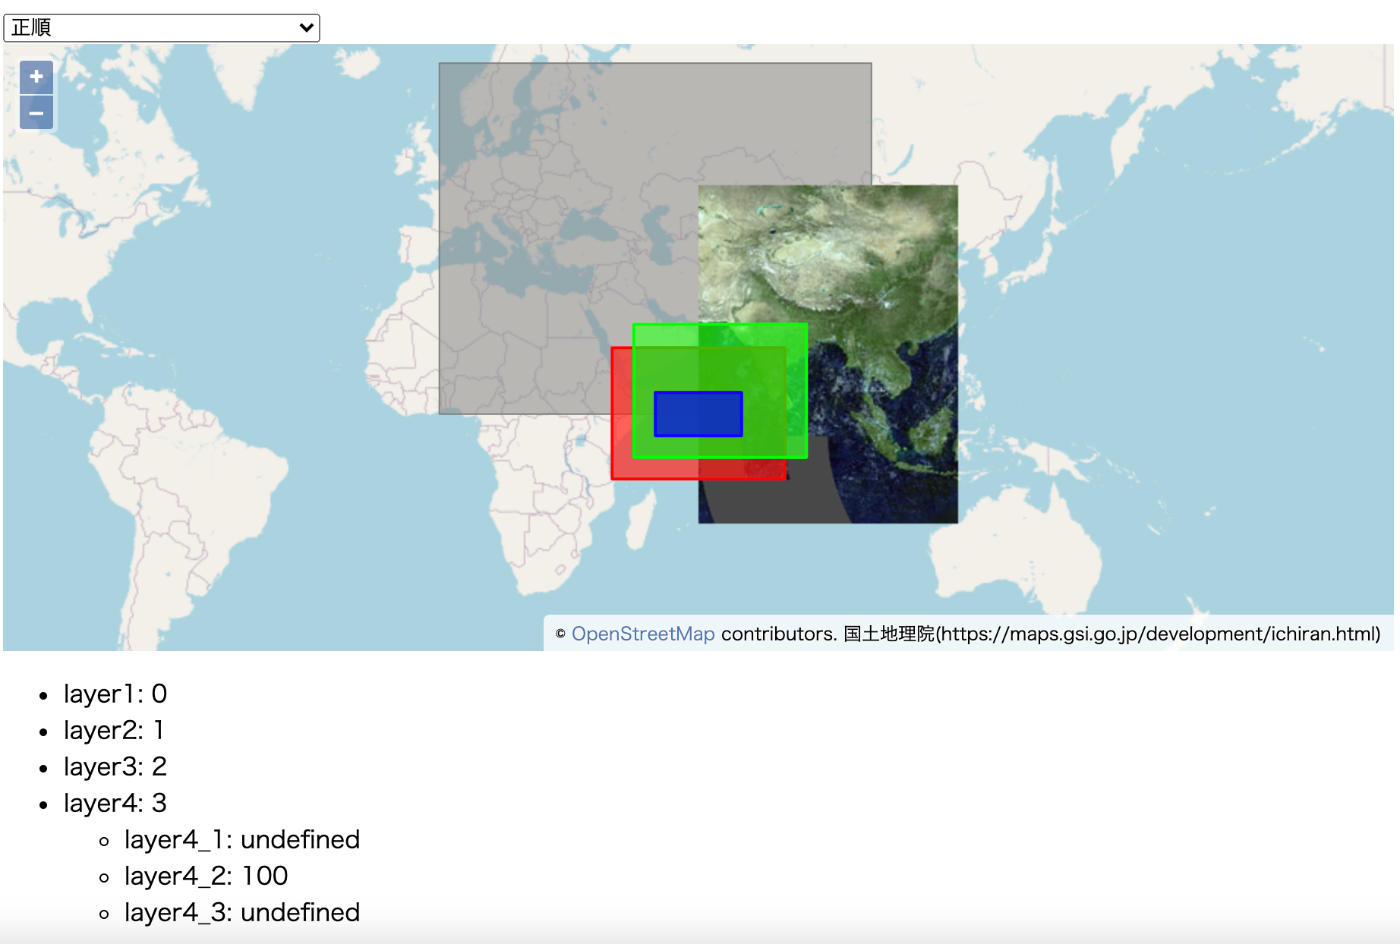
レイヤーの重なり順はレイヤーに設定したzIndexの値で決まる。
なにも設定しない場合はmapに渡した順となる。
あとからsetZIndexで変更も可能。
OpenLayersの特徴としてラスターレイヤーとベクターレイヤーを区別せずに重なり順を設定することができます。
つまり、タイルA->ポリゴンA->タイルBというようにラスターレイヤーとベクターレイヤーを混ぜて重ねることできます[1]。
投影法を切り替える
メルカトル図法(EPSG:3857)
北極域を中心とした投影法(EPSG:3411)

// EPSG:4326の座標で記述されたポリゴン
const polygon1 = {
  "type": "Feature",
  "geometry": {
    "type": "Polygon",
    "coordinates": [
      [
	[0, 0], [100, 0], [100, 60], [0, 60], [0, 0]
      ]
    ],
  },
};
// EPSG:3411の座標で記述されたポリゴン
const polygon2 = {
  "type": "Feature",
  "geometry": {
    "type": "Polygon",
    "coordinates": [
      [
	[234300, -608000],
	[-1286000, -7000000],
	[3780000, -2940000],
	[234300, -608000],
      ]
    ],
  },
};

const getView = (code) => {
  const targetProj =  code ? ol.proj.get(code) : "EPSG:3857";
  return new ol.View({
      projection: targetProj,
      center: [0, 0],
      zoom: 2,
  });
};
const getGeoJson = (options) => {
  const {srcCode, dstCode} = Object.assign({
    srcCode:"EPSG:4326", dstCode:"EPSG:3857"
  }, options);

  return new ol.format.GeoJSON({
    dataProjection: srcCode,
    featureProjection: dstCode,
  });
};
const transformExtent = (extent, options) => {
  const {srcCode, dstCode} = Object.assign({
    srcCode:"EPSG:4326", dstCode:"EPSG:3857"
  }, options);
  return ol.proj.transformExtent(extent, srcCode, dstCode);
}

(async ()=>{
  const proj4Def = await fetch("./proj4def.json")
    .then(response => response.json());
  proj4.defs(
    "EPSG:3411",
    proj4Def["EPSG:3411"]
  );
  ol.proj.proj4.register(proj4);

  const rasterExtent = [80, 20, 120, 50];
  const rasterLayer = new ol.layer.Tile({
    source: new ol.source.XYZ({
      url: "https://cyberjapandata.gsi.go.jp/xyz/seamlessphoto/{z}/{x}/{y}.jpg",
      attributions: "国土地理院(https://maps.gsi.go.jp/development/ichiran.html)",
    }),
    extent: transformExtent(rasterExtent)
  });

  const vectorSource1 = new ol.source.Vector();
  vectorSource1.addFeature(getGeoJson().readFeature(polygon1));
  const vectorSource2 = new ol.source.Vector();
  vectorSource2.addFeature(getGeoJson({srcCode: "EPSG:3411"}).readFeature(polygon2));
  const map = new ol.Map({
    target: "map",
    layers: [
	new ol.layer.Tile({
	  source: new ol.source.OSM(),
	}),
	rasterLayer,
	new ol.layer.Vector({
	  source: vectorSource1,
	  style: new ol.style.Style({
	    fill: new ol.style.Fill({
	      color: "rgba(255, 0, 0, 0.4)",
	    }),
	    stroke: new ol.style.Stroke({
	      color: "rgba(255, 0, 0, 1)",
	      width: 5,
	    }),
	  })
	}),
	new ol.layer.Vector({
	  source: vectorSource2,
	  style: new ol.style.Style({
	    fill: new ol.style.Fill({
	      color: "rgba(0, 255, 0, 0.4)",
	    }),
	    stroke: new ol.style.Stroke({
	      color: "rgba(0, 255, 0, 1)",
	      width: 5,
	    }),
	  })
	})
    ],
    view: getView()
  });

  document.getElementById("proj").addEventListener("change", (e)=>{
    const code = e.target.value;
    const newView = getView(code);
    map.setView(newView);

    // 投影法を切り替えるたびにsourceをクリアして新しい座標系で記述されたfeatureで書き換える
    vectorSource1.clear();
    vectorSource1.addFeature(getGeoJson({dstCode: code}).readFeature(polygon1));
    vectorSource2.clear();
    vectorSource2.addFeature(getGeoJson({srcCode: "EPSG:3411", dstCode: code}).readFeature(polygon2));

    // 投影法を切り替えるたびにextentを設定し直す
    console.log(code, transformExtent(rasterExtent, {dstCode: code}));
    rasterLayer.setExtent(transformExtent(rasterExtent, {dstCode: code}));
  });
})();
平らでない地球を無理やり平面に表現するための方法として様々な投影法が存在します。
OpenLayersではデフォルトでメルカトル図法(EPSG:3857)がViewに指定されます。
また、Viewに指定した投影法の座標系で座標の操作や取得をすることになります。
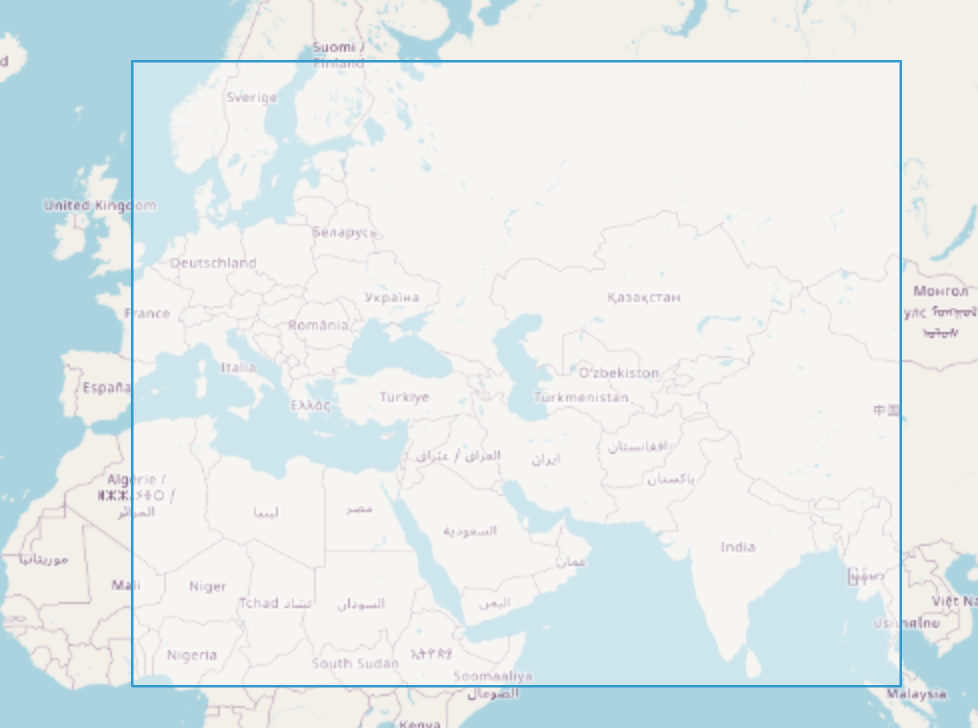
Viewに何も投影法を指定していない(つまりデフォルトのEPSG:3857)のに、centerは緯度経度で指定してしまうのはよくやりがちです。
日本近辺を地図の中心に表示したいとしましょう。
const map = new ol.Map({
  target: 'map',
  view: new ol.View({
    center: [140, 45], // NG 正解は ol.proj.fromLonLat([140, 45]),
    zoom: 1
  }),
});
EPSG:3857で、日本近辺は[15608704,4423157]のようにすごく桁の大きい座標となります。
[140, 45]ではほとんど原点から動きません。
これでは日本のあたりを中心に表示したいのにアフリカのあたりが表示されてしまいます。
ol.proj.fromLonLatなどを使ってViewに利用している投影系での値にきちんと直してあげることを忘れずに。
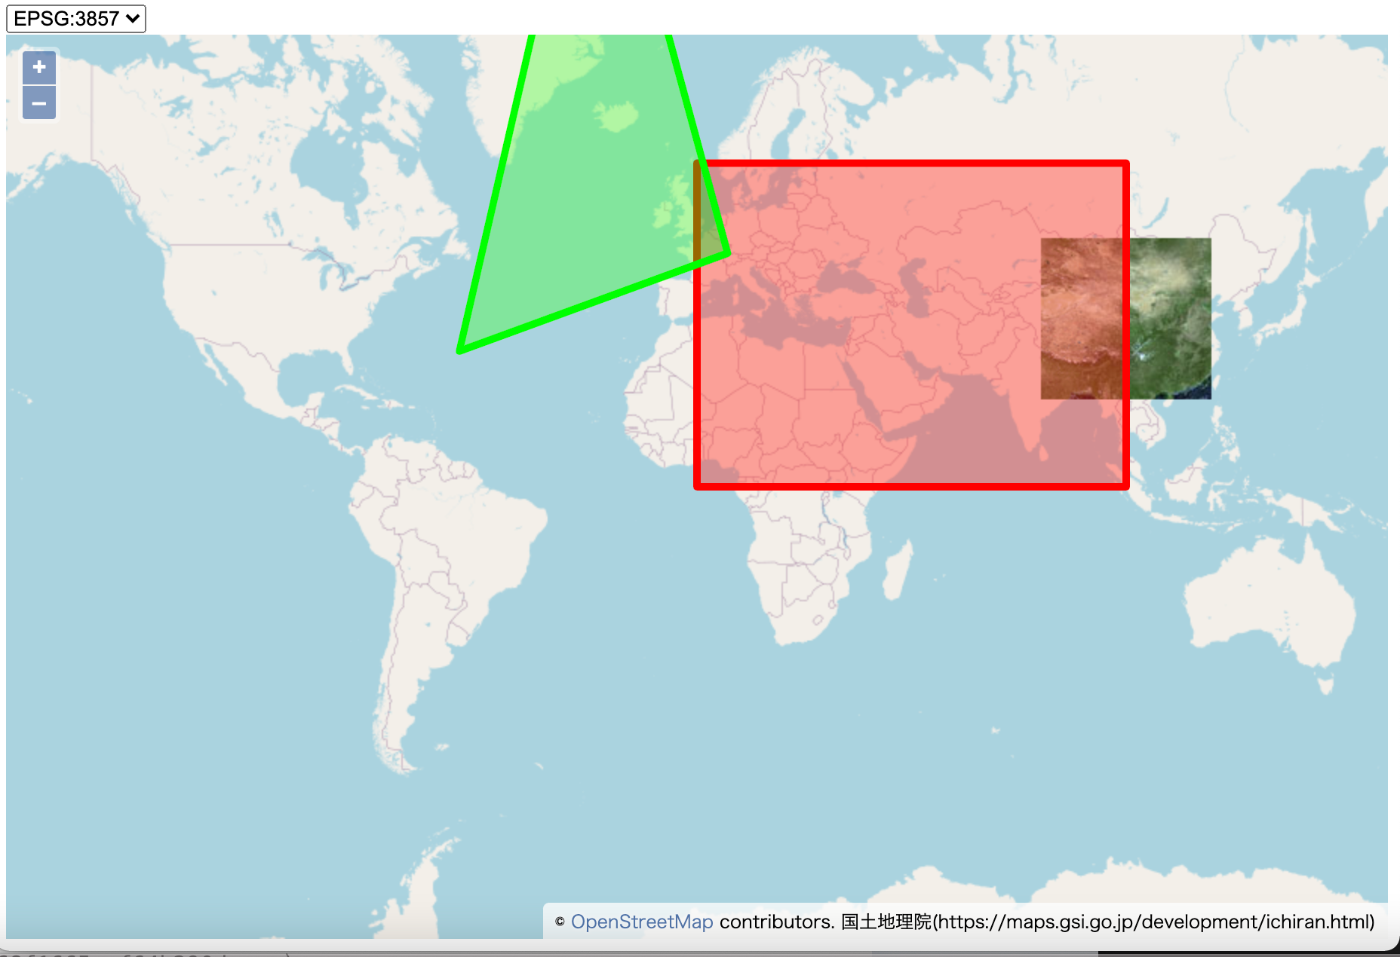
そしてOpenLayersはproj4と組み合わせることで比較的お手軽にEPSG:3857以外の投影法で地図や図形の表示ができます[2]。
サンプルでは北極域を中心とした投影法(EPSG:3411)に切り替えられるようにしています。
proj4の設定はepsg.ioで調べることができますし、epsg-indexというJSONにまとめてくれた大変ありがたいライブラリもあるので使いましょう。
ポリゴンを表示している場合、Viewの投影法を切り替えるのに合わせてSourceも作り変えないと、変更前の座標のままとなり正しく表示できません。
またGeoJSONは基本的にはEPSG:4326で記述するべきですが、それ以外の投影系の座標で記述されていてもnew ol.format.GeoJSONのdataProjectionを適切に設定すれば表示が可能です。
同様に、レイヤーのextentもViewの投影法を切り替えるのに合わせて変更する必要があります。
GeoJSONのスタイル変更
const labels = ["aaa", "bbb", "ccc"]
const geojson1 = {
  "type": "FeatureCollection",
  "features": []
};
for(let i=0; i<1000; i++) {
  const lon = 360 * Math.random() - 180;
  const lat = 160 * Math.random() - 80;
  const width = Math.floor(4 * Math.random());
  const r = Math.floor(256 * Math.random());
  const g = Math.floor(256 * Math.random());
  const b = Math.floor(256 * Math.random());

  geojson1.features.push({
    "type": "Feature",
    "geometry": {
      "type": "Polygon",
      "coordinates": [
	[
	  [lon, lat + 5], [lon - 4, lat - 2], [lon + 4, lat - 2], [lon, lat + 5]
	]
      ],
    },
    "properties": {
      r, g, b, width
    }
  })
}
const geojson2 = {
  "type": "FeatureCollection",
  "features": []
};
for(let i=0; i<1000; i++) {
  const lon = 360 * Math.random() - 180;
  const lat = 160 * Math.random() - 80;
  const text = labels[Math.floor(4 * Math.random())]

  geojson2.features.push({
    "type": "Feature",
    "geometry": {
      "type": "Point",
      "coordinates": [lon, lat]
    },
    "properties": {
      text
    }
  })
}

// Feature個別にスタイルを設定しておく
const vectorSource1 = new ol.source.Vector({
  features: geojson1.features.map((feature)=>{
    const obj =  new ol.Feature(new ol.geom.Polygon(feature.geometry.coordinates));
    obj.setStyle(
      new ol.style.Style({
	fill: new ol.style.Fill({
	  color: `rgba(${feature.properties.r}, ${feature.properties.g}, ${feature.properties.b}, 0.5)`,
	}),
	stroke: new ol.style.Stroke({
	  color: `rgba(${feature.properties.r}, ${feature.properties.g}, ${feature.properties.b}, 1)`,
	  width: feature.properties.width,
	})
      })
    );
    return obj
  })
});

// Featureにはスタイル未設定
const vectorSource2 = new ol.source.Vector();
vectorSource2.addFeatures(new ol.format.GeoJSON({
  dataProjection: "EPSG:4326",
  featureProjection: "EPSG:4326",
}).readFeatures(geojson2));

const layer1 = new ol.layer.Tile({
  source: new ol.source.OSM(),
});

const layer2 = new ol.layer.Vector({
  id: "polygon",
  source: vectorSource1,
  // sourceのFeatureに設定されたstyleが優先される
  style: new ol.style.Style({
    fill: new ol.style.Fill({
      color: `rgba(0, 0, 255, 0.5)`,
    }),
    stroke: new ol.style.Stroke({
      color: `rgba(0, 255,0 , 1)`,
      width: 1,
    })
  })
});

const layer3 = new ol.layer.Vector({
  id: "text",
  source: vectorSource2,
  // レイヤーにスタイルを設定する。
  // 関数を渡すことで、描画時にFeatureの値によってスタイルを変えることができる。
  style: (featureObj)=>{
    const {
      text
    } = featureObj.getProperties();
    return new ol.style.Style({
      text: new ol.style.Text({
	text,
	stroke: new ol.style.Stroke({color: "#fff", width: 2}),
	font: "bold 12px sans-serif"
      })
    })
  }
});

const map = new ol.Map({
  target: "map",
  layers: [
    layer1, layer2, layer3
  ],
  view: new ol.View({
      projection: "EPSG:4326",
      center: [0, 0],
      zoom: 1,
  })
});

let selected = null;
map.on('pointermove', (e) => {
  if (selected) {
    selected.setStyle(undefined);
    selected = null;
  }

  map.forEachFeatureAtPixel(e.pixel, (feature, layer) => {
    selected = feature;
    feature.setStyle(new ol.style.Style({
      text: new ol.style.Text({
	text: feature.getProperties().text,
	stroke: new ol.style.Stroke({color: "#fff", width: 2}),
	font: "bold 24px sans-serif"
      })
    }));
    return true;
  }, {
    layerFilter: (layer) => {
      const id = layer.get("id");
      // textレイヤーのfeatureのみスタイルを変える
      return id === "text";
    }
  });
});
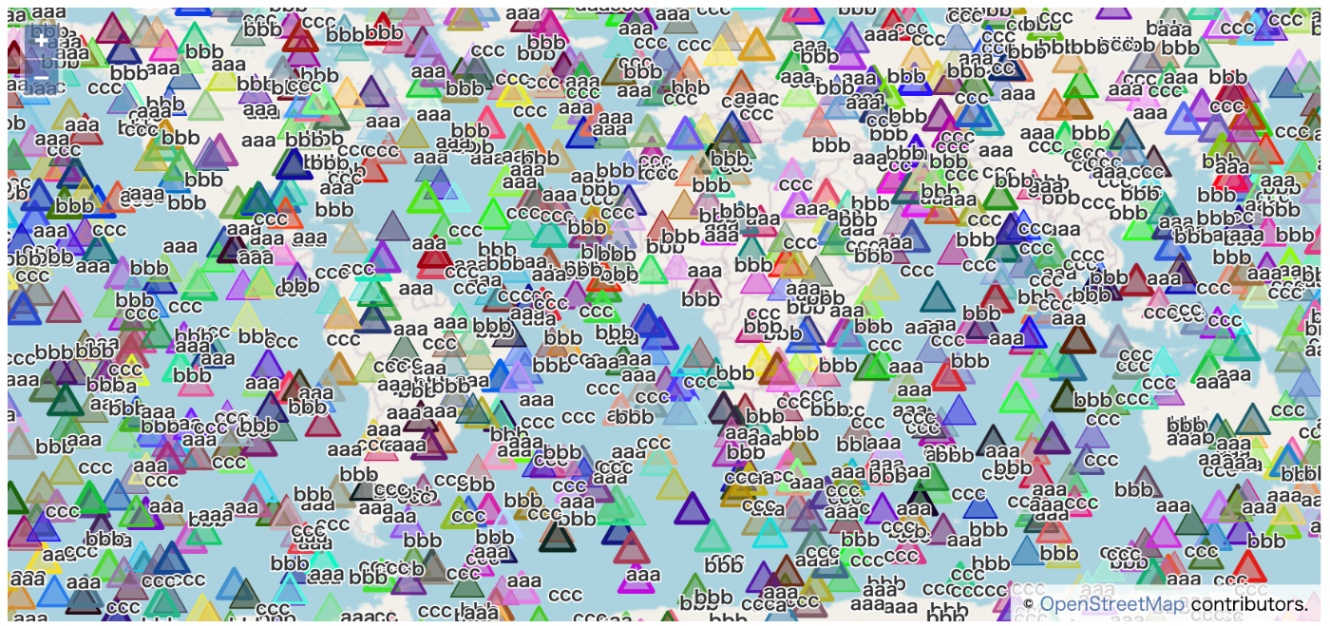
サンプルでは合計2000個のポリゴンを表示しています。
ポリゴンが5000や10000を超えると動きが、PCでの表示がもっさりし始めます。タブレットやスマホでの表示を考慮する場合はポリゴンの表示数の上限を考えたほうがいいでしょう。
もしくはWebGLPointsレイヤーの利用を検討しましょう。
GeoJSONの見た目ですが、styleに何も指定しないとすべての図形で同じデザインとなります。
new ol.layer.Vector({
  source: vectorSource
})
デフォルトの白と水色のデザイン
今回のサンプルでは2種類のベクトルレイヤーを表示しています。
- GeoJSONのFeatureの属性ごとに色と線の太さを変える(ポリゴンレイヤー)
- GeoJSONのFeatureの属性ごとにテキストを表示する(テキストレイヤー)
またmap.forEachFeatureAtPixelを使って、マウスの位置にあるFeatureのスタイルを変更(テキストレイヤーのフォントサイズを大きくする)するようにしています。
forEachFeatureAtPixelはforEachLayerAtPixelと同様に第3引数にlayerFilterを設定すると対象とするレイヤーをフィルタリングできます。
VectorSourceの定義の仕方はいろいろあって毎回悩むのですが、サンプルでは2パターンで書いています。
個人的にはLayerに関数を渡すスタイルのほうがmap.forEachFeatureAtPixelと組み合わせるときが楽なので好みです。
まとめ
OpenLayers v6の個人的Tips集でした。
OpenLayersは公式のサンプルが充実しているとはいえ、日本語だと込み入った使い方の資料も少ないのと、英語でも公式以外ではv6よりも前の資料ばっかりが目立つので、誰かの何かの助けになりますように。
-
Leafletのサンプル
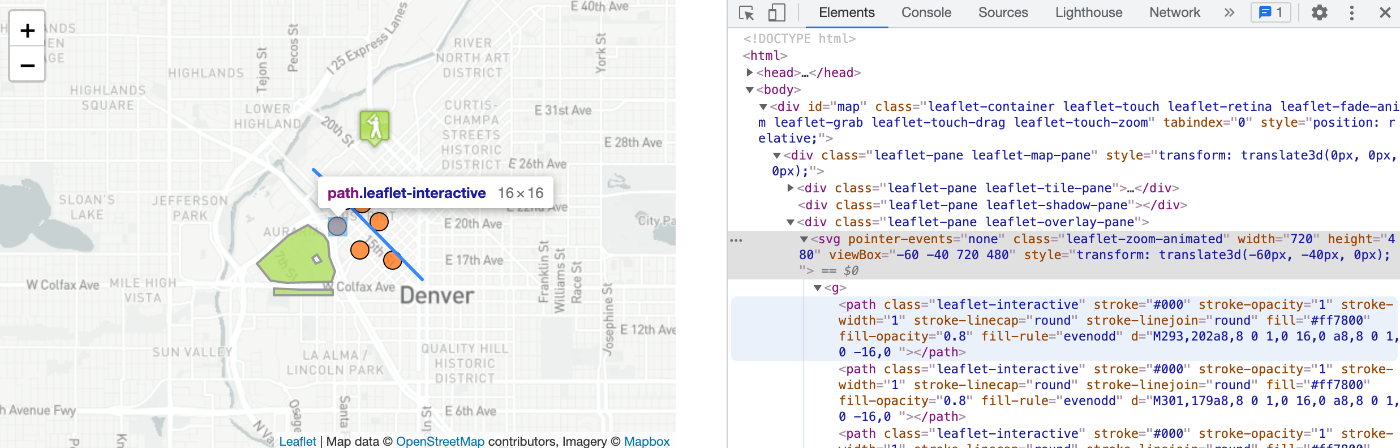
Leafletでは、タイルとポリゴンの配置されるdivが別れている(.leaflet-tile-paneと.leaflet-overlay-pane)ため、タイルA->タイルB->ポリゴンAという重なり順はできても、タイルA->ポリゴンA->タイルBというようにタイルとポリゴンのレイヤーを混ぜて重ねることはできない(レイヤーのoptionsのpaneを無理やり変えれば実現できるが、設計思想的にあまりやるべきではないでしょう)。
ポリゴンより前面にタイルを表示したくなることが果たしてどれくらいあるかはさておく。 ↩︎
Discussion