JavaScriptでエシェロンスキャン法を実装する
空間統計解析の一手法としてホットスポット(集積地域、クラスター)検出というものがあります。
ホットスポット検出では、「ある地域でだけ何かしらの大きい値(例:疾病リスクが高い)が観測されたのは、たまたまではなく、偶然に起こりうる範囲を超えているためである」ことを統計学的に検定(空間スキャン検定)します[1]。
このとき、候補となる地域の範囲を決定するのに一般的には距離(半径)を使いますが、データの空間的な隣接情報と値の高低からホットスポットを求めるエシェロンスキャン法というのがあるそうです。名前がかっこいい。
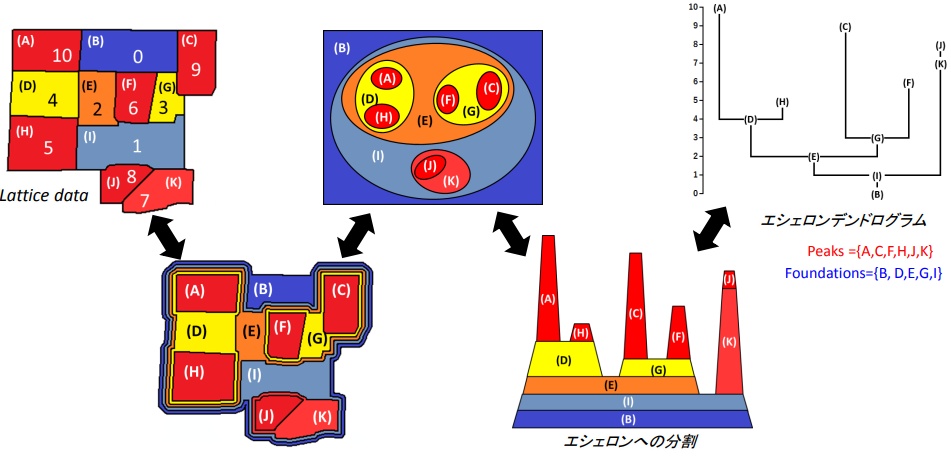
Echelon解析は, 市区町村や州などに分けられた領域上の1変量値に対して, 空間的な位置を表面上のデータの高低に基づき分割し, 空間データの位相的な構造を系統的かつ客観的に見つけるために開発された解析法である.
Echelon解析に基づくスキャン法によるホットスポット検出について
スポット検出例

空間統計解析は主に疫学の分野で磨かれてきた手法ですが、空間データを扱う分野(地理学、地質学、経済学、etc.)であれば利用ができるようなので、エシェロン解析―階層化して視る時空間データ― を読んでみました。
そのアルゴリズムをJavascript(Typescript)で実装してみます。
※本格的に解析をしたい人はRのライブラリを使ってください。
空間スキャン検定
例えばなんらかの病気があって、ある期間や地域で罹っている人が多く観測された場合は「疾病集積性がある」といい、その期間や地域をホットスポット(集積地域、クラスター)といいます[2]。
ただし偶然変動の範囲内でクラスターが生じることもあるため、これがたまたま出ないことを統計学的に検討する必要があります。
帰無仮説H0:ある地域Z内で疾病患者が疾病患者は期待患者数に等しい
対立仮説H1:ある地域Z内で疾病患者が疾病患者は期待患者数より大きい
の検定を尤度比検定(分布を仮定し、モンテカルロ法によるシミュレーションで有意性を評価する)で行います[3]。
病気を例に説明しましたが、観測値の地理的・時間的偏りが偶然でないことを確かめる、偏りがある場所を見つけるのが、空間スキャン検定です。
エシェロン解析
ある地域Z=クラスターの候補となる連結した地域=ウインドウは、一般的には同心円状に広げていく方法が取られますが、それだとうまくいかないケースもあるため、空間データの位相的な構造(エシェロン)を利用しようというのがエシェロン解析です。
より正確な説明は本や論文、資料を見てください。
ピークの算出
ピークは図の赤い部分です。
type EchelonOptions<T> = {
    score?: (v: T) => number;
}

type Peek = number[];

function intersect<T>(a: T[], b: T[]): boolean {
    return a.length + b.length > new Set([...a, ...b]).size
}

function max<T>(candidateIndexes: number[], values: T[], score?: (v: T) => number): [number, number | T] {

    let index = -1;
    let value: T | number = -Infinity;
    candidateIndexes.forEach((i) => {
        const target = score ? score(values[i]) : values[i];

        if (value < target) {
            value = target;
            index = i;
        }
    });
    return [index, value];
}

function getNeighbors(enIndexes: number[], neighbors: number[][]): number[] {
    const ret: number[] = [];
    enIndexes.forEach((index) => {
        neighbors[index].forEach((neighborIndex) => {
            if (enIndexes.indexOf(neighborIndex) < 0 && ret.indexOf(neighborIndex) < 0) {
                ret.push(neighborIndex);
            }
        });
    });
    return ret;
}

function peek<T>(values: T[], neighbors: number[][], options?: EchelonOptions<T>): Peek[] {
    const score = options?.score;

    let unsearched: number[] = Array.from({ length: values.length }, (_, i) => i);

    const ret: number[][] = [];

    while (unsearched.length > 0) {
        const [initIndex, initScore] = max(unsearched, values, score);
	// まだ探索していない要素から、スコアが最大となる要素を抜き出し、ピークの起点とする
        let candidates = [initIndex], candidateScore = initScore;
        const candidateFamilies = [initIndex];

        let en: number[] = [];

        while (candidateFamilies.length < values.length) {
            const candidateNeighbors = getNeighbors(candidateFamilies, neighbors);
            const [nextCandidateIndex, nextCandidateScore] = max(candidateNeighbors, values, score);
	    // 候補要素の1つ隣りの要素からスコアが最大となる要素を抜き出す

            if (candidateScore < nextCandidateScore) {
		// 候補よりも隣接要素のスコアが大きければ候補を破棄し、次のピークを探す
                break;
            }
            if (candidateScore === nextCandidateScore) {
		// スコアが同じときは隣接要素を候補に加え、探索範囲を広げる
                candidates.push(nextCandidateIndex);
            } else {
		// 隣接要素のスコアが小さいときは候補をピークとして当確させ、
		// 隣接要素を次の候補として探索を繰り返す
                en = [...en, ...candidates];
                candidates = [nextCandidateIndex];
                candidateScore = nextCandidateScore;
            }
            candidateFamilies.push(nextCandidateIndex);
	    // すべての要素が候補になったら、候補をピークとして当確させ次のピークを探す
            if (candidateFamilies.length === values.length) {
                en = [...en, ...candidates];
                candidates = [];
                break;
            }
        }

        if (en.length > 0) {
            ret.push(en);
        }

        unsearched = unsearched.filter((index) => {
            return [...en, ...candidates].indexOf(index) < 0;
        });
    }

    return ret;
}
ファウンデーションの算出
ファウンデーションは図の赤い部分の土台となっている部分です。
type Foundation = {
    en: number[];
    fm: number[];
    pk: number[];
    fd: number[]
};

function foundation<T>(values: T[], neighbors: number[][], peeks: Peek[], options?: EchelonOptions<T>):Foundation[] {
    const score = options?.score;
    let unsearchedNode = Array.from({ length: values.length }, (_, i) => i);
    let unsearchedPeek = Array.from({ length: peeks.length }, (_, i) => i);
    const flatPeek = peeks.reduce((previousValue, currentValue) => [...previousValue, ...currentValue], []);
    unsearchedNode = unsearchedNode.filter((index) => {
        return flatPeek.indexOf(index) < 0;
    });

    const ret: Foundation[] = [];
    while (unsearchedNode.length > 0) {
        let en: number[] = [], fm: number[] = [];
        const pk: number[] = [], fd: number[] = [];
        const [initIndex, initScore] = max(unsearchedNode, values, score);
        let candidates = [initIndex], candidateScore = initScore, candidateFamilies = [initIndex];
        let initStage = true;

        while (candidateFamilies.length < values.length) {
            let candidateNeighbors = getNeighbors(candidateFamilies, neighbors)

	    // 探索開始の1段目では、隣接しているピークや発見済みのファウンデーションを家族候補に加える
            if (initStage) {
                while (candidateNeighbors.length > 0) {
		    // すでに発見しているファウンデーションのお尻(底)のほうから子を探索
		    // 候補と重複があるファウンデーションは孫以降なので除外
                    let foundChild = false;
                    const foundationLength = ret.length;
                    for (let foundationIndex = 0; foundationIndex < foundationLength; foundationIndex++){
                        const index = foundationLength - 1 - foundationIndex;
                        const { fm } = ret[index];
                        if (intersect(fm, candidateNeighbors) && !intersect(fm, candidateFamilies)) {
                            foundChild = true;
                            fd.push(index);
                            candidateFamilies = [...candidateFamilies, ...fm];
                        }
                    }

                    unsearchedPeek.forEach((peekIndex) => {
                        const peek = peeks[peekIndex];
                        if (intersect(peek, candidateNeighbors)) {
                            foundChild = true;
                            pk.push(peekIndex);
                            candidateFamilies = [...candidateFamilies, ...peek];
                        }
                    });
                    if (!foundChild) break;
                    candidateNeighbors = getNeighbors(candidateFamilies, neighbors);
                }
            }
	    // 家族候補の隣接要素がない=要素をすべて探索し終えた場合は、候補を当確させる
            if (candidateNeighbors.length === 0) {
                en = [...candidates];
                fm = [...candidates];
                break;
            } else {
		// 家族候補の隣接要素の1つ隣りの要素からスコアが最大となる要素を抜き出す
                const [nextCandidateIndex, nextCandidateScore] = max(candidateNeighbors, values, score);

                if (candidateScore < nextCandidateScore) {
		    // 候補よりも隣接要素のスコアが大きければ候補を破棄し次を探す
                    break;
                }
                if (candidateScore === nextCandidateScore) {
		        // スコアが同じときは隣接要素を候補に加え、探索範囲を広げる
                    candidates.push(nextCandidateIndex);
                } else {
		    // 隣接要素のスコアが小さいときは候補を当確させ、
		    // 隣接要素を次の候補として探索を繰り返す
                    en = [...en, ...candidates];
                    fm = [...candidateFamilies];

                    candidates = [nextCandidateIndex];
                    candidateScore = nextCandidateScore;
                    initStage = false;
                }
                candidateFamilies.push(nextCandidateIndex);
	        // すべての要素が候補になったら、候補を当確させ次を探す
                if (candidateFamilies.length === values.length) {
                    en = [...en, ...candidates];
                    fm = [...candidateFamilies];
                    break;
                }
            }
        }
        unsearchedNode = unsearchedNode.filter((index) => {
            return fm.indexOf(index) < 0;
        });
        unsearchedPeek = unsearchedPeek.filter((index) => {
            return pk.indexOf(index) < 0;
        });

        ret.push({
            en, fm, pk, fd
        });
    }

    return ret;
}
エシェロンの算出
type Echelon = {
    en: number[]; // エシェロン要素の入力配列におけるインデックスの配列
    ch: number[]; // 子要素となるエシェロン要素の出力配列におけるインデックスの配列
    len: number; // エシェロン長さ
    parent: number; // 親要素となるエシェロン要素の出力配列におけるインデックス
    level: number; // ルートまでのエシェロン数
}

function echelon<T>(values: T[], neighbors: number[][], options?: EchelonOptions<T>): Echelon[] {
    const score = options?.score;
    const peeks = peek(values, neighbors, options);
    const foundations = foundation(values, neighbors, peeks, options);
    const ret: Echelon[] = peeks.map((peek) => {
        return { en: peek, ch: [], len: -1, parent: -1, level: -1 };
    });

    foundations.forEach(foundation => {
        const ch = [...foundation.pk, ...foundation.fd.map((index) => {
            return index + peeks.length
        })];
        ch.sort(function (a, b) {
            if (a < b) return -1;
            if (a > b) return 1;
            return 0;
        });

        ret.push({
            en: [...foundation.en],
            ch, len: -1,
            parent: -1,
            level: -1
        });
    });

    const root = ret[ret.length - 1];
    root.level = 0;
    let maxScore: number | T = -Infinity, minScore: number | T = Infinity;
    root.en.forEach((index) => {
        const enScore = score ? score(values[index]) : values[index];
        if (maxScore < enScore)
            maxScore = enScore;

        if (minScore > enScore)
            minScore = enScore;
    });
    root.len = maxScore - minScore;

    fillProperties(ret.length - 1, maxScore, ret, values, options);

    return ret;
}

function fillProperties<T>(parentIndex: number, parentScore: number, echelons: Echelon[], values: T[], options?: EchelonOptions<T>) {
    const score = options?.score;
    const parent = echelons[parentIndex];

    parent.ch.forEach(childIndex => {
        const child = echelons[childIndex];
        child.parent = parentIndex;
        let childScore: any = -Infinity
        child.en.forEach((index) => {
            const enScore = score ? score(values[index]) : values[index];
            if (childScore < enScore)
                childScore = enScore;
        });
        child.len = childScore - parentScore;
        child.level = parent.level + 1;
        if (child.ch.length > 0) {
            fillProperties(childIndex, childScore, echelons, values, options);
        }
    });
}
エシェロン長さは各エシェロンの最大値と親エシェロンの最大値の差です。
最下層のエシェロンをルートと呼びますが、ルートの場合は自身の最大値と最小値の差が長さになります。
const gridValues = [
    [2, 8, 24, 5, 3],
    [1, 10, 14, 22, 15],
    [4, 21, 19, 23, 25],
    [16, 20, 12, 11, 17],
    [13, 6, 9, 7, 18]
];

// 2次元配列の隣接情報を返す
function grid(row: number, col: number, square?: boolean): number[][] {
    const ret: number[][] = [];
    for (let i = 0; i < row; i++) {
        for (let j = 0; j < col; j++) {
            const neighbor: number[] = [];
            if (i > 0) {
                if (square && j > 0)
                    neighbor.push(col * (i - 1) + j - 1);
                neighbor.push(col * (i - 1) + j);
                if (square && j < col - 1)
                    neighbor.push(col * (i - 1) + j + 1);
            }

            if (j > 0) neighbor.push(col * i + j - 1);
            if (j < col - 1) neighbor.push(col * i + j + 1);

            if (i < row - 1) {
                if (square && j > 0)
                    neighbor.push(col * (i + 1) + j - 1);
                neighbor.push(col * (i + 1) + j);
                if (square && j < col - 1)
                    neighbor.push(col * (i + 1) + j + 1);

            }

            ret.push(neighbor);
        }
    }

    return ret;
}

echelon(gridValues.flat(), grid(gridValues.length, gridValues[0].length));

// [
//   { en: [ 14, 13, 8 ], ch: [], len: 6, parent: 4, level: 3 },
//   { en: [ 2 ], ch: [], len: 10, parent: 6, level: 1 },
//   { en: [ 11, 16 ], ch: [], len: 2, parent: 4, level: 3 },
//   { en: [ 24 ], ch: [], len: 1, parent: 5, level: 2 },
//   { en: [ 12 ], ch: [ 0, 2 ], len: 2, parent: 5, level: 2 },
//   { en: [ 19, 15, 9 ], ch: [ 3, 4 ], len: 3, parent: 6, level: 1 },
//   {
//     en: [
//       7, 20, 17, 18, 6, 22, 1, 23, 21, 3, 10, 4, 0, 5
//     ],
//     ch: [ 1, 5 ],
//     len: 13,
//     parent: -1,
//     level: 0
//   }
// ]
出力のenでgridValues[3][1]は(5 * 3 + 2 =)17と表現される。
自分の理解力不足のせいか本に載っていたアルゴリズムをそのまま実装してもうまくいかなかったので、自分なりの工夫をしている部分があります。正式なアルゴリズムは本を確認してください。
計算結果は例題とあっているので、間違ってはいないと思いたい。
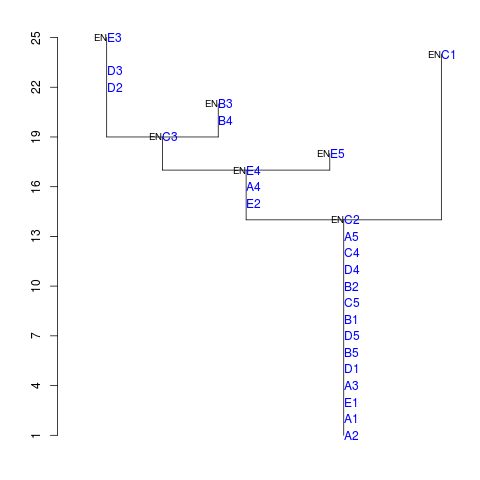
echescanでの結果
  Order Parent Maxval Minval Length Cells Progeny Family Level
1     1      5     25     22      6     3       0      1     3
2     1      7     24     24     10     1       0      1     1
3     1      5     21     20      2     2       0      1     3
4     1      6     18     18      1     1       0      1     2
5     2      6     19     19      2     1       2      3     2
6     2      7     17     15      3     3       2      5     1
7     2      0     14      1     13    14       2      7     0
エシェロンスキャン法
- 対象データをエシェロン解析をする
- 上の階層からウインドウZを形成しホットスポット候補とし、LLR(Z)を計算する
- 2を事前に決めた指標(対象が50%以上になるまで、など)を超えるまで繰り返す
- モンテカルロ法により候補の有意度を計算する
LLRはlog likelihood rateで、対数尤度比です。
式は扱うデータの分布の過程によって異なります。
ポアソン分布
症例数のような「正の整数で、発生するのが比較的稀」な事象を扱うためにポアソン分布を仮定する例がよく紹介されています。
式やサンプルデータの数値はエシェロン解析―階層化して視る時空間データ―かBreast cancer clusters in the northeast United States: a geographic analysisによります。詳細はそちらを見てください。
type Scan = {
    indexes: number[];
    llr: number;
    p: number;
};

function poisson(lambda: number): number {
    // lambdaが大きいと収束しない
    // 大きい値にも対応するには"The transformed rejection method for generating Poisson random variables"などを参照
    const b = Math.exp(-lambda);
    let a = Math.random();
    let ret = 0;
    while (a >= b) {
      a *= Math.random();
      ret += 1;
    }
    return ret;
}


function offspring(index: number, echelons: Echelon[], level=-1):number[] {
    const root = echelons[index];
    let ret: number[] = [];
    if (level >= 0) ret = [...root.en];

    root.ch.forEach((childIndex) => {
            ret = [...ret, ...offspring(childIndex, echelons, level + 1)];
    });
    return ret;
}

function scanPoissonDistribution(population: number[], cases: number[], expectations: number[], echelons: Echelon[],
    options: {
        limitRate?: number;
        mcIter?: number;
    }
): Scan[] {
    const limitRate = options?.limitRate ? options.limitRate : 0.5;
    const mcIter = options?.mcIter ? options.mcIter : 999;


    let totalPopulation = 0;
    population.forEach((v) => {
        totalPopulation += v;
    });

    let totalCase = 0;
    cases.forEach((v) => {
        totalCase += v;
    });

    const llr = (window: number[], sampleCases: number[], expectations: number[]): number => {
        let windowCase = 0, windowExpectation = 0;
        for (let i = 0; i < sampleCases.length; i++) {
            if (window.indexOf(i) >= 0) {
                windowCase += sampleCases[i];
            }
        }
        for (let i = 0; i < expectations.length; i++) {
            if (window.indexOf(i) >= 0) {
	        // ウインドウ内での調整期待数を計算せず、単純に期待数の積算で済ませている
                windowExpectation += expectations[i];
            }
        }

        if (windowCase < windowExpectation) return 0;
	// 参考書籍に「総観測数と、各領域の人口niを固定した元で」とあるのでtotalCaseはcasesの合計値を使用
        return windowCase * Math.log(windowCase / windowExpectation) +
            (totalCase - windowCase) * Math.log((totalCase - windowCase) / (totalCase - windowExpectation));
    };

    const windows: {
        indexes: number[];
        llr: number;
    }[] = [];
    let reachedLimit = false;
    for (let i = 0; i < echelons.length; i++) {
        const target = echelons[i];
        let familyTotal = 0;
        const prev = [];
        offspring(i, echelons).forEach((index) => {
            familyTotal += population[index];
            prev.push(index);
        });
        for (let j = 0; j < target.en.length; j++) {
            familyTotal += population[target.en[j]];
            prev.push(target.en[j]);
            const indexes = [...prev];
            windows.push({
                indexes,
                llr: llr(indexes, cases, expectations)
            });

            if (familyTotal > totalPopulation * limitRate) {
                reachedLimit = true;
                break;
            }
        }
        if (reachedLimit) break;
    }
    windows.sort(function (a, b) {
        if (a.llr > b.llr) return -1;
        if (a.llr < b.llr) return 1;
        return 0;
    });

    let checked:number[] = [];
    const candidates = windows.filter((window) => {
        if (!intersect(window.indexes, checked)) {
            checked = [...checked, ...window.indexes];
            return true;
        }
        return false;
    });

    // ここからモンテカルロ法
    const montecarlos:number[] = [];
    for (let i = 0; i < mcIter; i++) {
        const randamized = expectations.map((ex) => {
            return poisson(ex)
        });
        let maxLLR = 0;
        windows.forEach((window) => {
            const v = llr(window.indexes, randamized, expectations);
            if (maxLLR < v) maxLLR = v;
        });
        montecarlos.push(maxLLR);
    }
    montecarlos.sort(function (a, b) {
        if (a > b) return -1;
        if (a < b) return 1;
        return 0;
    });

    const ret: Scan[] = [];
    candidates.forEach((window) => {
        let r = 1;
        for (let i = 0; i < montecarlos.length; i++) {
            if (window.llr > montecarlos[i]) break;
            r++;
        }
        const p = r / (1 + mcIter);

        ret.push({
            ...window,
            p
        });

    });
    return ret;
}
東京23区の肺炎脂肪データからスポットを探します。
const tokyoSmrs = [
    {
        "n": 29987, // 人口
        "o": 11, // 肺炎死亡数
        "e": 15.388 // 調整期待死亡数
    }, // 略
];

const tokyoWards = {
    "type": "FeatureCollection",
    "features": [
        {
            "type": "Feature",
            "properties": {
                "id": 1,
                "name": "千代田区",
                "neighbor": [
                    1, 2, 3, 4, 5
                ]
            },
            "geometry": {
                "type": "MultiPolygon",
                "coordinates": [
		    // 略
		]
	    }
	}, // 略
    ]
}

const echelons = echelon(
    tokyoSmrs.map((v) => {
	return v.o / v.e; // 標準化死亡比SMR
    }),
    tokyoWards.features.map((ward) => {
	return ward.properties.neighbor
    })
);
scanPoissonDistribution(
    tokyoSmrs.map((v) => {
        return v.n
    }),
    tokyoSmrs.map((v) => {
        return v.o
    }),
    tokyoSmrs.map((v) => {
        return v.e
    }),
    echelons
);
> [
>   { "indexes": [21, 20, 19, 18, 15, 16], "llr": 23.352611055749918, "p": 0.001 },
>   { "indexes": [5], "llr": 0.1640465997933367, "p": 0.832 },
>   { "indexes": [12], "llr": 0, "p": 1 }
> ]
indexesの各値に1を足すと区の番号になります。
p=0.05においてホットスポット候補1位は十分に有意ですが、2位は棄却されました[4]。
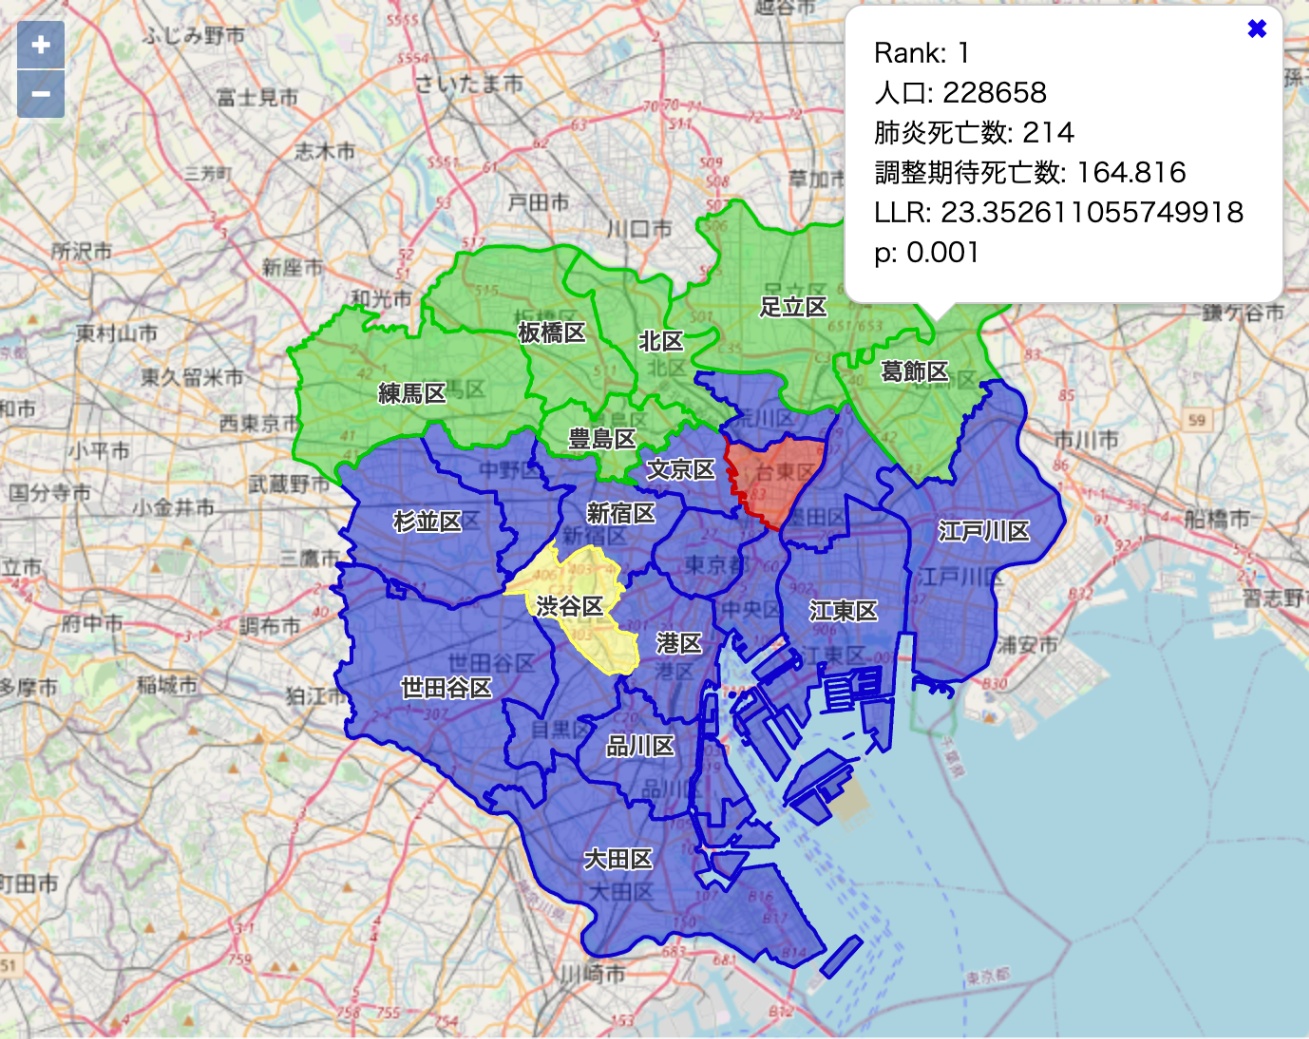
緑が1位のウインドウ(スポット)、赤が2位のウインドウ、黄色が3位のウインドウ
正規分布
連続値な事象を扱うためには正規分布を仮定します。
正規分布の計算法と例は書籍には載っていないため、Breast Cancer Clusters in the Northeast United States: A Geographic Analysisを参考にLLRを計算します[5]。
ウインドウの探索の打ち切り条件は領域数20としました。
function normal(mu: number, sigma: number): number {
  const a1 = Math.random(), b1 = Math.random();
  const a2 = Math.sqrt(-2 * Math.log(a1));
  const b2 = 2 * Math.PI * b1;
  return mu + sigma * a2 * Math.sin(b2);
}

function scanNormalDistribution(cases: number[], echelons: Echelon[],
    options: {
        limitWindow?: number;
        mcIter?: number;
    }
): Scan[] {
    const limitWindow = options?.limitWindow ? options.limitWindow : 20;
    const mcIter = options?.mcIter ? options.mcIter : 999;

    let total = 0;
    cases.forEach((v) => {
        total += v;
    });

    const N = cases.length;
    const mean = total / N;
    const variance = cases.reduce((prev, value) => {
        return prev + (value - mean) ** 2;
    }, 0) / N;
    const deviation = Math.sqrt(variance);

    const llr = (window: number[], sampleCases: number[]): number => {
        let caseDispersion = 0, windowVariance=0, windowTotal = 0;
        for (let i = 0; i < sampleCases.length; i++) {
            caseDispersion += (sampleCases[i] - mean) ** 2;
            windowVariance += sampleCases[i] ** 2;

            if (window.includes(i)) {
                windowTotal += sampleCases[i];
            }
        }

        const windowNumber = window.length;
        const windowMean = windowTotal / windowNumber;
        const otherTotal = total - windowTotal;
        const otherNumber = N - windowNumber;
        const otherMean = otherTotal / otherNumber;

        if (windowMean < otherMean) return 0;

        windowVariance += (-2 * windowTotal * windowMean + window.length * windowMean ** 2
            - 2 * otherTotal * otherMean + otherNumber * otherMean ** 2);
        windowVariance /= N;

        return N * Math.log(deviation) + 0.5 * caseDispersion / variance - 0.5 * N  - 0.5 * N * Math.log(windowVariance);
    };

    const windows: {
        indexes: number[];
        llr: number;
    }[] = [];
    let reachedLimit = false;
    for (let i = 0; i < echelons.length; i++) {
        const target = echelons[i];
        const prev = [];
        offspring(i, echelons).forEach((index) => {
            prev.push(index);
        });
        for (let j = 0; j < target.en.length; j++) {
            prev.push(target.en[j]);
            const indexes = [...prev];
            windows.push({
                indexes,
                llr: llr(indexes, cases)
            });

            if (windows.length > limitWindow) {
                reachedLimit = true;
                break;
            }
        }
        if (reachedLimit) break;
    }
    windows.sort(function (a, b) {
        if (a.llr > b.llr) return -1;
        if (a.llr < b.llr) return 1;
        return 0;
    });

    let checked:number[] = [];
    const candidates = windows.filter((window) => {
        if (!intersect(window.indexes, checked)) {
            checked = [...checked, ...window.indexes];
            return true;
        }
        return false;
    });

    const montecarlos:number[] = [];

    for (let i = 0; i < mcIter; i++) {
        const randamized = cases.map(() => {
            return normal(mean, deviation)
        });
        let maxLLR = 0;
        windows.forEach((window) => {
            const v = llr(window.indexes, randamized);
            if (maxLLR < v) maxLLR = v;
        });
        montecarlos.push(maxLLR);
    }
    montecarlos.sort(function (a, b) {
        if (a > b) return -1;
        if (a < b) return 1;
        return 0;
    });

    const ret: Scan[] = [];
    candidates.forEach((window) => {
        let r = 1;
        for (let i = 0; i < montecarlos.length; i++) {
            if (window.llr > montecarlos[i]) break;
            r++;
        }
        const p = r / (1 + mcIter);

        ret.push({
            ...window,
            p
        });

    });
    return ret;
}

function scanPoissonDistribution(population: number[], cases: number[], expectations: number[], echelons: Echelon[],
    options: {
        limitRate?: number;
        mcIter?: number;
    }
): Scan[] {
    const limitRate = options?.limitRate ? options.limitRate : 0.5;
    const mcIter = options?.mcIter ? options.mcIter : 999;


    let totalPopulation = 0;
    population.forEach((v) => {
        totalPopulation += v;
    });

    let totalCase = 0;
    cases.forEach((v) => {
        totalCase += v;
    });

    const llr = (window: number[], sampleCases: number[], expectations: number[]): number => {
        let windowCase = 0, windowExpectation = 0;
        for (let i = 0; i < sampleCases.length; i++) {
            if (window.includes(i)) {
                windowCase += sampleCases[i];
            }
        }
        for (let i = 0; i < expectations.length; i++) {
            if (window.includes(i)) {
                windowExpectation += expectations[i];
            }
        }

        if (windowCase < windowExpectation) return 0;

        return windowCase * Math.log(windowCase / windowExpectation) +
            (totalCase - windowCase) * Math.log((totalCase - windowCase) / (totalCase - windowExpectation));
    };


    const windows: {
        indexes: number[];
        llr: number;
    }[] = [];
    let reachedLimit = false;
    for (let i = 0; i < echelons.length; i++) {
        const target = echelons[i];
        let familyTotal = 0;
        const prev = [];
        offspring(i, echelons).forEach((index) => {
            familyTotal += population[index];
            prev.push(index);
        });
        for (let j = 0; j < target.en.length; j++) {
            familyTotal += population[target.en[j]];
            prev.push(target.en[j]);
            const indexes = [...prev];
            windows.push({
                indexes,
                llr: llr(indexes, cases, expectations)
            });

            if (familyTotal > totalPopulation * limitRate) {
                reachedLimit = true;
                break;
            }
        }
        if (reachedLimit) break;
    }
    windows.sort(function (a, b) {
        if (a.llr > b.llr) return -1;
        if (a.llr < b.llr) return 1;
        return 0;
    });

    let checked:number[] = [];
    const candidates = windows.filter((window) => {
        if (!intersect(window.indexes, checked)) {
            checked = [...checked, ...window.indexes];
            return true;
        }
        return false;
    });

    const montecarlos:number[] = [];

    for (let i = 0; i < mcIter; i++) {
        const randamized = expectations.map((ex) => {
            return poisson(ex)
        });
        let maxLLR = 0;
        windows.forEach((window) => {
            const v = llr(window.indexes, randamized, expectations);
            if (maxLLR < v) maxLLR = v;
        });
        montecarlos.push(maxLLR);
    }
    montecarlos.sort(function (a, b) {
        if (a > b) return -1;
        if (a < b) return 1;
        return 0;
    });

    const ret: Scan[] = [];
    candidates.forEach((window) => {
        let r = 1;
        for (let i = 0; i < montecarlos.length; i++) {
            if (window.llr > montecarlos[i]) break;
            r++;
        }
        const p = r / (1 + mcIter);

        ret.push({
            ...window,
            p
        });

    });
    return ret;
}
さて、計算を試してみたいのですが論文で使われるデータを引っ張ってきたり再現するのはめんどうなので、東京23区で模擬的なデータを作ります。
| 区 | 平均 | 標準偏差 |
|---|---|---|
| 世田谷区, 杉並区, 中野区, 豊島区 | 2000 | 100 |
| 葛飾区, 墨田区, 江東区 | 1200 | 100 |
| その他 | 1000 | 100 |
西側の区はその他と3シグマで重ならない分布で生成し、東側の区はその他と分布が重なるように生成します[6]。
[
    965.1762991910941, //千代田区
    1203.1992995393907, //中央区
    950.4469812556313, //港区
    949.1196030282699, //新宿区
    834.6934824085042, //文京区
    1052.3583465005102, //台東区
    1180.6756046653607, //墨田区
    1227.1153926963484, //江東区
    1054.6307250236705, //品川区
    936.125397793576, //目黒区
    894.1121320636007, //大田区
    1994.9905381878414, //世田谷区
    1015.6186578966642, //渋谷区
    2074.106538490371, //中野区
    2134.9404581192503, //杉並区
    2059.7085727290873, //豊島区
    1138.9339086167859, //北区
    969.8249374031409, //荒川区
    970.158972671424, //板橋区
    1074.5778163570503, //練馬区
    1036.216338249573, //足立区
    1225.276069151189, //葛飾区
    998.6697684096022 //江戸川区
]
平均は約1214, 偏差は約404でした。
このデータ(tokyoContinuousValues)を使ってスポットを探します。
const echelons = echelon(
tokyoContinuousValues,
tokyoWards.features.map((ward) => {
return ward.properties.neighbor
})
);
scanNormalDistribution(
tokyoContinuousValues, echelons
);
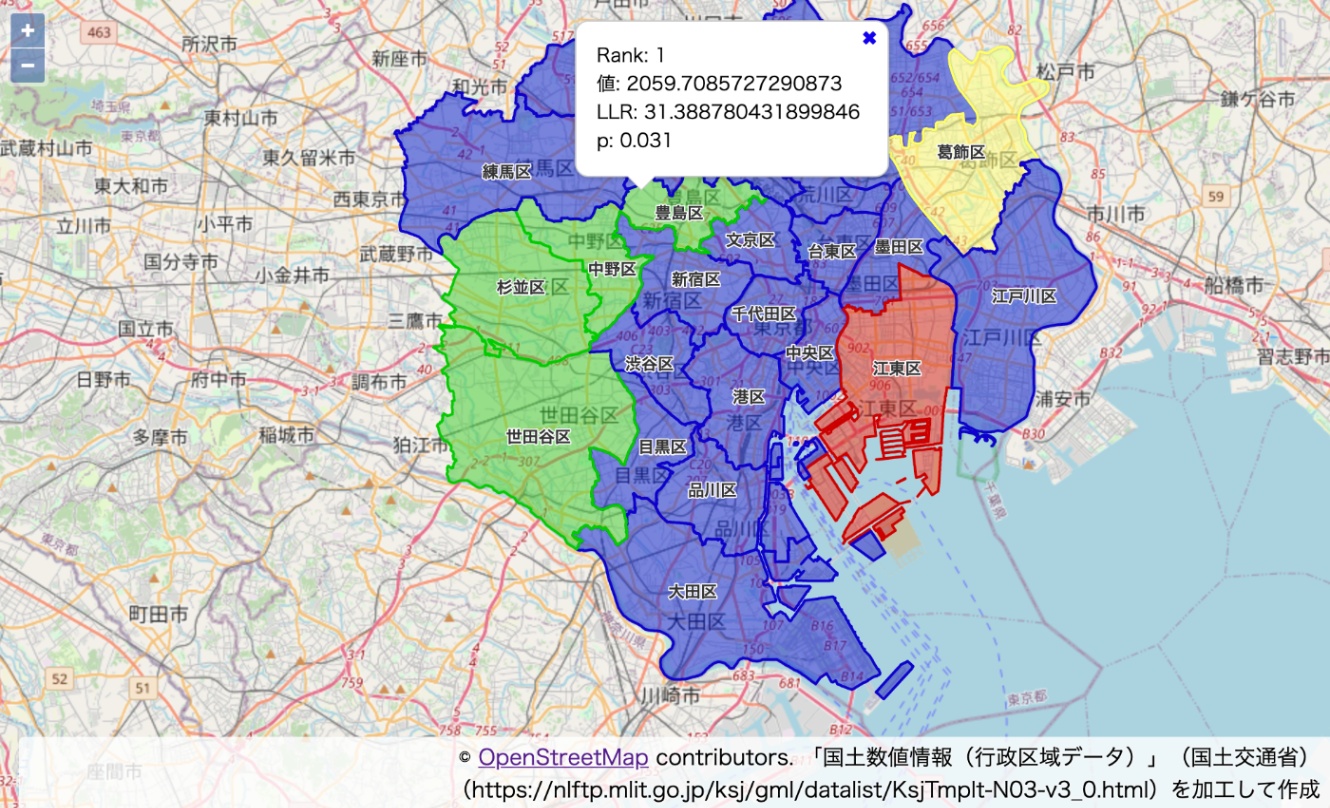
> [
> {"indexes":[14,13,15,11],"llr":31.388780431899846,"p":0.031},
> {"indexes":[7],"llr":0.0004849928315877605,"p":0.364},
> {"indexes":[21],"llr":0.00035081996617236655,"p":0.364}
> ]
ホットスポット候補1位は「世田谷区, 杉並区, 中野区, 豊島区」で生成時の分布どおりになりました。pもp=0.05で有意でした。
2位は江東区、3位は葛飾区で、これらも生成時の分布どおりです。
値が他の領域よりも大きいものの、p=0.05で偶然の範囲を越えないと判断されていますが、これも元の分布どおりと言っていいでしょう。
今回はあくまで模擬データでの検証でしたが、連続値でスキャンができると地域メッシュ統計の値や衛星画像から得られる何某かの値を使ったホットスポットの検出ができるようになるため、利用の範囲が広がるはずです。
他
ベルヌーイ分布: A spatial scan statistic
指数分布: A Spatial Scan Statistic for Survival Data
ジニ係数: ジニ係数を活用した店舗立地の時空間分析
まとめ
主にエシェロン解析―階層化して視る時空間データ―を参考に、他にも論文を引きつつJavaScript(TypeScript)でエシェロンスキャンを行いました。
echejs
JavaScriptでスポット検出ができるとOpenlayersと組み合わせるとブラウザ上で色々できそうで夢は広がります(とはいえそもそも領域の隣接情報を用意するのが大変ですが……)。
Discussion