🍣
温湿度計 Inkbird IBS-TH1 のデータを New Relic で可視化する
New Relic はあらゆるデータを可視化、観測可能にするテレメトリーデータプラットフォームです。1 ユーザー・100 GB/月までのデータといった個人的な利用の範囲であれば十分なほど無料で使うことができるので、活用してみようと思いました。
構成
Raspberry Pi から定期的にセンサーの値を取得し、送信します。

確認した機器は以下の通りです。
- 環境センサー (Bluetooth温湿度計)
- Raspberry Pi
- Raspberry Pi 2 Model B + Bluetooth アダプタ ELECOM LBT-UAN05C2
- Raspberry Pi 4 Model B (内蔵 Bluetooth デバイス)
参考情報
以下の記事を参考にさせて頂きました。ありがとうございます。
- Inkbird IBS-TH1 miniの値をRaspberryPiでロギング - Qiita
- 家の中のセンサデータをRaspberryPiで取得しまくり、スーパーIoTハウスを実現 - Qiita
- Inkbird IBS-TH1 からBluetooth LEで温度・湿度情報を取得して可視化する - passacaglia
- Bluetooth経由でInkbirdの温度計から温度と湿度の履歴データを取得する
- GoveeWatcher
HOWTO
Bluetooth デバイスの有効化
Bluetooth をインストールし、デバイスを有効にしておきます。
sudo apt-get install -y bluetooth
内蔵 Bluetooth デバイスを使用する場合は pi-bluetooth が必要です。
sudo apt-get install -y pi-bluetooth
hciconfig で状態が RUNNING となっていれば OK です。
$ hciconfig
hci0:   Type: Primary  Bus: USB
    BD Address: 00:1B:DC:FD:23:3B  ACL MTU: 310:10  SCO MTU: 64:8
    UP RUNNING
    RX bytes:193204 acl:1053 sco:0 events:19121 errors:0
    TX bytes:128482 acl:1053 sco:0 commands:11620 errors:0
温湿度計データを取得 (Inkbird の場合)
Python でセンサーから現在の計測値を取得します。
BLE デバイスにアクセスするためのインターフェイスライブラリとして、bluepy をインストールします。
$ sudo apt-get install python3-pip
$ python3 -m pip install bluepy
以下のようなコードで、温湿度データを取得します。
import struct
from bluepy import btle

def get_sensor_data(mac_addr):
    p = btle.Peripheral(mac_addr)
    svc = p.getServiceByUUID("fff0")  # get Service object
    ch = svc.getCharacteristics("fff2")[0]  # get Characteristic object of Real-time Data Characteristic
    data = ch.read()  # read current value of Characteristic
    p.disconnect()
    (temp, humid) = struct.unpack("<hh", data[:4])
    return {
        "temperature": temp / 100,
        "humidity": humid / 100
    }
取得できるデータは以下の形式のようです。後半は無視しています。
| バイト位置 | 値 |
|---|---|
| 1~2 | 温度 (リトルエンディアン、0.01℃単位) |
| 3~4 | 温度 (リトルエンディアン、0.01%単位) |
| 5 | プローブ(外部温度センサー)接続されているかどうか |
| 6~7 | ? |
温湿度計データを取得 (Govee の場合)
Govee は定期的に送られるアドバタイズから温湿度データを受信します。
def get_sensor_data(data: bytes) -> Optional[dict]:
    idx = 0
    while idx < len(data):
        length = data[idx]
        adtype = data[idx + 1]
        value = data[idx + 2:idx + 1 + length]
        idx += (1 + length)
        if adtype == 0xff and value[0] == 0x88 and value[1] == 0xec:
            v = struct.unpack(">l", value[2:6])[0]
            return {
                "temperature": int(v / 1000) / 10,
                "humidity": (v % 1000) / 10
            }
    return None


class ScanDelegate(DefaultDelegate):
    def __init__(self):
        DefaultDelegate.__init__(self)

    def handleDiscovery(self, scanEntry, isNewDev, isNewData):
        sensor_data = get_sensor_data(scanEntry.rawData)


while True:
    scanner = Scanner().withDelegate(ScanDelegate())
    scanner.start()
    scanner.process(60)
New Relic への送信
New Relic Telemetry SDK for Python を使い、データを New Relic に送信します。
SDK をインストールします。
$ python3 -m pip install newrelic_telemetry_sdk
コード例
from newrelic_telemetry_sdk import MetricClient, GaugeMetric

metric_client = MetricClient(NEW_RELIC_INSERT_KEY)
res = metric_client.send_batch([
    GaugeMetric("temperature", sensor_data["temperature"], {"name": name}),
    GaugeMetric("humidity", sensor_data["humidity"], {"name": name}),
])
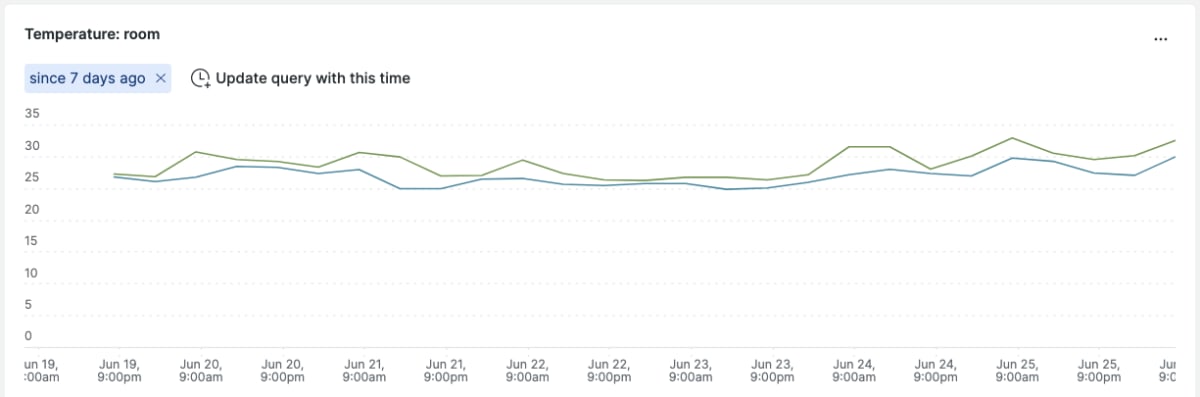
温度、湿度をそれぞれ temperature, humidity という名前の Metric に送信します。これらを定期的に送信することで、グラフ表示できるようになります!
クエリ例
SELECT min(temperature), max(temperature) FROM Metric WHERE name = 'room' SINCE 1 DAY AGO TIMESERIES
Discussion