📖
Nuxt.jsでWebアプリケーション開発メモ28
概要
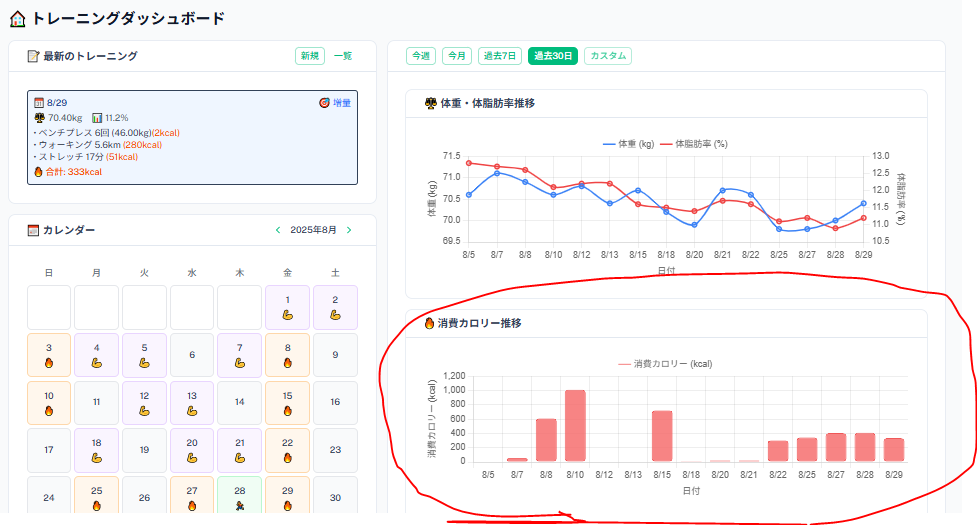
消費カロリー推移チャートガジェットの実装。
プロンプト28
# 命令28
- `消費カロリー推移`ダッシュボードガジェットの機能実装
# 命令28-1
- `pages/top.vue`消費カロリー推移チャートを実装してください。
- バックエンドからのデータ取得は体重・体脂肪率推移チャート用のデータと共用できるはずですので、可能であればそれを利用してください。
- 期間を設定するボタンは消費カロリー推移チャートも対象になりますので、留意してください。
- チャートのオプションですが、体重・体脂肪率推移チャート用に`weightChartOptions`が定義されていますが、`scales`以外は同じ内容にしてください。その為、共通化できる部分は1つにまとめて使うような構成にしてください。(消費カロリー推移チャートは1軸ですので、留意してください。)
対応内容
- 消費カロリー推移チャートデータをバックエンドからREST APIで取得し、指定期間に応じて表示させる。
- チャートオプション(チャートの見た目等)設定を体重・体脂肪率推移チャートと共通化。
画面
ソース差分
チャートオプション共通化差分
pages/top.vue
@@ -474,105 +494,143 @@
 import type { ChartData, ChartOptions } from 'chart.js'
 // 型定義
 type TrainingRecordListResponse = components['schemas']['TrainingRecordListResponse']

 // グローバルミドルウェアで認証チェック実施

 // composables
 const { fetchRecords, fetchExercises, createRecord, updateRecord, deleteRecord, convertToCalendarData, convertToGroupedOptions } = useTraining()
 const toast = useToast()

 // 最新のトレーニング記録関連
 const latestRecord = ref<any>(null)
 const latestRecordLoading = ref(true)

 // チャート関連
 const chartLoading = ref(true)
 const selectedPeriod = ref<'this_week' | 'this_month' | 'past_7_days' | 'past_30_days' | 'custom'>('past_30_days')
 const weightChartData = ref<ChartData<'line'>>({
   labels: [],
   datasets: []
 })
-const weightChartOptions = ref<ChartOptions<'line'>>({
+
+const caloriesChartData = ref<ChartData<'bar'>>({
+  labels: [],
+  datasets: []
+})
+
+// 共通チャートオプション
+const baseChartOptions = {
   responsive: true,
   maintainAspectRatio: false,
   plugins: {
     title: {
       display: false
     },
     legend: {
-      position: 'top',
+      position: 'top' as const,
       labels: {
-        pointStyle: 'line',  // ← 線スタイルを選択
-        usePointStyle: true, // ← 点や線のスタイルを使う
+        pointStyle: 'line' as const,
+        usePointStyle: true,
       }
     }
   },
   layout: {
-      padding: {
-        top: -5,
-        bottom: 0,
-      }
-  },
+    padding: {
+      top: -5,
+      bottom: 0,
+    }
+  },
+  elements: {
+    point: {
+      radius: 3,
+      hoverRadius: 5
+    },
+    line: {
+      tension: 0.3
+    }
+  }
+}
+
+// 体重・体脂肪率推移チャートオプション
+const weightChartOptions = ref<ChartOptions<'line'>>({
+  ...baseChartOptions,
   scales: {
     x: {
       type: 'category',
       title: {
         display: true,
         text: '日付'
       }
     },
     y: {
       type: 'linear',
       display: true,
       position: 'left',
       title: {
         display: true,
         text: '体重 (kg)'
       },
       grid: {
         color: 'rgba(0, 0, 0, 0.1)'
       }
     },
     y1: {
       type: 'linear',
       display: true,
       position: 'right',
       title: {
         display: true,
         text: '体脂肪率 (%)'
       },
       grid: {
         drawOnChartArea: false
       }
     }
-  },
-  elements: {
-    point: {
-      radius: 3,
-      hoverRadius: 5
+  }
+})
+
+// 消費カロリー推移チャートオプション
+const caloriesChartOptions = ref<ChartOptions<'bar'>>({
+  ...baseChartOptions,
+  scales: {
+    x: {
+      type: 'category',
+      title: {
+        display: true,
+        text: '日付'
+      }
     },
-    line: {
-      tension: 0.3
+    y: {
+      type: 'linear',
+      beginAtZero: true,
+      title: {
+        display: true,
+        text: '消費カロリー (kcal)'
+      },
+      grid: {
+        color: 'rgba(0, 0, 0, 0.1)'
+      }
     }
   }
 })
Discussion