Open2
Juliaで散布図を書くためのメモ
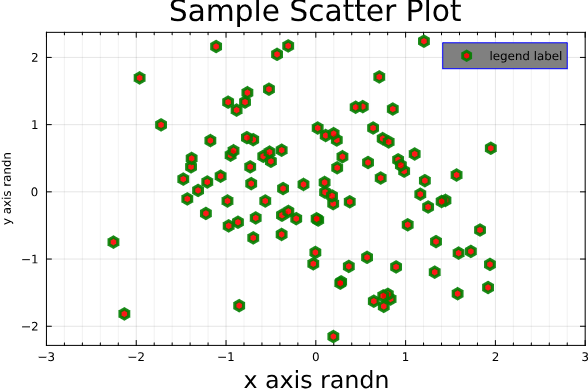
Plot.jl使う方法
using Plots
using Random
using Distributions

n_obs = 100
x = randn(n_obs)
y = randn(n_obs)

plot(
    x, y, st = :scatter,
    # set up for appearence
    title = "Sample Scatter Plot",
    label = "legend label",
    xlabel = "x axis randn",
    ylabel = "y axis randn",
    titlefontsize = 20,
    xguidefont = 16,
    yguidefont = 8,
    xlims = (-3, 3),
    xgrid = true,
    xminorgrid = true,
    framestyle = :box, # :semi, :origin, :zerolines, :grid :none
    # set up for maker
    mc  = :red,    # maker color
    ms  = 5,       # maker size
    msw = 4,       # maker stroke width
    msc = :green,  # markerstrokecolor
    markeralpha = 0.9,
    markerstrokealpha = 0.9,
    markershape = :hexagon, # :circle, :square, :hexagon
    # set up for legend
    legend = :topright,
    background_color_legend = :gray,
    foreground_color_legend = :blue
    )
StatsPlot.jlを使う方法
Plot.jlではDataFrame形式が使えないので、
d_raw = DataFrame(
    x = randn(n_obs),
    y = randn(n_obs)
)

@df d_raw scatter(
    :x,
    :y,
    title = "My awesome plot",
    xlabel = "x axis label",
    ylabel = "y axis label",
    m = (0.5, [:cross :hex :star7], 12),
    bg = RGB(0, 0.8, 0.2)
)