Open8
ggplot2基礎 / Tips
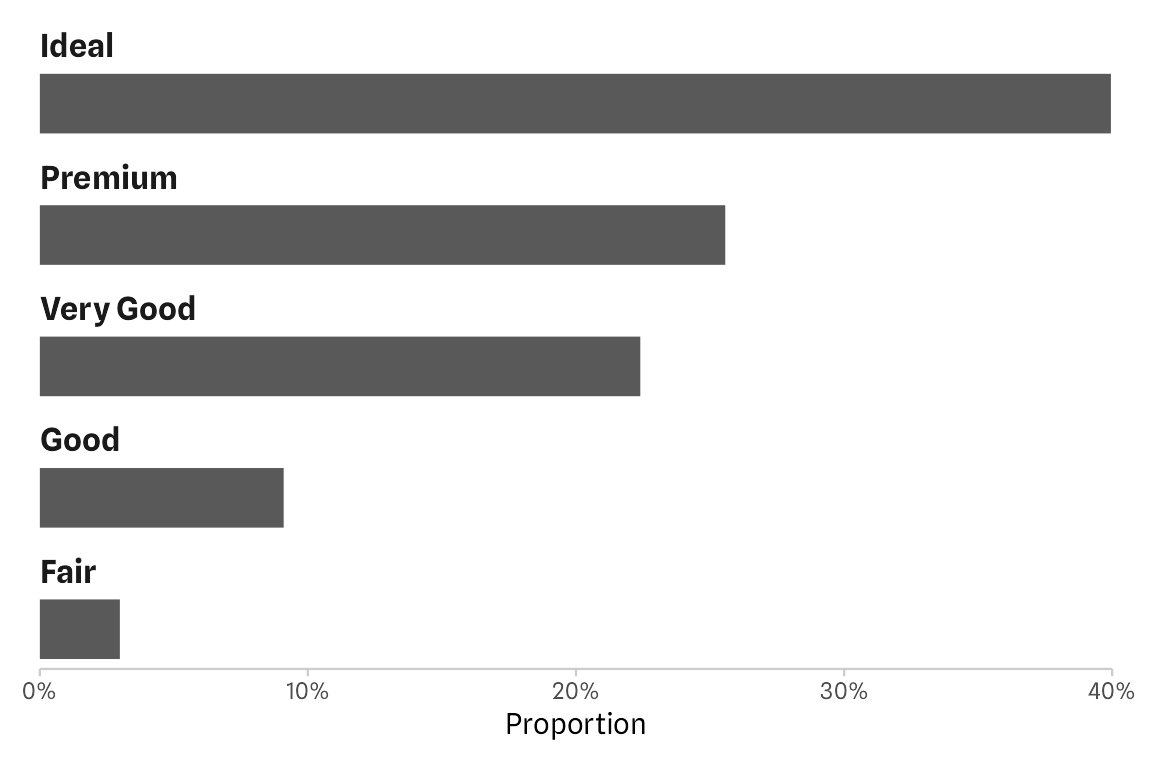
geom_bar()とgeom_col()の違い
-
geom_col()はstat_関数のデフォルトの設定がstat = "identity"となっているため、
棒グラフを書く上で、stat_関数による計算を行う必要がない場合にはgeom_col()を使う -
stat = "identity"が集計・計算を行わないと意味するように、
position = "identity"はただ、与えられた値をプロットするを意味する
参考文献
- データ分析のためのデータ可視化入門
-
reorder(1st, 2nd, na.rm = TRUE)とすると、2ndの引数の変数の平均値で並び替える -
na.rm = TRUEを入れることで、欠測を無視した上で、計算できる
ggplot2で連続値の凡例のカラーバーを区分分けする方法
library(ggplot2)

n <- 10
df <- data.frame(
  x = 1:n,
  y = rnorm(n),
  value = 1:n
)

ggplot(df, aes(x, y, color = value)) +
  geom_point(size = 3)
の場合、凡例は連続値用のカラーバーだが

scale_color_gradient()に対して、breaksで指定するとそこで区切った凡例ができる
ggplot(df, aes(x, y, color = value)) +
  geom_point(size = 3) +
  scale_color_gradient(breaks = 1:n) +
  guides(color = guide_legend())

breaks = c(2,4,6,8) のように指定すると、区切りを変えることもできる

クリーブランドドットプロットに関して
- 各カテゴリごとに1つのデータ点しか持たないカテゴリカル変数を要約する場合方法
- 由来:
ggplot2のy軸をおしゃれにする方法
  theme(strip.text = element_text(
    hjust = 0, margin = margin(1, 0, 1, 0),
    size = rel(1.1), face = "bold"
  ))
ggplot2 で**range()を考える
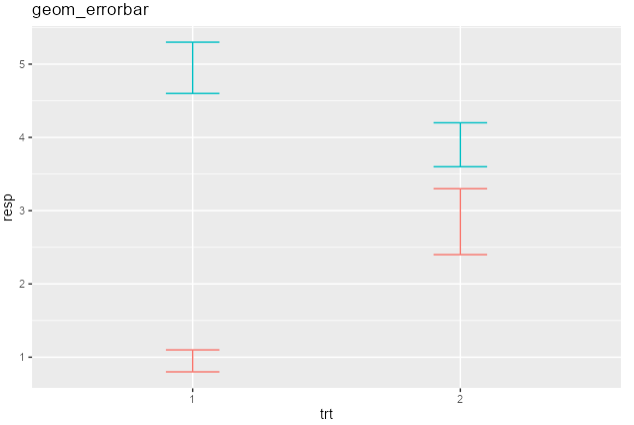
Vertical intervals: lines, crossbars & errorbars
df <- data.frame(
  trt = factor(c(1, 1, 2, 2)),
  resp = c(1, 5, 3, 4),
  group = factor(c(1, 2, 1, 2)),
  upper = c(1.1, 5.3, 3.3, 4.2),
  lower = c(0.8, 4.6, 2.4, 3.6)
)

p <- ggplot(df, aes(trt, resp, colour = group))
p + geom_linerange(aes(ymin = lower, ymax = upper)) +
  ggtitle("geom_linerange")
p + geom_pointrange(aes(ymin = lower, ymax = upper)) +
  ggtitle("geom_pointrange")
p + geom_crossbar(aes(ymin = lower, ymax = upper), width = 0.2) +
  ggtitle("geom_crossbar")
p + geom_errorbar(aes(ymin = lower, ymax = upper), width = 0.2) +
  ggtitle("geom_errorbar")


geom_boxplot()

