感染拡大モデルをシミュレーションする(個体ベースSIRモデル)
動機
PCやブラウザの性能も上がってきたのでWeb上でシミュレーションしてインタラクティブに感染拡大モデルを理解したい。
群行動モデル
個体の単純なルールから集団の複雑な動きが生まれるモデルが存在します。
Boids(鳥の群れ)、Game of Life(生命的パターン)、粘菌アルゴリズム(最適化)など。
これらのモデルは3つの特徴を共有しています:
1. 局所的なルール
各個体は周囲の状況だけを見て行動します。
- Boids: 近くの鳥だけを見る
- Game of Life: 隣接する8マスだけを見る
- 粘菌: 周囲の餌やフェロモンだけを感知
全体を把握する「司令塔」は存在しません。
2. シンプルなルール
個体の行動ルールは驚くほど単純です。
- Boids: たった3つのルール
- Game of Life: たった4つのルール
- 粘菌: 「餌に向かう」「効率化する」程度
複雑な判断や計算は不要です。
3. 創発(Emergence)
局所的でシンプルなルールの繰り返しから、予想外の複雑なパターンが集団レベルで出現します。
- Boids: 美しい群れの動き
- Game of Life: グライダーなどの「生命」
- 粘菌: 最適な輸送ネットワーク
これを「創発」と呼びます。
このようなモデルでSIRの感染拡大をシミュレーションしてみます。
SIRモデルとは
未感染者(S)、感染者(I)、免疫保持者(R)
と定義すると以下の関係が導かれます。
感染率係数をβ、回復率γと定義するとき、
未感染者は一定の確率で感染者となり、
感染者は一定の確率で免疫保持者になるということをここで示しています。
サンプル
動画
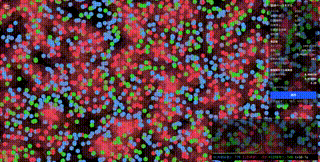
成果物
SIRモデルを群行動モデルとして扱う
ルール1:感染
微小時間
パラメータ:
-
\beta -
dt
📚 補足:ポアソン過程について
ポアソン過程とは
「ランダムな
ポアソン過程では、時間
これはポアソン分布の
を意味します。
つまり、感染確率は、
となります。
意味:
- 感染は確率的に発生
- 発生率
\beta - 時間が長いほど累積的に感染確率が上がる
具体例
1フレーム(dt = 1/60秒):
1秒間:
10秒間:
時間とともに感染確率が増加します。
ルール2:回復
微小時間
パラメータ:
-
\gamma -
dt
群モデルで解くコード例(抜粋)
HTML5のcanvasに描画することにしたので、
以下のようにまずエージェント=個体を定義します。
画面端が壁にならない(貫通して戻ってくる)ように周期境界条件も定義してあります。
//agent.ts
import type { SirState, Vector2 } from "../types/sir-types";

export class Agent {
    x: number;
    y: number;
    radius: number;
    color: string;
    velocity: Vector2;
    state: SirState;
    infectedAt: number | null;

    constructor(
        x: number,
        y: number,
        radius: number,
        color: string,
        velocity: Vector2,
    ) {
        this.x = x;
        this.y = y;
        this.radius = radius;
        this.color = color;
        this.velocity = velocity;
        this.state = "S";
        this.infectedAt = null;
    }

    draw(
        c: CanvasRenderingContext2D,
        colors: { S: string; I: string; R: string },
        infectionRadius?: number,
    ): void {
        // 感染者の場合、接触半径を薄く表示
        if (this.state === "I" && infectionRadius) {
            c.beginPath();
            c.arc(this.x, this.y, infectionRadius, 0, Math.PI * 2, false);
            c.strokeStyle = "rgba(255, 100, 100, 0.3)"; // やや濃い赤
            c.lineWidth = 1.5;
            c.stroke();
            c.fillStyle = "rgba(255, 100, 100, 0.1)"; // 薄い赤の塗りつぶし
            c.fill();
        }

        // エージェント本体を描画
        c.beginPath();
        c.arc(this.x, this.y, this.radius, 0, Math.PI * 2, false);
        c.fillStyle = colors[this.state] || this.color;
        c.fill();
    }

    update(
        canvas: HTMLCanvasElement,
        c: CanvasRenderingContext2D,
        colors: { S: string; I: string; R: string },
        infectionRadius?: number,
    ) {
        // 位置を更新
        this.x += this.velocity.x;
        this.y += this.velocity.y;

        // 周期境界条件(半径込み)
        if (this.x < -this.radius) this.x = canvas.width + this.radius; //左端
        if (this.x > canvas.width + this.radius) this.x = -this.radius; //右端
        if (this.y < -this.radius) this.y = canvas.height + this.radius; //上端
        if (this.y > canvas.height + this.radius) this.y = -this.radius; //下端

        // 描画
        this.draw(c, colors, infectionRadius);
    }
}
以下でアニメーションをループさせています。
//use-sir-animation.ts
import type { RefObject } from "react";
import { useEffect, useRef } from "react";
import { createAnimator } from "../logic/animator";
import { drawChart } from "../logic/draw-chart";
import { updatePopulation } from "../logic/update-population";
import { useSimStore } from "../state/sim-store";

export const useSirAnimation = ({
    mainCanvasRef,
    mainCtxRef,
    chartCanvasRef,
    chartCtxRef,
    metricsRef,
}: {
    mainCanvasRef: RefObject<HTMLCanvasElement | null>;
    mainCtxRef: RefObject<CanvasRenderingContext2D | null>;
    chartCanvasRef: RefObject<HTMLCanvasElement | null>;
    chartCtxRef: RefObject<CanvasRenderingContext2D | null>;
    metricsRef: RefObject<HTMLDivElement | null>;
}) => {
    const animatorRef = useRef<ReturnType<typeof createAnimator> | null>(null);

    useEffect(() => {
        const canvas = mainCanvasRef.current;
        const ctx = mainCtxRef.current;
        const chartCanvas = chartCanvasRef.current;
        const chartCtx = chartCtxRef.current;
        if (!canvas || !ctx) return;

        // 初期化
        const w = window.innerWidth;
        const h = window.innerHeight;
        canvas.width = w;
        canvas.height = h;
        const simStore = useSimStore.getState();
        simStore.reset({ width: w, height: h });

        const animator = createAnimator(
            /** ここがループする */
            (
                dt, /** 1フレームの時間(秒) */
                simTimeSec, /** シミュレーション時間(秒) */
            ) => {
                // 毎フレーム最新のstoreを取得
                const store = useSimStore.getState();
                const agents = store.agents;

                // クリア
                ctx.clearRect(0, 0, canvas.width, canvas.height);
                // エージェントを更新
                agents.forEach((agent) => {
                    agent.update(
                        canvas,
                        ctx,
                        store.config.colors,
                        store.config.infectionRadius,
                    );
                });
                // 更新
                if (simTimeSec > 0) {
                    const { s, i, r } = updatePopulation(
                        agents,
                        dt,
                        simTimeSec,
                        canvas,
                        ctx,
                        store.config,
                    );
                    store.setSimTimeSec(simTimeSec);
                    store.pushHistory({ t: simTimeSec, s, i, r });
                    if (chartCtx && chartCanvas) {
                        drawChart(
                            store.history,
                            chartCanvas,
                            chartCtx,
                            store.config,
                        );
                    }
                    // metricsRefにS/I/R情報を色分けして表示
                    if (metricsRef.current) {
                        const colors = store.config.colors;
                        metricsRef.current.innerHTML =
                            `<span style="color: ${colors.S}">S(未感染者): ${s}</span>  <span style="color: ${colors.I}">I(感染者): ${i}</span>  <span style="color: ${colors.R}">R(回復者): ${r}</span>  <span style="color: #ffffff">t=${
                                simTimeSec.toFixed(1)
                            }s</span>`;
                    }
                }
            },
        );

        /** createAnimatorの引数がループする */
        animator.start(); /** 最初のフレームを描画 */
        animatorRef.current = animator;
        return () =>
            animator.stop(); /** ループを停止(animatorRefが停止される) */
    }, [mainCanvasRef, mainCtxRef, chartCanvasRef, chartCtxRef, metricsRef]);

    return animatorRef;
};
個体=エージェントはランダムに動くので
接触半径に応じて感染、回復するように計算します。
こちらで先ほど説明した感染確率がでてきます。
//update-population.ts
import type { Agent } from "./agent";
import { countSirState } from "./draw-count";

export function updatePopulation(
    agents: Agent[],
    dt: number,
    simTimeSec: number,
    mainCanvas: HTMLCanvasElement,
    _mainCanvasCtx: CanvasRenderingContext2D,
    config: {
        infectionRadius: number;
        beta: number; // betaAgent: 接触あたりの感染率パラメータ
        gamma: number;
        colors: { S: string; I: string; R: string };
    },
) {
    const toInfect = new Set<number>();
    const toRecover = new Set<number>();

    const infectionRadius = config.infectionRadius;
    const r2 = infectionRadius * infectionRadius;

    // 計算式(ポアソン過程からの感染・回復確率):
    // P(感染) = 1 - exp(-β_agent × dt)
    // P(回復) = 1 - exp(-γ × dt)
    const betaAgent = config.beta;
    const pInfect = 1 - Math.exp(-betaAgent * dt);
    const pRecover = 1 - Math.exp(-config.gamma * dt);

    for (let i = 0; i < agents.length; i++) {
        if (agents?.[i]?.state !== "I") continue;
        const ix = agents?.[i]?.x;
        const iy = agents?.[i]?.y;
        // 回復判定
        if (Math.random() < pRecover) {
            toRecover.add(i); // 回復判定
        }
        for (let j = 0; j < agents.length; j++) {
            if (agents?.[j]?.state !== "S") continue;
            const jx = agents?.[j]?.x;
            const jy = agents?.[j]?.y;
            if (!ix || !iy || !jx || !jy) continue;
            const d2 = distanceSquaredTorus(
                ix,
                iy,
                jx,
                jy,
                mainCanvas.width,
                mainCanvas.height,
            );
            if (d2 <= r2) {
                if (Math.random() < pInfect) toInfect.add(j); // 感染判定
            }
        }
    }

    toInfect.forEach((idx: number) => {
        const agent = agents[idx];
        if (!agent) return;
        agent.state = "I";
        agent.infectedAt = simTimeSec;
    });

    toRecover.forEach((idx) => {
        const agent = agents[idx];
        if (!agent) return;
        agent.state = "R";
    });

    const { s, i, r } = countSirState(agents);
    // drawCount はHTML要素で表示するため、キャンバス上への描画は不要
    // drawCount(s, i, r, simTimeSec, mainCanvasCtx, config.colors);
    return { s, i, r };
}

// トーラス(周期境界)での距離二乗
function distanceSquaredTorus(
    ax: number,
    ay: number,
    bx: number,
    by: number,
    width: number,
    height: number,
): number {
    let dx = Math.abs(ax - bx);
    let dy = Math.abs(ay - by);
    dx = Math.min(dx, width - dx);
    dy = Math.min(dy, height - dy);
    return dx * dx + dy * dy;
}
詳しく知りたい場合はこちらをご確認ください。
Discussion