LangGraphで組んだLLMワークフローを可視化する
はじめに
LangGraphを使っているうちにLLMのワークフローが複雑化し、作成したグラフを可視化・保存したくなることがあります。
そこで、LangGraphで構築したグラフを図として描画する方法をご紹介します。
LangGraphとは
LangGraphは、LLMアプリケーション構築用のLangChain拡張ライブラリです。
LLMのそれぞれの推論をグラフに見立てて繋ぐことによって、各モデルのアクションや管理を行いやすくしてくれます。
以下は、RAGの拡張手法の1つであるCRAGの実装です(一部省略)。
from langgraph.graph import END, StateGraph

workflow = StateGraph(GraphState)

# Define the nodes
workflow.add_node("retrieve", retrieve)  # retrieve
workflow.add_node("grade_documents", grade_documents)  # grade documents
workflow.add_node("generate", generate)  # generatae
workflow.add_node("transform_query", transform_query)  # transform_query
workflow.add_node("web_search", web_search)  # web search

# Build graph
workflow.set_entry_point("retrieve")
workflow.add_edge("retrieve", "grade_documents")
workflow.add_conditional_edges(
    "grade_documents",
    decide_to_generate,
    {
        "transform_query": "transform_query",
        "generate": "generate",
    },
)
workflow.add_edge("transform_query", "web_search")
workflow.add_edge("web_search", "generate")
workflow.add_edge("generate", END)

# Compile
app = workflow.compile()
ノードはそれぞれが検索/推論の役割を担っており、エッジによって接続されています。add_conditional_edgesはノードの出力に対する条件分岐の設定です。
後はこのワークフローを実行すれば、エッジで接続されたノード同士の出力がつながり、エージェントのような動作を実現できます。
ここで、作成したワークフローは、以下のコードで描画できます(画像はSelf-RAG)。
from IPython.display import Image
Image(app.get_graph().draw_png())
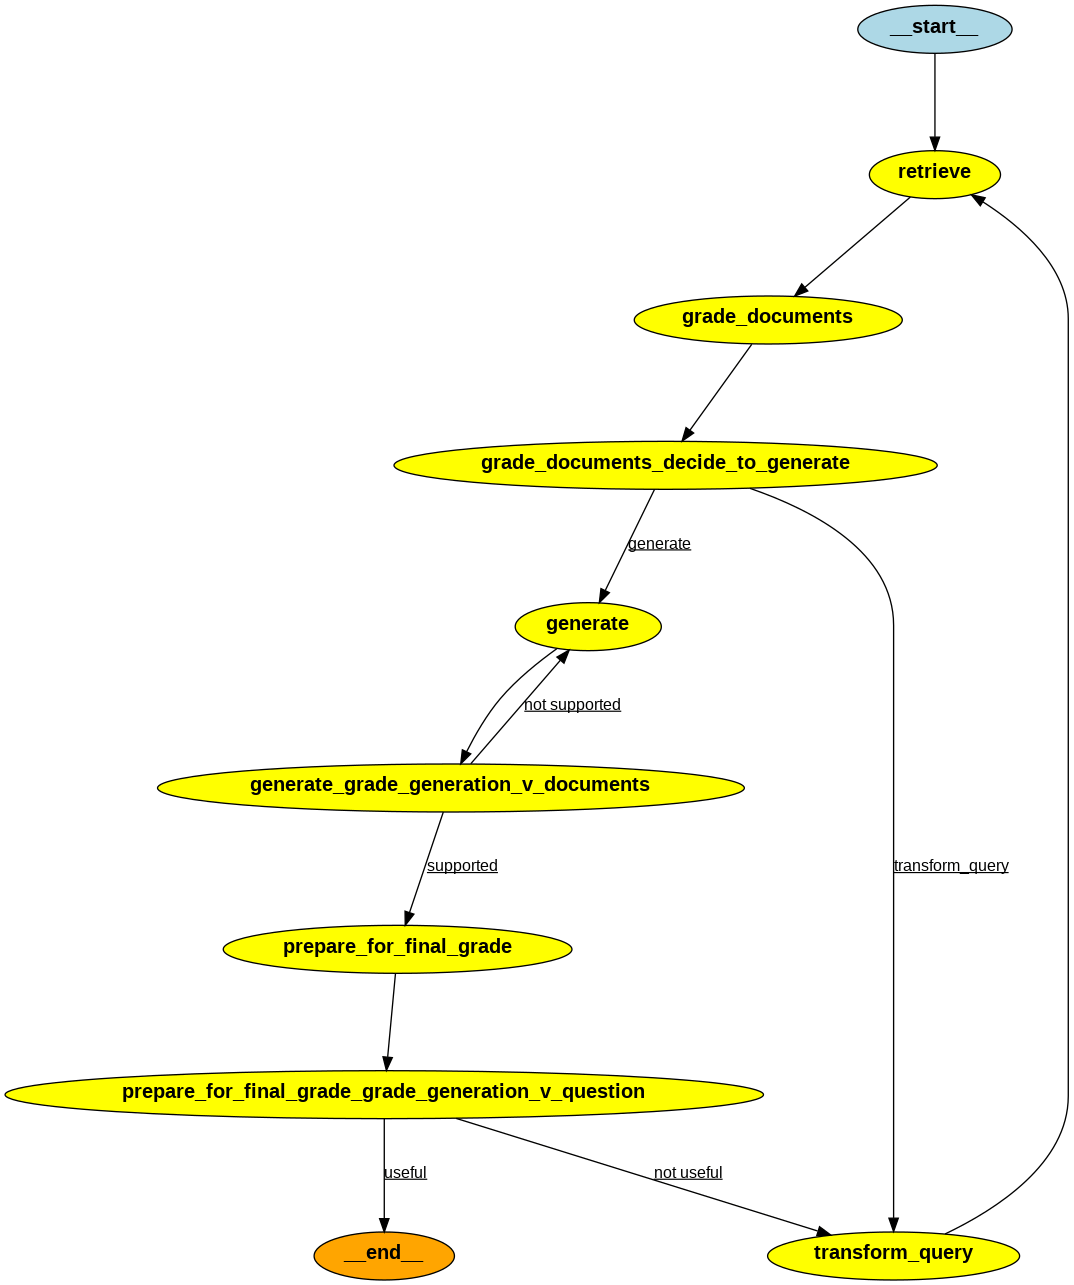
ワークフローが簡単に可視化できました。
これだけでも十分ありがたいのですが、1) 状態遷移表っぽくない、2) 長いワークフローはスクロールが必要になって見づらいという理由からスクラッチでも作成してみます(車輪の再発明)。
グラフの可視化
graphvizを使用して、CompiledGraphを可視化してみます。
import os
from graphviz import Digraph
from langgraph.graph.graph import CompiledGraph
from langgraph.graph import StateGraph
from IPython.display import display, Image

class LangGraphViewer():
  @classmethod
  def plot(
      self,
      graph: CompiledGraph,
      to_file="workflow_graph.png",
      rankdir:str="LR",
      entry_label:str="__start__",
      complexity:int=6,
    ):
    # Create a directed graph
    dot = Digraph()
    dot.attr(rankdir=rankdir)
    state_graph: StateGraph = graph.graph
    if state_graph.compiled:
      # Define nodes
      nodes = state_graph.nodes
      # Add nodes to the graph
      entry_point = app.graph.entry_point
      dot.node(entry_label, entry_label)
      for node, label in nodes.items():
          dot.node(node, label.get_name())

      # Define edges
      edges = state_graph.edges
      # Add edges to the graph
      dot.edge(entry_label, entry_point)
      for start, end in edges:
          dot.edge(start, end)

      # Add branch to the graph
      for entry_branch_node, branch_info in app.graph.branches.items():
        condition_str = branch_info[0].condition.__name__
        ends_dict = branch_info[0].ends
        dot.node(condition_str, "", shape="diamond")
        dot.edge(entry_branch_node, condition_str)
        with dot.subgraph(name=f"cluster_{entry_branch_node}") as c:
          c.attr(label=f"branch: {condition_str}")
          c.attr(rank="same")
          for choice_name, connected_node in ends_dict.items():
            c.edge(
                condition_str,
                connected_node,
                label=choice_name,
                minlen=str(complexity)
            )

      out_filename, extension = os.path.splitext(to_file)
      if not extension:
          extension = "png"
      else:
          extension = extension[1:]
      dot.render(out_filename, format=extension, cleanup=True)
      try:
          return display(Image(dot.pipe(format=extension)))
      except ImportError:
          pass
    else:
      raise ValueError("Graph is not compiled.")
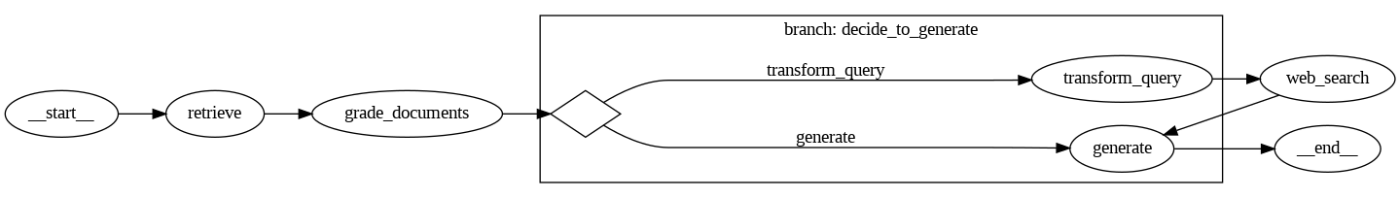
実行コード:
LangGraphViewer().plot(app)
可視化の結果は以下のようになりました。
どちらが良いかは好みの問題ですが、とりあえずスクロールは不要になりました。
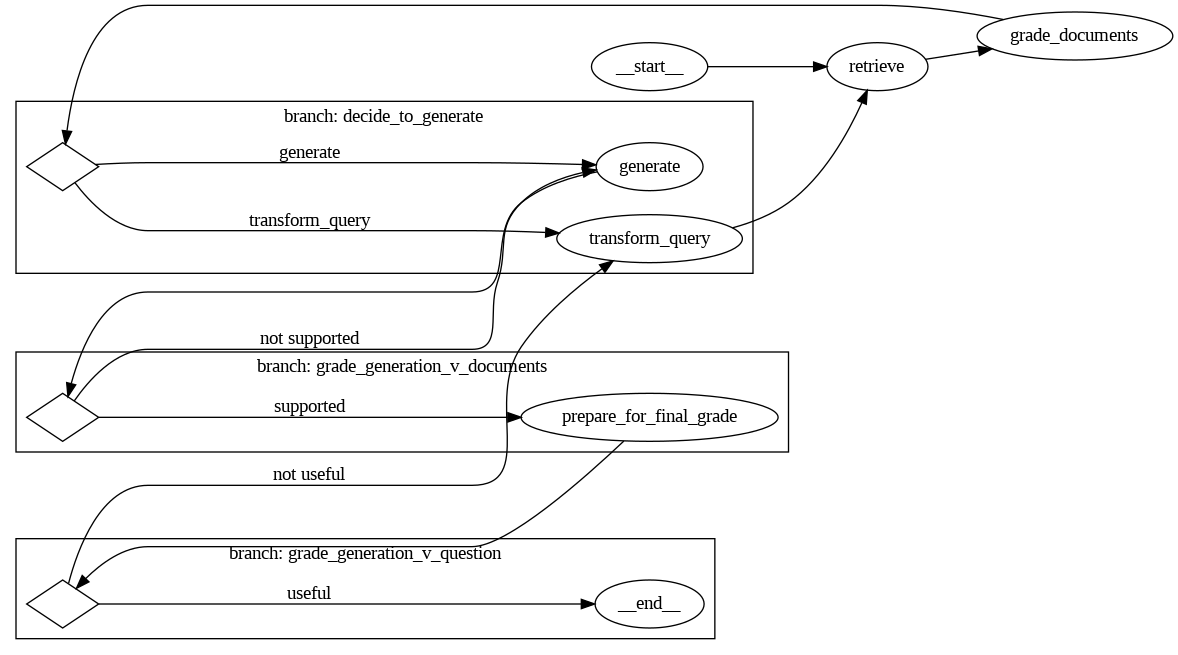
詰め込まれたエッジが複雑になって見づらくなってしまうのは、グラフの描画の難しいところです。
CRAG:
おわりに
LangGraphを触り始めて間もないですが、使いやすさと試行錯誤のしやすさに驚きました。グラフの可視化までちゃんと考慮してくれているのは流石ですね。
粗い部分もあるlangchainですが、便利なのは間違いないのでcore版のリリースを機に安定して使えるライブラリになってくれると嬉しいです。
それでは。
Discussion