Closed7
Polars の datetime Series を Matplotlib に渡すとタイムゾーンがおかしくなる?
バージョン確認
--------Version info---------
Polars:      0.17.13
Index type:  UInt32
Platform:    macOS-13.0-arm64-arm-64bit
Python:      3.11.2 (main, Apr  4 2023, 11:04:50) [Clang 14.0.0 (clang-1400.0.29.202)]

----Optional dependencies----
numpy:       1.24.3
pandas:      2.0.1
pyarrow:     12.0.0
connectorx:  <not installed>
deltalake:   <not installed>
fsspec:      <not installed>
matplotlib:  3.7.1
xlsx2csv:    <not installed>
xlsxwriter:  <not installed>
適当に時系列データの DataFrame を作成
df = pl.DataFrame({
    "timestamp": [datetime(2023, 5, 1, h, 0, 0) for h in range(24)],
    "x": [np.random.randn() for _ in range(24)]
})
print(df.head())
┌─────────────────────┬───────────┐
│ timestamp           ┆ x         │
│ ---                 ┆ ---       │
│ datetime[μs]        ┆ f64       │
╞═════════════════════╪═══════════╡
│ 2023-05-01 00:00:00 ┆ -1.540741 │
│ 2023-05-01 01:00:00 ┆ 0.129755  │
│ 2023-05-01 02:00:00 ┆ 0.170982  │
│ 2023-05-01 03:00:00 ┆ 2.257728  │
│ 2023-05-01 04:00:00 ┆ 2.551089  │
└─────────────────────┴───────────┘
https://github.com/pola-rs/polars/issues/6767 の提案で、タイムゾーンの処理用メソッドがリネーム
- with_time_zone → convert_time_zone
- cast_time_zone → replace_time_zone
convert_time_zone は、UTC の時刻は保ったまま、指定のタイムゾーンの日時に変換する
例:2023-05-01T10:00+00:00 → 2023-05-01T19:00+09:00
一方、replace_time_zone は、タイムゾーンを設定するメソッド。 UTC から見ると、変換後はタイムゾーンの時差分だけ時刻が変化する。
例:2023-05-01T10:00+00:00 → 2023-05-01T10:00+09:00 (2023-05-01T01:00+00:00)
df = df.with_columns([
    pl.col("timestamp")
    .dt.replace_time_zone("UTC")
    .alias("replace_timestamp_utc"),
    pl.col("timestamp")
    .dt.replace_time_zone("Asia/Tokyo")
    .alias("replace_timestamp_jst"),
]).with_columns(
    pl.col("replace_timestamp_utc")
    .dt.convert_time_zone("Asia/Tokyo")
    .alias("convert_timestamp_jst")
)

print(df.head())
┌──────────────┬───────────┬───────────────────────┬───────────────────────┬───────────────────────┐
│ timestamp    ┆ x         ┆ replace_timestamp_utc ┆ replace_timestamp_jst ┆ convert_timestamp_jst │
│ ---          ┆ ---       ┆ ---                   ┆ ---                   ┆ ---                   │
│ datetime[μs] ┆ f64       ┆ datetime[μs, UTC]     ┆ datetime[μs,          ┆ datetime[μs,          │
│              ┆           ┆                       ┆ Asia/Tokyo]           ┆ Asia/Tokyo]           │
╞══════════════╪═══════════╪═══════════════════════╪═══════════════════════╪═══════════════════════╡
│ 2023-05-01   ┆ -1.540741 ┆ 2023-05-01 00:00:00   ┆ 2023-05-01 00:00:00   ┆ 2023-05-01 09:00:00   │
│ 00:00:00     ┆           ┆ UTC                   ┆ JST                   ┆ JST                   │
│ 2023-05-01   ┆ 0.129755  ┆ 2023-05-01 01:00:00   ┆ 2023-05-01 01:00:00   ┆ 2023-05-01 10:00:00   │
│ 01:00:00     ┆           ┆ UTC                   ┆ JST                   ┆ JST                   │
│ 2023-05-01   ┆ 0.170982  ┆ 2023-05-01 02:00:00   ┆ 2023-05-01 02:00:00   ┆ 2023-05-01 11:00:00   │
│ 02:00:00     ┆           ┆ UTC                   ┆ JST                   ┆ JST                   │
│ 2023-05-01   ┆ 2.257728  ┆ 2023-05-01 03:00:00   ┆ 2023-05-01 03:00:00   ┆ 2023-05-01 12:00:00   │
│ 03:00:00     ┆           ┆ UTC                   ┆ JST                   ┆ JST                   │
│ 2023-05-01   ┆ 2.551089  ┆ 2023-05-01 04:00:00   ┆ 2023-05-01 04:00:00   ┆ 2023-05-01 13:00:00   │
│ 04:00:00     ┆           ┆ UTC                   ┆ JST                   ┆ JST                   │
└──────────────┴───────────┴───────────────────────┴───────────────────────┴───────────────────────┘
print する限りは、想定通りのタイムゾーンと日時になっているように見える。
グラフを作ってみる
fig = plt.figure()
ax1 = fig.add_subplot(2, 2, 1)
ax2 = fig.add_subplot(2, 2, 2)
ax3 = fig.add_subplot(2, 2, 3)
ax4 = fig.add_subplot(2, 2, 4)

ax1.plot(df["timestamp"], df["x"])
ax1.set_title("TZ = None")

ax2.plot(df["replace_timestamp_utc"], df["x"])
ax2.set_title("replace_time_zone (TZ = UTC)")

ax3.plot(df["replace_timestamp_jst"], df["x"])
ax3.set_title("replace_time_zone (TZ = JST)")

ax4.plot(df["convert_timestamp_jst"], df["x"])
ax4.set_title("convert_time_zone (TZ = JST)")

ax1.xaxis.set_tick_params(rotation=30)
ax2.xaxis.set_tick_params(rotation=30)
ax3.xaxis.set_tick_params(rotation=30)
ax4.xaxis.set_tick_params(rotation=30)
plt.tight_layout()
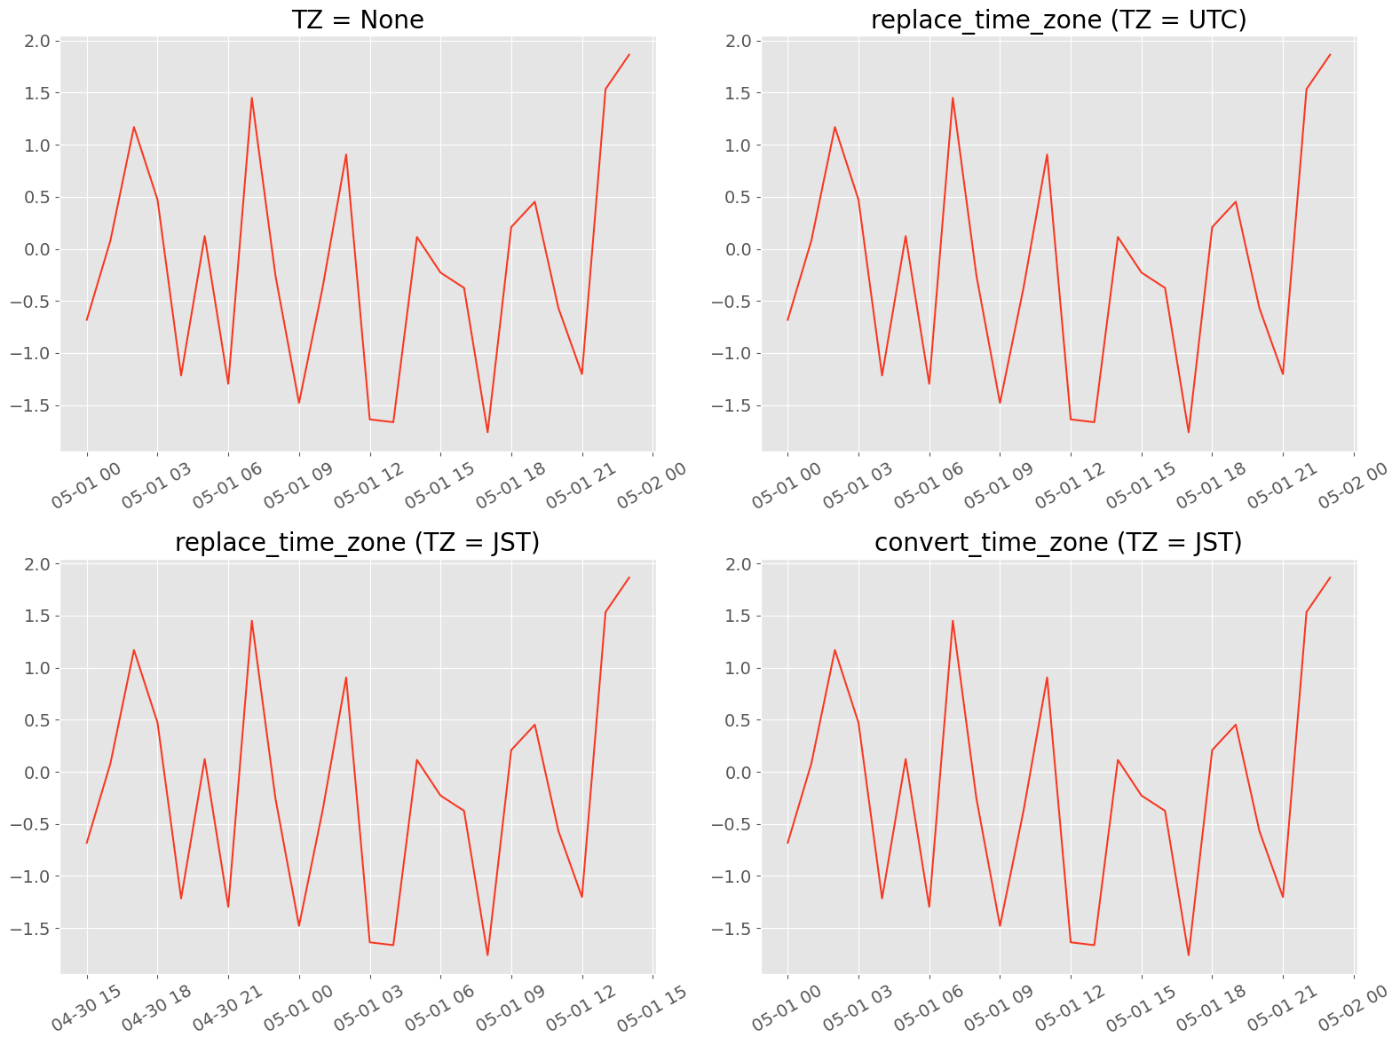
X 軸のラベルの値が、JST に変換したものも含め UTC の時刻で表示されてしまっている
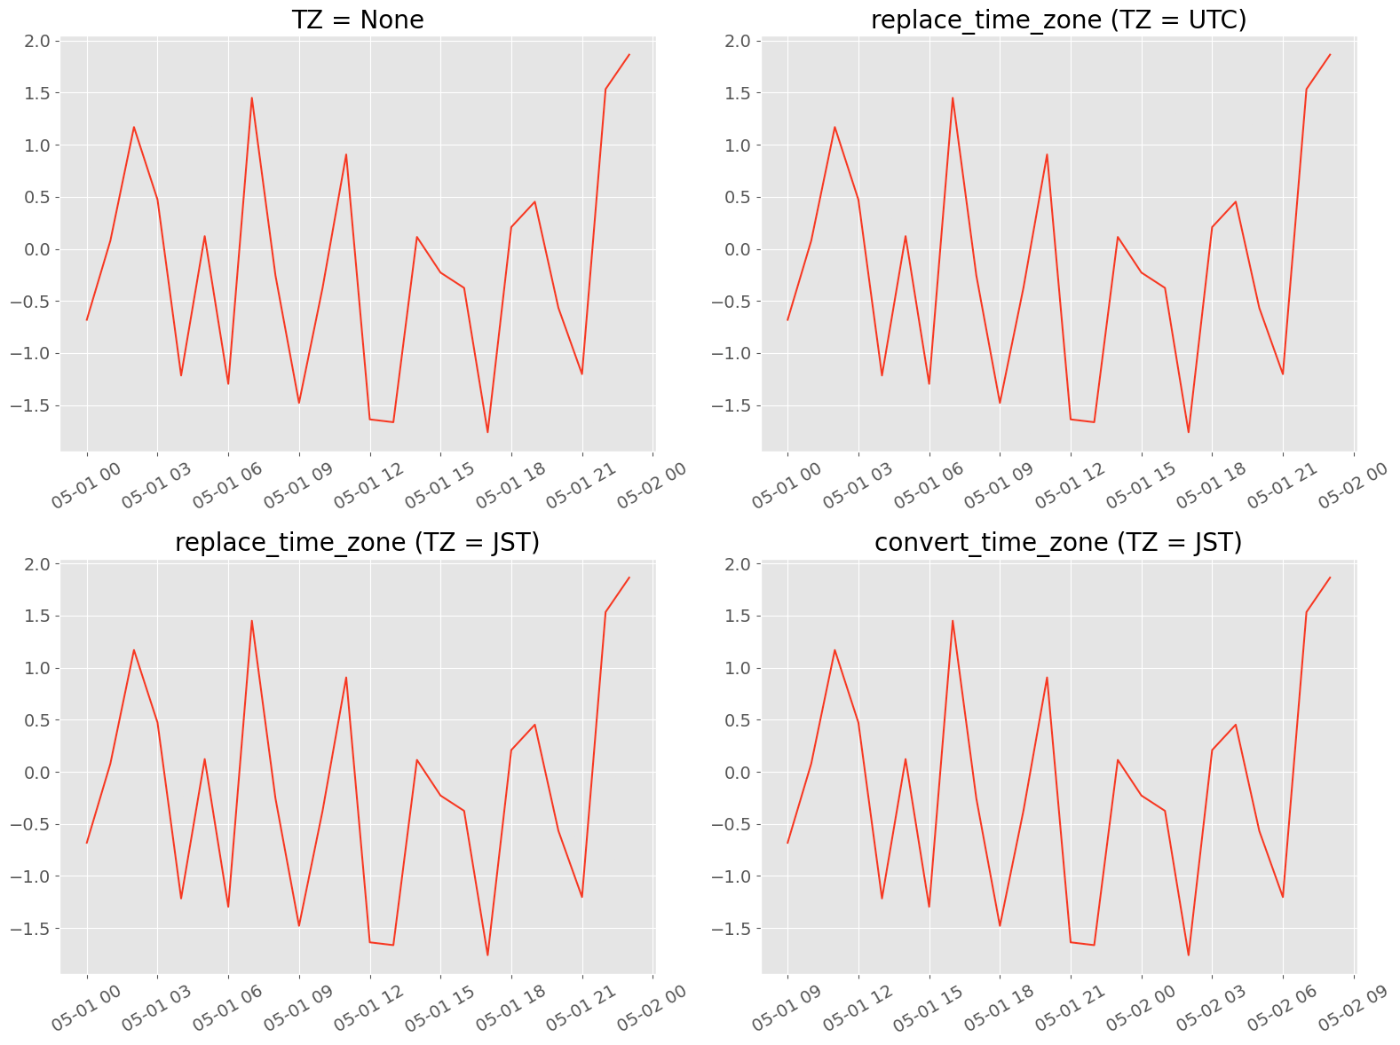
現状の解決方法
Polars の Series を、to_list メソッドを使ってPython リストに変換してから plot に渡してあげれば JST で表示される
fig = plt.figure()
ax1 = fig.add_subplot(2, 2, 1)
ax2 = fig.add_subplot(2, 2, 2)
ax3 = fig.add_subplot(2, 2, 3)
ax4 = fig.add_subplot(2, 2, 4)

ax1.plot(df["timestamp"].to_list(), df["x"])
ax1.set_title("TZ = None")

ax2.plot(df["replace_timestamp_utc"].to_list(), df["x"])
ax2.set_title("replace_time_zone (TZ = UTC)")

ax3.plot(df["replace_timestamp_jst"].to_list(), df["x"])
ax3.set_title("replace_time_zone (TZ = JST)")

ax4.plot(df["convert_timestamp_jst"].to_list(), df["x"])
ax4.set_title("convert_time_zone (TZ = JST)")

ax1.xaxis.set_tick_params(rotation=30)
ax2.xaxis.set_tick_params(rotation=30)
ax3.xaxis.set_tick_params(rotation=30)
ax4.xaxis.set_tick_params(rotation=30)
plt.tight_layout()
datetime Series のタイムゾーンまわりの話題はちょこちょこあるっぽい
このスクラップは2023/08/16にクローズされました