GitHub Actionsのstepの実行時間を簡易的に集計してグラフにする
過去のGitHub Actionsのbuild時間を取得して集計してグラフにする - xuwei-k's blog
これをやってみる
公開リポジトリでまともにjobを継続的に回しているものがなくて後悔
記事を参考にしてやってみるとできた
#!/bin/bash

set -eu

rm -rf run_ids.txt

# loopする数は各自調整してください
for i in $(seq 1 10)
do
  echo "$i"
  # pull reqなど含めて全部集計したいならば、branch指定は無しだったり、代わりに他のfilterでもいいが
  # その場合 "成功したjob" などでどこかでfilterしないとうまく出なそう
  gh api "repos/uta8a/blog/actions/runs?branch=main&per_page=100&page=${i}" > runs.json
  jq '.workflow_runs.[] | select(.path == ".github/workflows/ci.yaml") | .id' < runs.json >> run_ids.txt
done

rm -rf times.txt

while read -r p; do
  if [ -e "${p}.json" ]
  then
    # 途中からリトライする場合など考えて、ファイル存在してたらAPI呼び出しスキップ
    echo "${p}.json exists"
  else
    echo "${p}.json not exists"
    gh api "repos/uta8a/blog/actions/runs/${p}/jobs" > "${p}.json"
  fi
  jq '.jobs.[] | select(.name == "Publish to Cloudflare Pages") | .steps.[] | select(.name | contains("Build")) | (.completed_at | fromdate) - (.started_at | fromdate)' < "${p}.json" >> times.txt
done < run_ids.txt

# 数値の一覧欲しいならここまで

# ここからGitHubで直接みれる方式にformat

# このままだと順番逆なので
tail -r times.txt > times_reversed.txt

cat << EOM > chart.md
\`\`\`mermaid

xychart-beta
EOM

printf %s "  line [" >> chart.md

while read -r p; do
  # skipされてると0が混ざる場合があるので除外
  if [ "$p" != "0" ]
  then
    printf %s "$p" >> chart.md
    printf %s "," >> chart.md
  fi
done < times_reversed.txt

# loop内で付与した余計な最後の "," を削除
truncate -s-1 chart.md

echo "]" >> chart.md
echo '```' >> chart.md
実行結果
```mermaid

xychart-beta
  line [155,3,18,19,19,19,20,184,4,4,5,181,3,8,8,6,50,2,54,55,54,7,2,3,46,5,5,5,44]
```
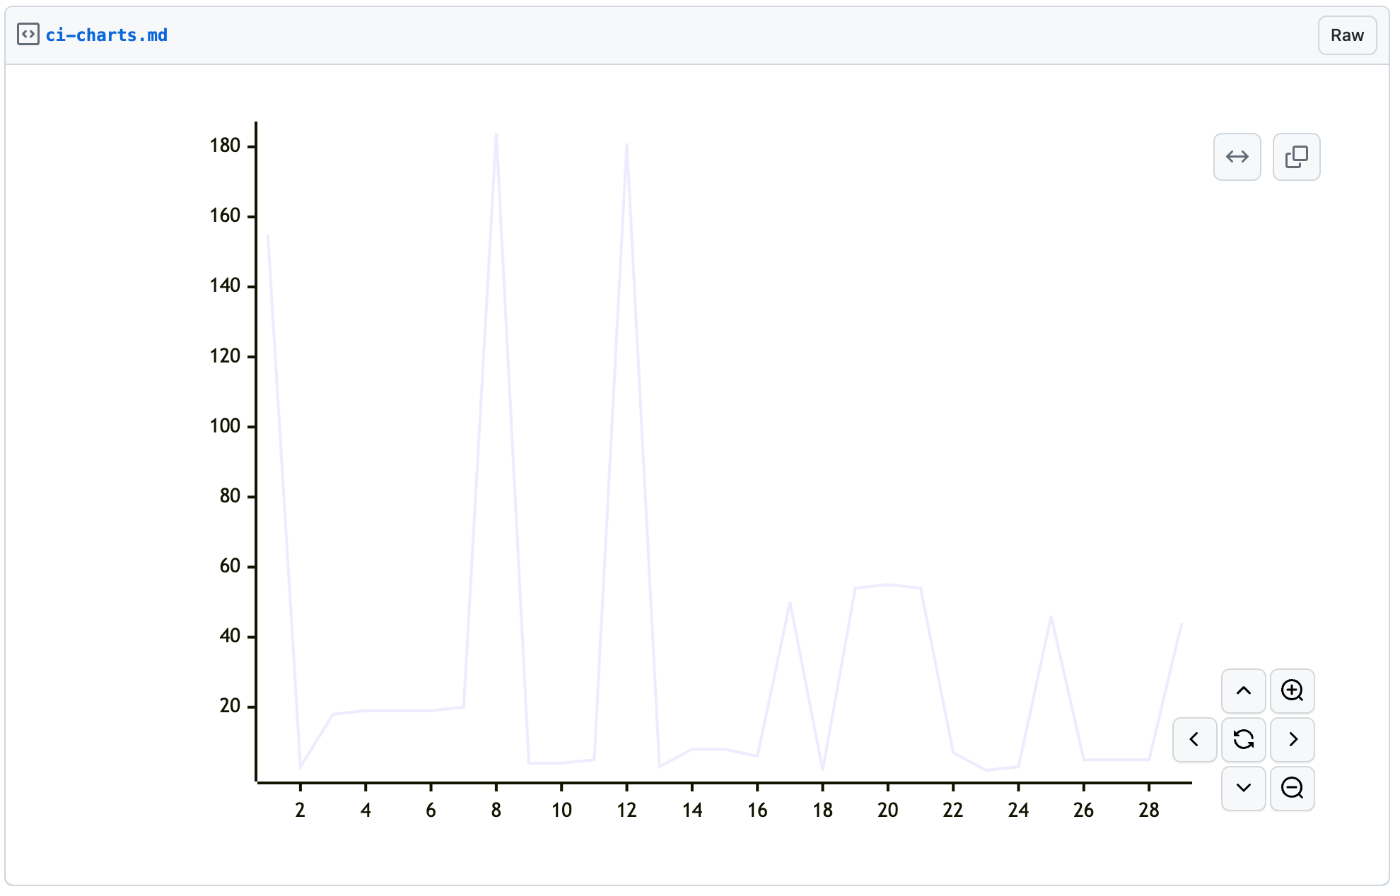
横軸をstartの時間にしてみたいな
jqのfromdateの単位なので、秒数。なのでグラフの単位は秒。maxビルドに3分かかっているってことか。
The fromdateiso8601 builtin parses datetimes in the ISO 8601 format to a number of seconds since the Unix epoch (1970-01-01T00:00:00Z). The todateiso8601 builtin does the inverse.
The fromdate builtin parses datetime strings. Currently fromdate only supports ISO 8601 datetime strings, but in the future it will attempt to parse datetime strings in more formats.
ref. https://jqlang.github.io/jq/manual/
mermaidのxychart-betaのexampleをみると、x-axis, y-axisを指定すればいけそう
x-axisにstartの時刻、y-axisにstepの実行時間を指定するイメージ
Unixtimeでやってみたら等間隔になってしまった。難しい...
```mermaid

xychart-beta
  x-axis "step started_at" 1703851683 --> 1717451426
  x-axis [  1703851683, 1703851931, 1703914558,  1703917751, 1703937559, 1704021212,  1704023168, 1705231278, 1705463599,  1705844226, 1705926843, 1706832207,  1706832661, 1706941592, 1707008263,  1707034056, 1707037197, 1707037636,  1710295013, 1712846736, 1714285034,  1714370177, 1714371804, 1714371951,  1715346849, 1715861900, 1716103066,  1716103323, 1717451426]
  line [155,3,18,19,19,19,20,184,4,4,5,181,3,8,8,6,50,2,54,55,54,7,2,3,46,5,5,5,44]
```
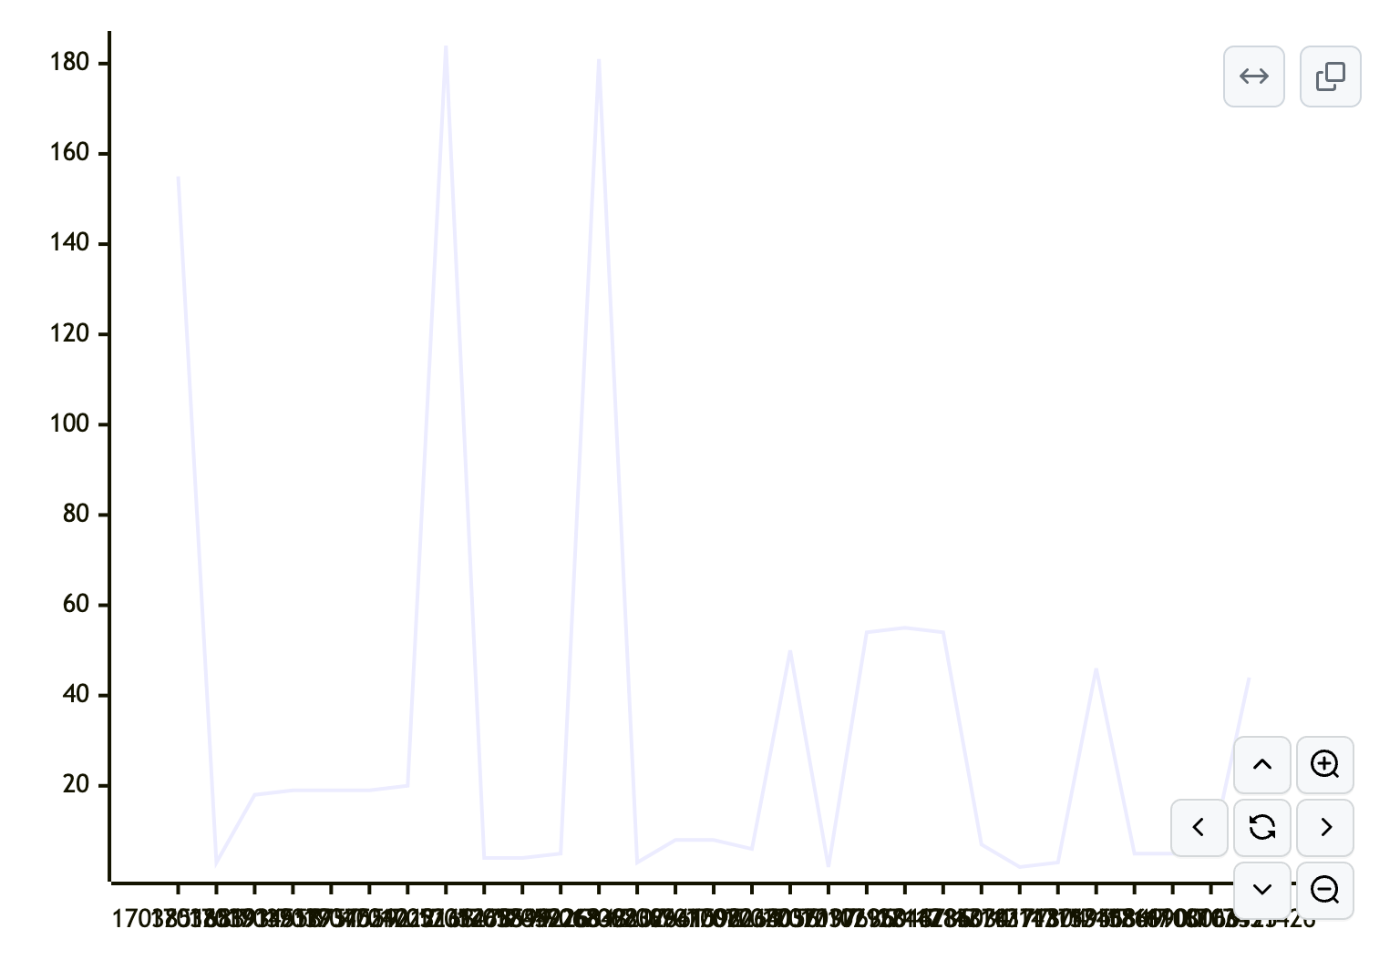
"mermaid xycharts both dynamic" とか "mermaid xy both variable", "mermaid charts not equal width" みたいな単語で検索したけどヒットしなかったので諦め
得られたもの
- ghコマンドとjqコマンドで可視化がさっくりできて面白い
- jqコマンドは奥が深い、色々知れば便利にサッとデータを整形できそう