CDN版Vue.jsとオープンデータでお手軽マッシュアップ
JavaScriptでWebアプリを開発する場合、最近は Node.js や Deno、各フレームワーク毎にCLIツール(create-react-app、Vue CLI、Vite、Angular CLI)を使って環境構築することが一般的かと思います。
少し複雑なWebアプリを作るには必須ですが、本当にちょっとしたWebアプリを作りたい場合には面倒だったりします。
そこで、これらの環境構築が必要のないWebアプリを作ってみることにしました。幸い、Vue.jsや、UIフレームワークのVuetifyなどは従来通りscriptタグでファイルをロードする形でも動いてくれるようなので、CDNからVue.jsを呼び出す形でいくつか簡単なWebアプリを作ってみました。これにより、HTMLファイルをブラウザで直接開くことでアプリが動作します。
そして、現在いろいろと公開されている自由に利用できるオープンデータをWebアプリ内で利用してみました。ここでは、それらを紹介したいと思います。
それぞれ以下のような特徴があります。
- Node.js を使用しない ブラウザで直接動く Vue.jsアプリ
- HTMLファイル1つで完結する
- オープンデータとして提供される様々な Web API やJSON/CSVファイルをマッシュアップ
タイプ別に以下のオープンデータを利用しています。
- REST API
- GraphQL
- SPARQL
- JSON
- CSV
紹介するアプリのコードは全て GitHub に、一部を除き Codepen にもアップロードしています。
マッシュアップアプリ
今回、シンプルテーブル、データテーブル、地図、画像ビューアの4種類のWebアプリを作りました。
後ほど、各Web API やデータファイルでの使い方を解説しますが、ここではそれぞれのアプリのコードを紹介します。
シンプルテーブル
Web APIやファイルを直接ロードして単純な表として表示できます。
Vuetifyを使っているので、最初からスタイルも整っています。
以下は、厚生労働省が公開するオープンデータからPCR検査の実施件数を表示しています。
<!DOCTYPE html>
<html>
<head>
  <title>サンプルアプリ(シンプルテーブル/CSV)</title>
  <link href="https://fonts.googleapis.com/css?family=Roboto:100,300,400,500,700,900" rel="stylesheet">
  <link href="https://cdn.jsdelivr.net/npm/@mdi/font@4.x/css/materialdesignicons.min.css" rel="stylesheet">
  <link href="https://cdn.jsdelivr.net/npm/vuetify@2.x/dist/vuetify.min.css" rel="stylesheet">
  <meta name="viewport" content="width=device-width, initial-scale=1, maximum-scale=1, user-scalable=no, minimal-ui">
</head>
<body>
  <div id="app">
    <v-app>
      <v-main>
        <v-container class="pt-10 pb-5">
          <h1 class="text-center py-5">サンプルアプリ(シンプルテーブル/CSV)</h1>
          <v-divider></v-divider>
          <v-simple-table>
            <template v-slot:default>
              <thead>
                <tr>
                  <th>日付</th>
                  <th>国立感染症研究所</th>
                  <th>検疫所</th>
                  <th>地方衛生研究所・保健所</th>
                  <th>民間検査会社</th>
                  <th>大学等</th>
                  <th>医療機関</th>
                </tr>
              </thead>
              <tbody>
                <tr v-for="item in items"
                  :key="item['日付']">
                  <td>{{ item['日付'] }}</td>
                  <td>{{ item['国立感染症研究所'] }}</td>
                  <td>{{ item['検疫所'] }}</td>
                  <td>{{ item['地方衛生研究所・保健所'] }}</td>
                  <td>{{ item['民間検査会社'] }}</td>
                  <td>{{ item['大学等'] }}</td>
                  <td>{{ item['医療機関'] }}</td>
                </tr>
              </tbody>
            </template>
          </v-simple-table>
        </v-container>
      </v-main>
    </v-app>
    <v-overlay :value="isLoading">
      <v-progress-circular indeterminate size="64"></v-progress-circular>
    </v-overlay>
  </div>
  <script src="https://cdn.jsdelivr.net/npm/vue@2.x/dist/vue.js"></script>
  <script src="https://cdn.jsdelivr.net/npm/vuetify@2.x/dist/vuetify.js"></script>
  <script src="https://cdn.jsdelivr.net/npm/axios/dist/axios.min.js"></script>
  <script src="https://unpkg.com/papaparse@latest/papaparse.min.js"></script>
  <script>
    new Vue({
      el: '#app',
      vuetify: new Vuetify(),
      data() {
        return {
          items: [],
          isLoading: false,
        }
      },
      mounted() {
        var self = this;
        self.isLoading = true;
        axios.get(
          'https://uedayou.github.io/vue-cdn-mashup-sample-apps/vue2/csv/pcr_case_daily.csv'
        )
        .then(function(response) {
          const parsed = Papa.parse(
            response.data,
            {
              header: true,
              skipEmptyLines: true,
            });
          self.items = parsed.data;
        })
        .catch(function(error) {
          console.log(error);
        })
        .finally(function() {
          self.isLoading = false;
        });
      }
    })
  </script>
</body>
</html>
データテーブル
Web APIやファイルを直接ロードして表として表示しますが、ソートや検索が可能で上記よりも多機能になっています。
シンプルテーブルと同じく、Vuetifyを使っています。
図書館施設データポータルから東京都の公立図書館のJSONデータを表示しています。
<!DOCTYPE html>
<html>
<head>
  <title>サンプルアプリ(データテーブル/JSON)</title>
  <link href="https://fonts.googleapis.com/css?family=Roboto:100,300,400,500,700,900" rel="stylesheet">
  <link href="https://cdn.jsdelivr.net/npm/@mdi/font@4.x/css/materialdesignicons.min.css" rel="stylesheet">
  <link href="https://cdn.jsdelivr.net/npm/vuetify@2.x/dist/vuetify.min.css" rel="stylesheet">
  <meta name="viewport" content="width=device-width, initial-scale=1, maximum-scale=1, user-scalable=no, minimal-ui">
</head>
<body>
  <div id="app">
    <v-app>
      <v-main>
        <v-container class="pt-10 pb-5">
          <h1 class="text-center py-5">サンプルアプリ(データテーブル/JSON)</h1>
          <v-divider></v-divider>
          <v-card>
            <v-card-title>
              <v-text-field
                v-model="search"
                append-icon="mdi-magnify"
                label="Search"
                single-line
                hide-details
              ></v-text-field>
            </v-card-title>
            <v-data-table
              :headers="headers"
              :items="items"
              :search="search"
            ></v-data-table>
          </v-card>
        </v-container>
      </v-main>
    </v-app>
    <v-overlay :value="isLoading">
      <v-progress-circular indeterminate size="64"></v-progress-circular>
    </v-overlay>
  </div>
  <script src="https://cdn.jsdelivr.net/npm/vue@2.x/dist/vue.js"></script>
  <script src="https://cdn.jsdelivr.net/npm/vuetify@2.x/dist/vuetify.js"></script>
  <script src="https://cdn.jsdelivr.net/npm/axios/dist/axios.min.js"></script>
  <script>
    new Vue({
      el: '#app',
      vuetify: new Vuetify(),
      data() {
        return {
          search: '',
          headers: [],
          items: [],
          isLoading: false,
        }
      },
      mounted() {
        var self = this;
        self.isLoading = true;
        axios.get(
          'https://uedayou.net/ld/library/20210505/東京都/公共図書館.json'
        )
        .then(function(response) {
          var items = [];
          Object.keys(response.data).forEach(function(key) {
            var data = response.data[key];
            if (!data['http://www.w3.org/2003/01/geo/wgs84_pos#lat']) return;
            items.push({
              label: data['http://www.w3.org/2000/01/rdf-schema#label'][0].value,
              url: key,
              id: data['http://purl.org/dc/terms/identifier'][0].value,
              pref: data['http://schema.org/addressRegion'][0].value,
              city: data['http://schema.org/addressLocality'][0].value,
              lat: data['http://www.w3.org/2003/01/geo/wgs84_pos#lat'][0].value,
              long: data['http://www.w3.org/2003/01/geo/wgs84_pos#long'][0].value
            });
          });
          self.setData(items);
        })
        .catch(function(error) {
          console.log(error);
        })
        .finally(function() {
          self.isLoading = false;
        });
      },
      methods: {
        setData: function(data) {
          const _headers = [];
          for (const d of data) {
            const item = {};
            for (const key in d) {
              item[key] = d[key];
              _headers.push(key);
            }
            this.items.push(item);
          }
          for (const h of [...new Set(_headers)]) {
            this.headers.push({
              text: h, value: h,
            });
          }
        }
      }
    })
  </script>
</body>
</html>
地図
Vue2Leaflet で地図を表示して、その上に緯度経度付きオープンデータをマーカーとして表示します。
東京都品川区が公開するトイレデータの表示例です。
<!DOCTYPE html>
<html>
<head>
  <title>サンプルアプリ(地図/CSV)</title>
  <link rel="stylesheet" href="https://unpkg.com/leaflet/dist/leaflet.css" />
</head>
<body>
  <div id="app">
    <l-map :bounds="bounds" style="position: absolute; top: 0;right: 0; bottom: 0; left: 0;">
      <l-tile-layer :url="tileurl"></l-tile-layer>
      <l-marker v-for="item in items"
        :lat-lng="{lat: item['緯度'], lon: item['経度'] }" >
        <l-popup>
          {{ item['施設名'] }}
        </l-popup>
      </l-marker>
    </l-map>
  </div>
  <script src="https://cdn.jsdelivr.net/npm/vue@2.x/dist/vue.js"></script>
  <script src="https://unpkg.com/leaflet/dist/leaflet.js"></script>
  <script src="https://unpkg.com/vue2-leaflet"></script>
  <script src="https://cdn.jsdelivr.net/npm/axios/dist/axios.min.js"></script>
  <script src="https://unpkg.com/papaparse@latest/papaparse.min.js"></script>
  <script type="text/javascript">
    Vue.component('l-map', window.Vue2Leaflet.LMap);
    Vue.component('l-tile-layer', window.Vue2Leaflet.LTileLayer);
    Vue.component('l-marker', window.Vue2Leaflet.LMarker);
    Vue.component('l-popup', window.Vue2Leaflet.LPopup);
    new Vue({
      el: '#app',
      data() {
        return {
          items: [],
          tileurl: 'https://{s}.tile.openstreetmap.org/{z}/{x}/{y}.png',
          bounds: null,
        }
      },
      mounted() {
        var self = this;
        axios.get(
          'https://www.city.shinagawa.tokyo.jp/ct/other000081600/toilet.csv',
          {
            responseType: 'arraybuffer',
            transformResponse: function(data) {
              // shift_jis to utf8
              return new TextDecoder("sjis").decode(data);
            }
          }
        ).then(function(response) {
          const parsed = Papa.parse(
            response.data,
            {
              header: true,
              skipEmptyLines: true,
            });
          self.items = parsed.data;
          self.items.forEach( function(item) {
            self.setBounds(+item['緯度'], +item['経度']);
          });
        }).catch(function(error) {
          console.log(error);
        });
      },
      methods: {
        setBounds: function(lat, long) {
          if (!this.bounds) this.bounds = [[lat, long],[lat, long]];
          if (this.bounds[1][0] > lat) this.bounds[1][0] = lat;
          if (this.bounds[0][0] < lat) this.bounds[0][0] = lat;
          if (this.bounds[1][1] > long) this.bounds[1][1] = long;
          if (this.bounds[0][1] < long) this.bounds[0][1] = long;
        }
      }
    });
  </script>
</body>
</html>
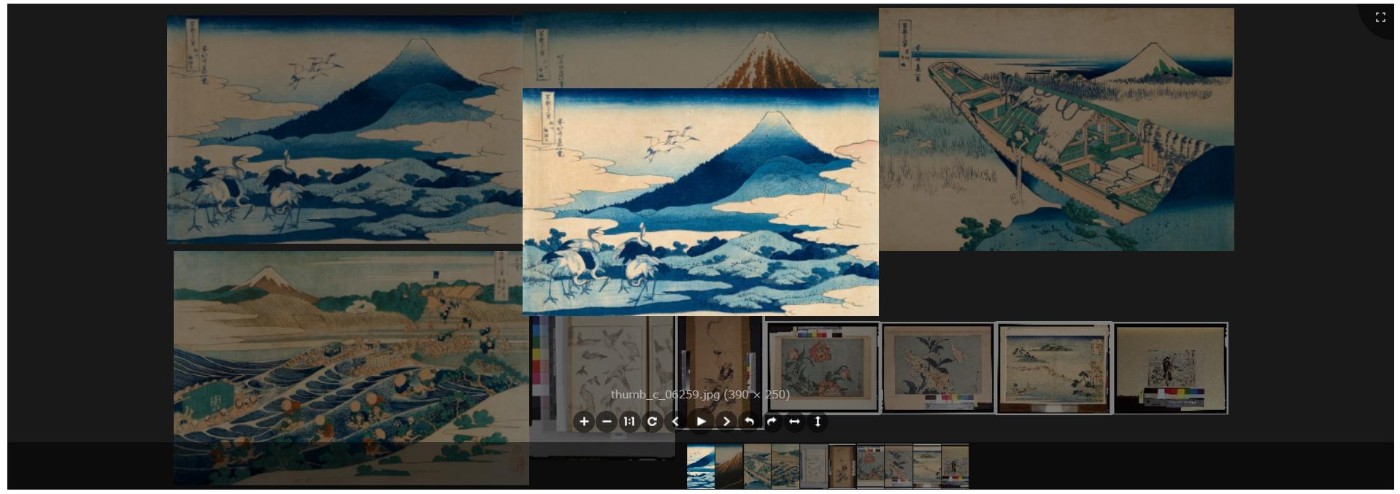
画像ビューア
データに画像ファイルのURLがあれば、画像ビューアWebアプリを簡単に作れます。
以下はジャパンサーチの絵画サムネイルを表示しています。
<!DOCTYPE html>
<html>
<head>
  <title>サンプルアプリ(画像ビューア/SPARQL)</title>
  <link href="https://unpkg.com/viewerjs/dist/viewer.css" rel="stylesheet">
  <style>
  .images {
    height: 100%;
    display: flex;
    justify-content: center;
    align-content: center;
    align-items: center;
    flex-wrap: wrap;
    padding: 5px;
    position: relative;
    background: #333;
  }
  </style>
</head>
<body>
  <div id="app">
    <div class="images" v-viewer="{ inline: true }">
      <img v-for="src in images" :src="src" :key="src">
    </div>
  </div>
  <script src="https://cdn.jsdelivr.net/npm/vue@2.x/dist/vue.js"></script>
  <script src="https://unpkg.com/viewerjs/dist/viewer.js"></script>
  <script src="https://unpkg.com/v-viewer/dist/v-viewer.js"></script>
  <script src="https://cdn.jsdelivr.net/npm/axios/dist/axios.min.js"></script>
  <script type="text/javascript">
    Vue.use(VueViewer.default);
    new Vue({
      el: '#app',
      data () {
        return {
          images: [],
        }
      },
      mounted() {
        var self = this;
        axios.get(
          'https://jpsearch.go.jp/rdf/sparql/', {
            params: {
              query: `
              PREFIX schema: <http://schema.org/>
              PREFIX chname: <https://jpsearch.go.jp/entity/chname/>
              PREFIX rdfs: <http://www.w3.org/2000/01/rdf-schema#>
              SELECT ?s ?label ?image WHERE {
                ?s schema:creator chname:葛飾北斎 ;
                   schema:image ?image ;
                   rdfs:label ?label .
              }
              limit 10`,
              output: 'json',
            }
          }
        ).then(function(response) {
          response.data.results.bindings.forEach(function(item) {
            self.images.push(item.image.value)
          });
        }).catch(function(error) {
          console.log(error);
        });
      },
    });
  </script>
</body>
</html>
ファイルフォーマット/API別実装
基本構造
データロード
全てのアプリ内で行っていることは基本的に同じで、ページが読み込まれた後に呼び出されるmountedメソッド内のaxiosでAPIやファイルをロードしてitems変数にデータを格納しています。
  mounted() {
    ...
    axios.get(
      'https://uedayou.net/ld/library/20210505/東京都/公共図書館.json'
    )
  axios.get(
    'https://jpsearch.go.jp/rdf/sparql/', {
      params: {
        query: `
          PREFIX schema: <http://schema.org/>
          PREFIX chname: <https://jpsearch.go.jp/entity/chname/>
          PREFIX rdfs: <http://www.w3.org/2000/01/rdf-schema#>
          SELECT ?s ?label ?image WHERE {
                 ?s schema:creator chname:葛飾北斎 ;
                    schema:image ?image ;
                    rdfs:label ?label .
          }
          limit 10`,
        output: 'json',
      }
    }
 )
  axios.post(
    'https://uedayou.net/loa/search', {
      query: `query PlaceList($query: String!, $type: String!) {
        searchPlaces(address: $query, type: $type) {
          label
          address
          url
          geohash
          type
        }
      }`,
      variables: {
        query: '東京都千代田区有楽町',
        type: 'ALL',
      }
    }
  )
その直後のthenメソッド内で得られたデータをitems変数に格納します。
もし、データ変換が必要であればここで行ってください。
axios.get(...)
.then(function(response) {
  const parsed = Papa.parse(
    response.data,
    {
      header: true,
      skipEmptyLines: true,
    });
  self.items = parsed.data;
})
シンプルテーブル
itemsに格納されたデータを以下の部分で表に割り当てています。
適宜格納されたデータ構造に応じて書き直してください。
詳しくは、Vuetify の Simple tables のページを参照してください。
<v-simple-table>
  <template v-slot:default>
    <thead>
      <tr>
        <th>日付</th>
        <th>国立感染症研究所</th>
        <th>検疫所</th>
        <th>地方衛生研究所・保健所</th>
        <th>民間検査会社</th>
        <th>大学等</th>
        <th>医療機関</th>
      </tr>
    </thead>
    <tbody>
      <tr v-for="item in items" :key="item['日付']">
        <td>{{ item['日付'] }}</td>
        <td>{{ item['国立感染症研究所'] }}</td>
        <td>{{ item['検疫所'] }}</td>
        <td>{{ item['地方衛生研究所・保健所'] }}</td>
        <td>{{ item['民間検査会社'] }}</td>
        <td>{{ item['大学等'] }}</td>
        <td>{{ item['医療機関'] }}</td>
      </tr>
    </tbody>
  </template>
</v-simple-table>
データテーブル
シンプルテーブルと同じく Vuetify を使用していますが、シンプルテーブルとは異なり、ヘッダーのカラムを格納するheadersにもデータを設定する必要があります。
詳しくはVuetify の Data tables のページを参照してください。
サンプルアプリ内ではsetDataメソッドで行っています。
setData: function(data) {
  const _headers = [];
  for (const d of data) {
     const item = {};
     for (const key in d) {
       item[key] = d[key];
       _headers.push(key);
     }
     this.items.push(item);
   }
   for (const h of [...new Set(_headers)]) {
     this.headers.push({
       text: h, value: h,
     });
   }
 }
地図
地図アプリはVue2Leafletを使用しています。
<l-map :bounds="bounds">
  <l-tile-layer :url="tileurl"></l-tile-layer>
  <l-marker v-for="item in items" :lat-lng="{lat: item.lat, lon: item.long }" >
    <l-popup>
      <a :href="item.url" target="_blank" rel="noreferrer noopener">
        {{ item.label }}
      </a>
    </l-popup>
  </l-marker>
</l-map>
まず、以下の:lat-lng="{lat: item.lat, lon: item.long }"の部分でマーカーの緯度、経度を割り当てます。
<l-marker v-for="item in items" :lat-lng="{lat: item.lat, lon: item.long }" >
マーカーをクリックしたときに表示する情報は以下で設定できます。
<l-popup>
  <a :href="item.url" target="_blank" rel="noreferrer noopener">
    {{ item.label }}
  </a>
</l-popup>
自動的にマーカーが表示される部分に地図をズームさせるためにsetBoundsメソッドでboundsを計算しています。
setBounds: function(lat, long) {
  if (!this.bounds) this.bounds = [[lat, long],[lat, long]];
  if (this.bounds[1][0] > lat) this.bounds[1][0] = lat;
  if (this.bounds[0][0] < lat) this.bounds[0][0] = lat;
  if (this.bounds[1][1] > long) this.bounds[1][1] = long;
  if (this.bounds[0][1] < long) this.bounds[0][1] = long;
}
画像ビューア
v-viewerを使用しています。
画像ビューアのみ、itemsではなく、imagesに画像ファイルのURLを設定します。
mounted() {
  var self = this;
  axios.get(...).then(function(response) {
    response.data.results.bindings.forEach(function(item) {
      self.images.push(item.image.value)
    });
  })
JSON
JSONファイルは、図書館施設データポータルから東京都の公共図書館リストを使用しています。
https://uedayou.net/ld/library/20210505/東京都/公共図書館.json
シンプルテーブル
コード:
GitHub Pages:
https://uedayou.github.io/vue-cdn-mashup-sample-apps/vue2/json/simpletable.html
データテーブル
コード:
GitHub Pages:
https://uedayou.github.io/vue-cdn-mashup-sample-apps/vue2/json/datatable.html
地図
コード:
GitHub Pages:
https://uedayou.github.io/vue-cdn-mashup-sample-apps/vue2/json/map.html
CSV
前述しましたが、CSVパースにPapa Parseを利用しています。
axios.get(...)
.then(function(response) {
  const parsed = Papa.parse(
    response.data,
    {
      header: true,
      skipEmptyLines: true,
    });
  self.items = parsed.data;
})
また、CSVファイルは、UTF8ではなくShift_jis として公開される場合も多いと思います。
それらを、UTF8に変換する場合は以下のように行えます。
axios.get(
  'https://www.city.shinagawa.tokyo.jp/ct/other000081600/toilet.csv',
  {
    responseType: 'arraybuffer',
    transformResponse: function(data) {
      // shift_jis to utf8
      return new TextDecoder("sjis").decode(data);
    }
  }
)
シンプルテーブル
シンプルテーブル、データテーブルの例は、厚生労働省が公開している新型コロナ関連のオープンデータ からPCR検査の実施件数を使用しています。
https://www.mhlw.go.jp/content/pcr_case_daily.csv
なお、上記ファイルはCORS対応されていないので、8/13現在のファイルをダウンロードしてGitHub Pagesでアクセスできるようにしたものを利用しています。
コード:
GitHub Pages:
https://uedayou.github.io/vue-cdn-mashup-sample-apps/vue2/csv/simpletable.html
データテーブル
コード:
GitHub Pages:
https://uedayou.github.io/vue-cdn-mashup-sample-apps/vue2/csv/datatable.html
地図
地図アプリでは、東京都オープンデータカタログより品川区 トイレ情報を使用しています。
https://www.city.shinagawa.tokyo.jp/ct/other000081600/toilet.csv
コード:
GitHub Pages:
https://uedayou.github.io/vue-cdn-mashup-sample-apps/vue2/csv/map.html
REST API
以下の例は、REST API として 内閣官房IT総合戦略室が公開する Open Data API を利用したコードの例になります。
Open Data API の利用には API KEY が必要です。以下を試すためにAPI KEYを発行し、'YOUR API KEY'の部分に設定してください。
他の REST API では、仕様に基づきパラメータなどを設定してください。
axios.get(
  'https://api.opendata.go.jp/mhlw/test-details', {
    params: {
     apikey: 'YOUR API KEY',
    }
  }
)
シンプルテーブル
厚生労働省 新型コロナ関連オープンデータAPIより、PCR検査の実施件数 APIを利用しています。
コード:
データテーブル
厚生労働省 新型コロナ関連オープンデータAPIより、PCR検査の実施件数 APIを利用しています。
コード:
地図
会津若松市 新型コロナ関連オープンデータAPIより、あいづ呑んべぇ文化支援プロジェクト APIを利用しています。
コード:
GraphQL
Linked Open Addresses Japanより周辺情報APIを使用しています。
詳細は以下を参照ください。
シンプルテーブル
コード:
GitHub Pages:
https://uedayou.github.io/vue-cdn-mashup-sample-apps/vue2/graphql/simpletable.html
データテーブル
コード:
GitHub Pages:
https://uedayou.github.io/vue-cdn-mashup-sample-apps/vue2/graphql/datatable.html
地図
コード:
GitHub Pages:
https://uedayou.github.io/vue-cdn-mashup-sample-apps/vue2/graphql/map.html
SPARQL
ジャパンサーチ の SPARQLエンドポイントを利用しています。
シンプルテーブル
コード:
GitHub Pages:
https://uedayou.github.io/vue-cdn-mashup-sample-apps/vue2/sparql/simpletable.html
データテーブル
コード:
GitHub Pages:
https://uedayou.github.io/vue-cdn-mashup-sample-apps/vue2/sparql/datatable.html
地図
コード:
GitHub Pages:
https://uedayou.github.io/vue-cdn-mashup-sample-apps/vue2/sparql/map.html
画像ビューア
コード:
GitHub Pages:
https://uedayou.github.io/vue-cdn-mashup-sample-apps/vue2/sparql/imageviewer.html
まとめ
今回 Node.js を使用しない テーブル、地図、画像ビューアのCDN版Vue.jsアプリを作りました。
CSVファイル、JSONファイル、Web APIとして、REST API、GraphQL、SPARQL からデータをロードするマッシュアップアプリを公開して、それぞれについて簡単ですが紹介しました。
個人的に今Webアプリの開発が難しくなりすぎている気がします。
この記事で、何もインストールや環境を用意しなくてもある程度のWebアプリが作れることが広まればと思いますし、同時に、Webアプリ作成の敷居が下がればいいなと思います。
この事例から、手軽にWebアプリを作ってみようと思ってくれる人がいればうれしく思います。
なお、すでに Vue.jsの最新版はv3ですがVeutify等がまだ完全にv3に対応できていないため、ここではv2ベースとなっています。
Vuetify等がv3への対応が完了してきた段階で、Vue3版も追加したいと思います。
最後に、今回使用したフレームワーク・ライブラリ、オープンデータを以下にまとめます。
Discussion