Raspberry Pi 5 の CPU温度を Newrelic Flex を使ってNewrelicに連携する
Raspberry Pi 5 はCPU温度が高くなりがちなので、Newrelic Flex を使ってNewrelicに連携する。
「Raspberry Pi 温度 Newrelic」で検索するとPythonスクリプトでがんばっている例が出てくるけど、今回紹介する Newrelic Flex を使う方法が一番シンプルだと思います。
ゴール
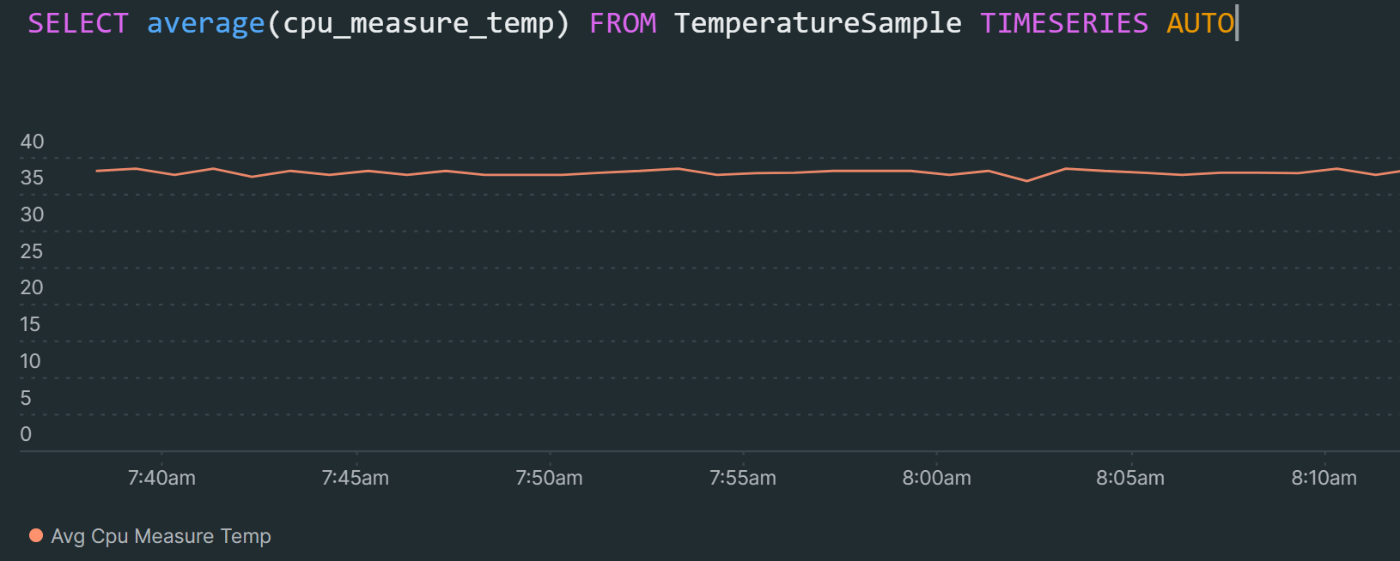
こんな感じのCPU温度グラフを作る。

事前準備
Raspberry Piもしくは監視対象のサーバにNewrelic Flexをインストールします。
Newrelic Flexはインフラストラクチャエージェントに含まれているのでインフラストラクチャエージェントをインストールします。
Flexには、Linux、Windows、またはKubernetesで実行しているインフラストラクチャエージェントバージョン1.10.7以降(アップデート | バージョンの確認)がバンドルされています。
https://docs.newrelic.com/jp/docs/infrastructure/host-integrations/host-integrations-list/flex-integration-tool-build-your-own-integration/
設定
コンフィグ
以下の通りコンフィグを作る。
integrations:
  - name: nri-flex
    config:
      name: raspberryPiIntegration
      apis:
        - name: Temperature
          commands:
            - run: vcgencmd measure_temp
              split: horizontal
              set_header: [cpu_measure_temp]
              regex_match: true
              split_by: ([0-9.]+)'C
次のコマンドで動作確認する。
sudo /opt/newrelic-infra/newrelic-integrations/bin/nri-flex -config_file /etc/newrelic-infra/integrations.d/raspberrypi.yml | jq .
こんな感じの出力がでるはず。

commandsに書く内容が失敗しているとmetricsの内容がflexStatusSampleのみになる。
有効化
動作確認できたコンフィグをサービス再起動で有効化する。
sudo systemctl restart newrelic-infra.service
確認
Newrelic画面にって値が連携されていることを確認します。
SELECT * from TemperatureSample
コマンドで動作確認した時の値も反映されているので、なんらか出ているはず。

グラフ作成
Query builderで次のクエリを実行するとグラフが描画されます。
SELECT average(cpu_measure_temp) FROM TemperatureSample TIMESERIES AUTO
後はこれをダッシュボードに設定するなりして眺めます。

参考URL
Flexはいろいろな書き方があるので、デバッグ方法だけ覚えたらサンプルを色々みて作るのが良いです。
公式
Discussion