Cloud Run サイドカーでメトリクス・トレースデータを可視化する
導入
先日、Cloud Run でのサイドカーコンテナがサポートされました。
今までは Cloud Run は 1 つのコンテナしか利用できませんでしたが、2 つ以上の複数のコンテナをデプロイできるようになりました。
これによりサイドカーとして Envoy を利用したり、OpenTelemetry collector を配置し分散トレーシングの設定をアプリケーションから外出しすることができるようになりました。
ゴール
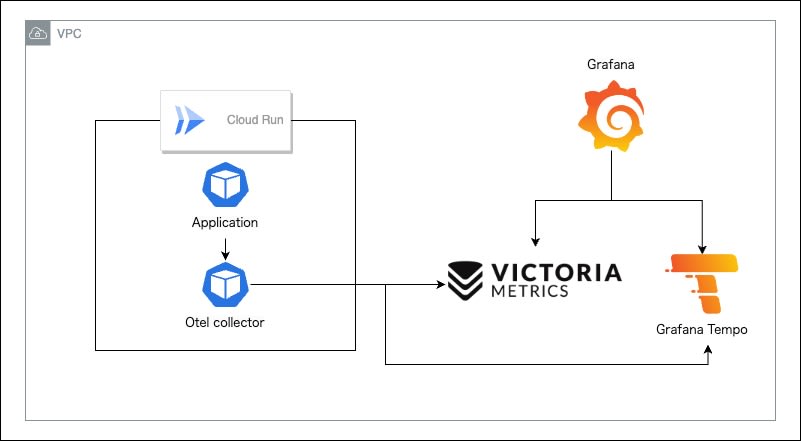
今回はこの仕組みを用いて、Cloud Run アプリケーションの Prometheus 互換のメトリクスとトレース情報をサイドカーの OpenTelemetry collector 経由で、ローカルでは Victoria Metrics / Grafana Tempo に、 Cloud Run では Cloud Monitoring / Cloud Trace に送信して可視化するまでの流れを整理したいと思います。
最終的な構成は以下のような構成を想定しています。
今回利用した検証用コードは以下のレポジトリで管理しています。
設定
事前準備
まずアプリケーション側に Prometheus のメトリクスとトレース情報を吐き出す実装を追加します。
Echo を使ったサンプルアプリケーションを利用しています。
Echo の実装自体は今回のスコープからは外れるので軽く抜き出しだけします。
メトリクス
Prometheus 用のメトリクスを吐き出す設定は Echo のライブラリとして存在するため今回はそちらを利用します。
import (
	"github.com/labstack/echo-contrib/echoprometheus"
	"github.com/labstack/echo/v4"
	"github.com/labstack/echo/v4/middleware"
)

func main() {
	e := echo.New()
	e.Use(echoprometheus.NewMiddleware(DefaultComponentName))
	e.GET("/metrics", echoprometheus.NewHandler())
}
上記のような実装を追加することで HTTP 関連のメトリクスを吐き出すことができます。
# HELP app_request_duration_seconds The HTTP request latencies in seconds.
# TYPE app_request_duration_seconds histogram
app_request_duration_seconds_bucket{code="200",host="app:8080",method="GET",url="/metrics",le="0.005"} 0
app_request_duration_seconds_bucket{code="200",host="app:8080",method="GET",url="/metrics",le="0.01"} 4
app_request_duration_seconds_bucket{code="200",host="app:8080",method="GET",url="/metrics",le="0.025"} 35
app_request_duration_seconds_bucket{code="200",host="app:8080",method="GET",url="/metrics",le="0.05"} 36
app_request_duration_seconds_bucket{code="200",host="app:8080",method="GET",url="/metrics",le="0.1"} 37
app_request_duration_seconds_bucket{code="200",host="app:8080",method="GET",url="/metrics",le="0.25"} 37
app_request_duration_seconds_bucket{code="200",host="app:8080",method="GET",url="/metrics",le="0.5"} 37
app_request_duration_seconds_bucket{code="200",host="app:8080",method="GET",url="/metrics",le="1"} 37
トレース情報
トレースに関しては OpenTelemetry の実装に沿っています。
今回はエクスポーターとして OpenTelemetry Collector をサイドカーとして利用します。
OpenTelemetry Collector は HTTP / gRPC 両方でリクエストを受け付けることができますが今回は gRPC を利用しています。
以下のように exporter を作成し
func NewExporter(ctx context.Context, cfg *config.Config) (sdktrace.SpanExporter, error) {
	client := otlptracegrpc.NewClient(
		otlptracegrpc.WithInsecure(),
		// ここで OpenTelemetry Collector のエンドポイントを指定します
		// ローカルで docker-compose を利用する場合は otel:4317
		otlptracegrpc.WithEndpoint(cfg.OtelCollectorEndpoint),
		otlptracegrpc.WithDialOption(grpc.WithBlock()),
	)

	exporter, err := otlptrace.New(ctx, client)
	if err != nil {
		return nil, err
	}

	return exporter, nil
}
作成した exporter を用いて trace provider を作成します。
	r := resource.NewWithAttributes(
		semconv.SchemaURL,
		semconv.ServiceNameKey.String(DefaultComponentName),
	)

	traceProvider := sdktrace.NewTracerProvider(
		sdktrace.WithBatcher(exporter),
		sdktrace.WithSampler(sdktrace.AlwaysSample()),
		sdktrace.WithResource(r),
	)

	otel.SetTracerProvider(traceProvider)
生成した trace provider を任意の関数の中で呼び出し、スパンを生成します。
func home(c echo.Context) error {
	_, span := tracer.Start(c.Request().Context(), "home")
	defer span.End()
	return c.JSON(http.StatusOK, nil)
}
OpenTelemetry Collector
メトリクスとトレース情報を受け取るコンポーネントとして OpenTelemetry Collector を構築します。
ローカル
ローカルで動かす際の OpenTelemetry Collector の設定を記載しています。
config.yaml
receivers:
  otlp:
    protocols:
      grpc:
        endpoint: "0.0.0.0:4317"
  prometheus:
    config:
      global:
        external_labels: {}
      scrape_configs:
        - job_name: cloud-run-otel
          scrape_interval: 10s
          static_configs:
            - targets:
                - localhost:8888
        - job_name: cloud-run
          scrape_interval: 10s
          metrics_path: /metrics
          static_configs:
            - targets:
                - app:8080
exporters:
  prometheusremotewrite:
    endpoint: http://victoriametrics:8428/api/v1/write
  otlp:
    endpoint: http://tempo:4317
    tls:
      insecure: true
service:
  telemetry:
    logs:
      level: WARN
      encoding: json
  extensions:
    - health_check
  pipelines:
    metrics:
      receivers:
        - prometheus
      exporters:
        - prometheusremotewrite
    traces:
      receivers:
        - otlp
      exporters:
        - otlp
extensions:
  health_check: null
Cloud Run
Cloud Run で動かす際の OpenTelemetry Collector の設定を記載しています。
config.yaml
receivers:
  otlp:
    protocols:
      grpc:
        endpoint: "0.0.0.0:4317"
  prometheus:
    config:
      global:
        external_labels:
          service: ${K_SERVICE}
          revision: ${K_REVISION}
      scrape_configs:
        - job_name: cloud-run-otel
          scrape_interval: 10s
          static_configs:
            - targets:
                - localhost:8888
        - job_name: cloud-run
          scrape_interval: 10s
          metrics_path: /metrics
          static_configs:
            - targets:
                - localhost:8080
exporters:
  googlemanagedprometheus:
    project: ${PROJECT_ID}
  googlecloud:
    trace:
      endpoint: cloudtrace.googleapis.com:443
service:
  telemetry:
    logs:
      level: WARN
      encoding: json
  extensions:
    - health_check
  pipelines:
    metrics:
      receivers:
        - prometheus
      processors:
        - batch
        - resourcedetection
        - resource
      exporters:
        - googlemanagedprometheus
    traces:
      receivers:
        - otlp
      exporters:
        - googlecloud
processors:
  batch:
    send_batch_max_size: 200
    send_batch_size: 200
    timeout: 5s
  resourcedetection:
    detectors:
      - env
      - gcp
  resource:
    attributes:
      - key: service.name
        value: ${K_SERVICE}
        action: upsert
      - key: service.instance.id
        from_attribute: faas.id
        action: insert
extensions:
  health_check: null
各種設定
まずは OpenTelemetry Collector がメトリクスとトレーシング情報を受け取るための receiver の設定を記載します。
トレーシング情報は先ほど記載したように gRPC で受け取るための設定を記載しています。
receivers:
  otlp:
    protocols:
      grpc:
        endpoint: "0.0.0.0:4317"
メトリクスは Prometheus の設定と同じような書き方でアプリケーションコンテナの /metrics をスクレイピングする設定を記載しています。
サービス運用していくと Cloud Run のリビジョンによってメトリクスを区別できた方がモニタリングを行いやすいため全てのメトリクスに対して global.external_labels で Cloud Run の予約環境変数である K_SERVICE / K_REVISION をラベルに追加しています。
receivers:
  prometheus:
    config:
      global:
        external_labels:
          # Cloud Run のリビジョン情報をメトリクスのラベルとして追加しています
          service: ${K_SERVICE}
          revision: ${K_REVISION}
      scrape_configs:
        - job_name: cloud-run-otel
          scrape_interval: 10s
          static_configs:
            - targets:
                - localhost:8888
        - job_name: cloud-run
          scrape_interval: 10s
          metrics_path: /metrics
          static_configs:
            - targets:
                - app:8080
Cloud Run で動かす際は、アプリケーションコンテナと OpenTelemetry Collector が同一ネットワーク上に所属するため static_configs を以下に変更する必要があります。
          static_configs:
            - targets:
                - localhost:8080
続いて、 OpenTelemetry Collector が受け取ったメトリクスとトレース情報を実際のデータストアに投げるための exporter の設定を記載します。
今回はローカルではメトリクスのデータストアとして Victoria Metrics
exporters:
  prometheusremotewrite:
    endpoint: http://victoriametrics:8428/api/v1/write
Cloud Run で動かす際は Google-managed Prometheus を利用するため exporter は以下の設定を利用しています。
※ Cloud Run の OpenTelemetry Collector コンテナの環境変数に PROJECT_ID を設定しています。
exporters:
  googlemanagedprometheus:
    project: ${PROJECT_ID}
ローカルのトレース情報のデータストアとして Grafana Tempo を利用しています。
exporters:
  otlp:
    endpoint: http://tempo:4317
    tls:
      insecure: true
Cloud Run で動かす際は Cloud Trace を利用するため exporter は以下の設定を利用しています。
exporters:
  googlecloud:
    trace:
      endpoint: cloudtrace.googleapis.com
そしてこれらの設定を流し込むためのローカル用の service を記載します。
service:
  telemetry:
    logs:
      level: ERROR
      encoding: json
  extensions:
    - health_check
  pipelines:
    metrics:
      receivers:
        - prometheus
      exporters:
        - prometheusremotewrite
    traces:
      receivers:
        - otlp
      exporters:
        - otlp
extensions:
  health_check: null
Cloud Run で動かす際は以下のような設定を記載します。
service:
  telemetry:
    logs:
      level: WARN
      encoding: json
  extensions:
    - health_check
  pipelines:
    metrics:
      receivers:
        - prometheus
      processors:
        - batch
        - resourcedetection
        - resource
      exporters:
        - googlemanagedprometheus
    traces:
      receivers:
        - otlp
      exporters:
        - googlecloud
また、 Cloud Run の場合は Google-managed Prometheus に必要な設定などを自動で挿入するための processors の設定を追加しています。
resourcedetection に関してはこちらのページを参考にしています。
processors:
  batch:
    send_batch_max_size: 200
    send_batch_size: 200
    timeout: 5s
  resourcedetection:
    detectors:
      - env
      - gcp
  resource:
    attributes:
      - key: service.name
        value: ${K_SERVICE}
        action: upsert
      - key: service.instance.id
        from_attribute: faas.id
        action: insert
データストア
今回は Victoria Metrics や Tempo の設定はスコープ対象外とするため詳細には記載しませんが、 GitHub レポジトリにローカルで動かすための設定が記載されていますので気になる方は参考にしてみてください。
確認
ローカルでの確認
上記設定を全てまとめてローカルで実行できるように docker compose 環境作成しているのでこちらを立ち上げて確認を行っていきます。
以下のコマンドで環境の立ち上げを行います。
docker compose up -d
立ち上がったのち、 localhost:3000 にて Grafana へアクセスします。
初期ログイン情報はユーザ名・パスワードともに admin となっています。
ログイン後に Explore にてメトリクスとトレース情報の確認を行います。
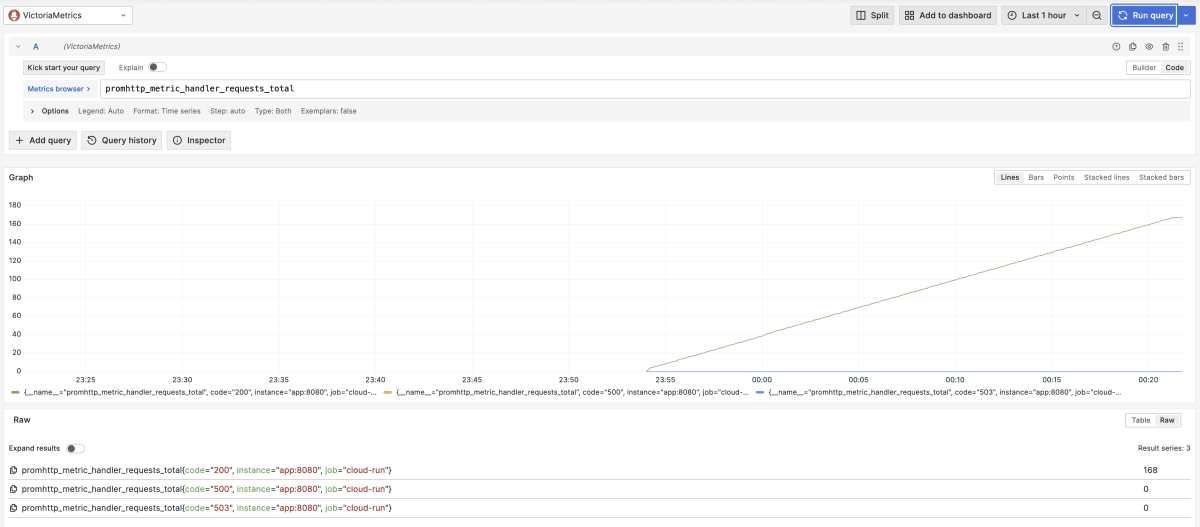
メトリクスはデータソースを VictoriaMetrics にした状態で以下のようなクエリを叩くことで Echo のメトリクスが可視化されていることが確認できます。
promhttp_metric_handler_requests_total
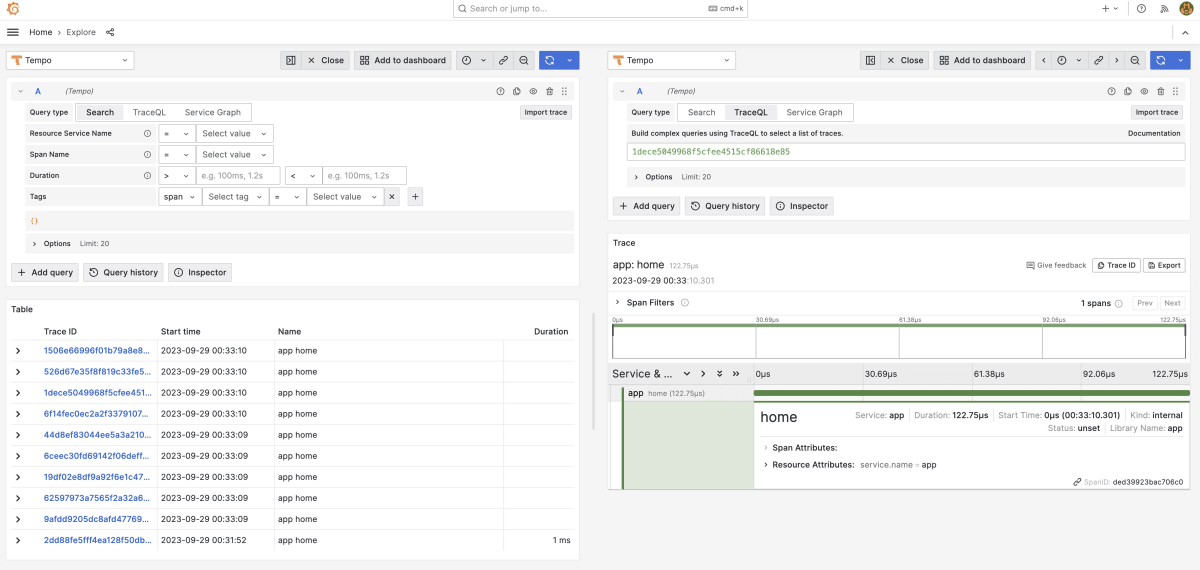
トレース情報はデータソースを Tempo にすることでアプリケーションから吐き出されたトレース情報を確認することができます。
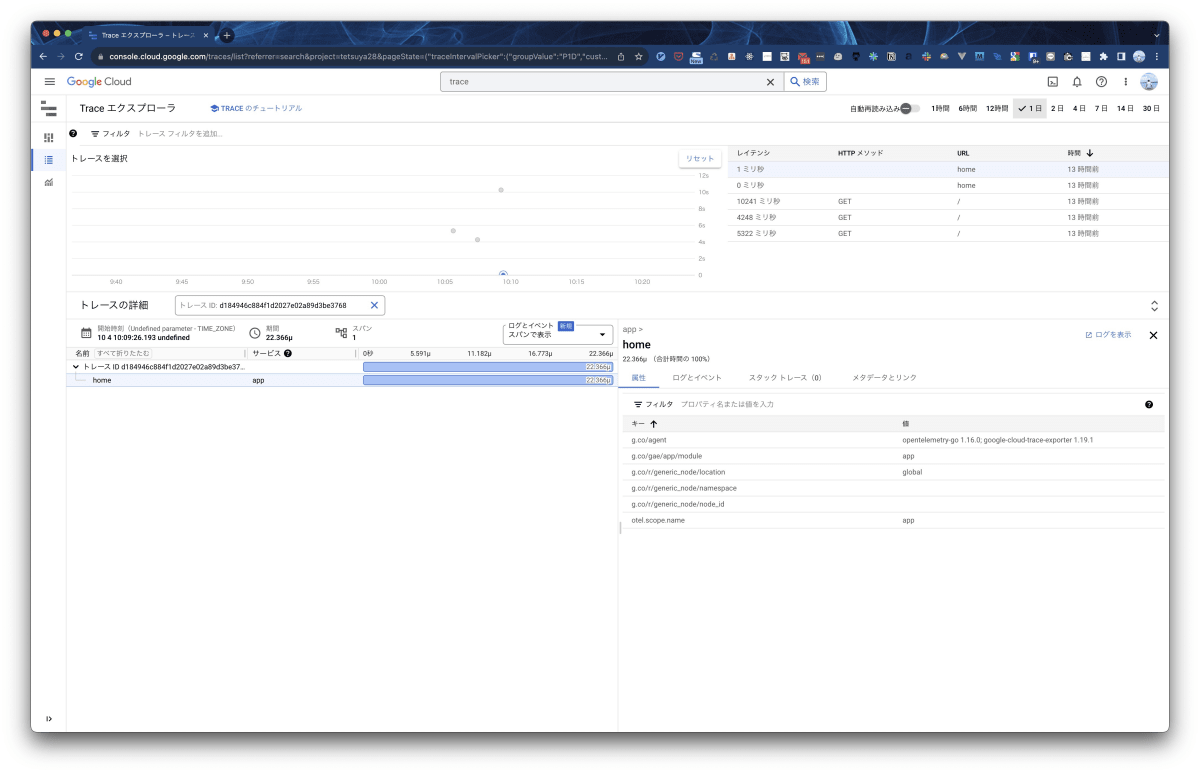
Cloud Run での確認
ここまででローカルでの動作確認が完了したので実際に Cloud Run で実行するための設定と構成を記載していきます。
Cloud Run の設定は Knative のマニフェストを利用しています。
apiVersion: serving.knative.dev/v1
kind: Service
metadata:
  name: cloud-run-mco
  annotations:
    run.googleapis.com/launch-stage: BETA
    run.googleapis.com/ingress: all
spec:
  template:
    metadata:
      annotations:
        autoscaling.knative.dev/maxScale: '1'
    spec:
      containerConcurrency: 1
      timeoutSeconds: 300
      serviceAccountName: "" # roles/cloudtrace.agent, roles/monitoring.metricWriter 権限を持った Google Service Account を指定します
      containers:
      - name: app
        image: "" # ビルドしたアプリケーションコンテナを指定します
        env:
        - name: OTEL_COLLECTOR_ENDPOINT
          value: localhost:4317
        ports:
        - name: http1
          containerPort: 8080
        resources:
          limits:
            cpu: 500m
            memory: 256Mi
        startupProbe:
          timeoutSeconds: 5
          periodSeconds: 5
          failureThreshold: 3
          httpGet:
            path: /
            port: 8080
      - image: "" # ビルドした OpenTelemetry Collector コンテナを指定します
        env:
        - name: PROJECT_ID
          value: "" # 動かしている GCP プロジェクトを指定します
        resources:
          limits:
            cpu: 200m
            memory: 128Mi
        startupProbe:
          initialDelaySeconds: 10
          timeoutSeconds: 10
          periodSeconds: 30
          failureThreshold: 3
          httpGet:
            path: /
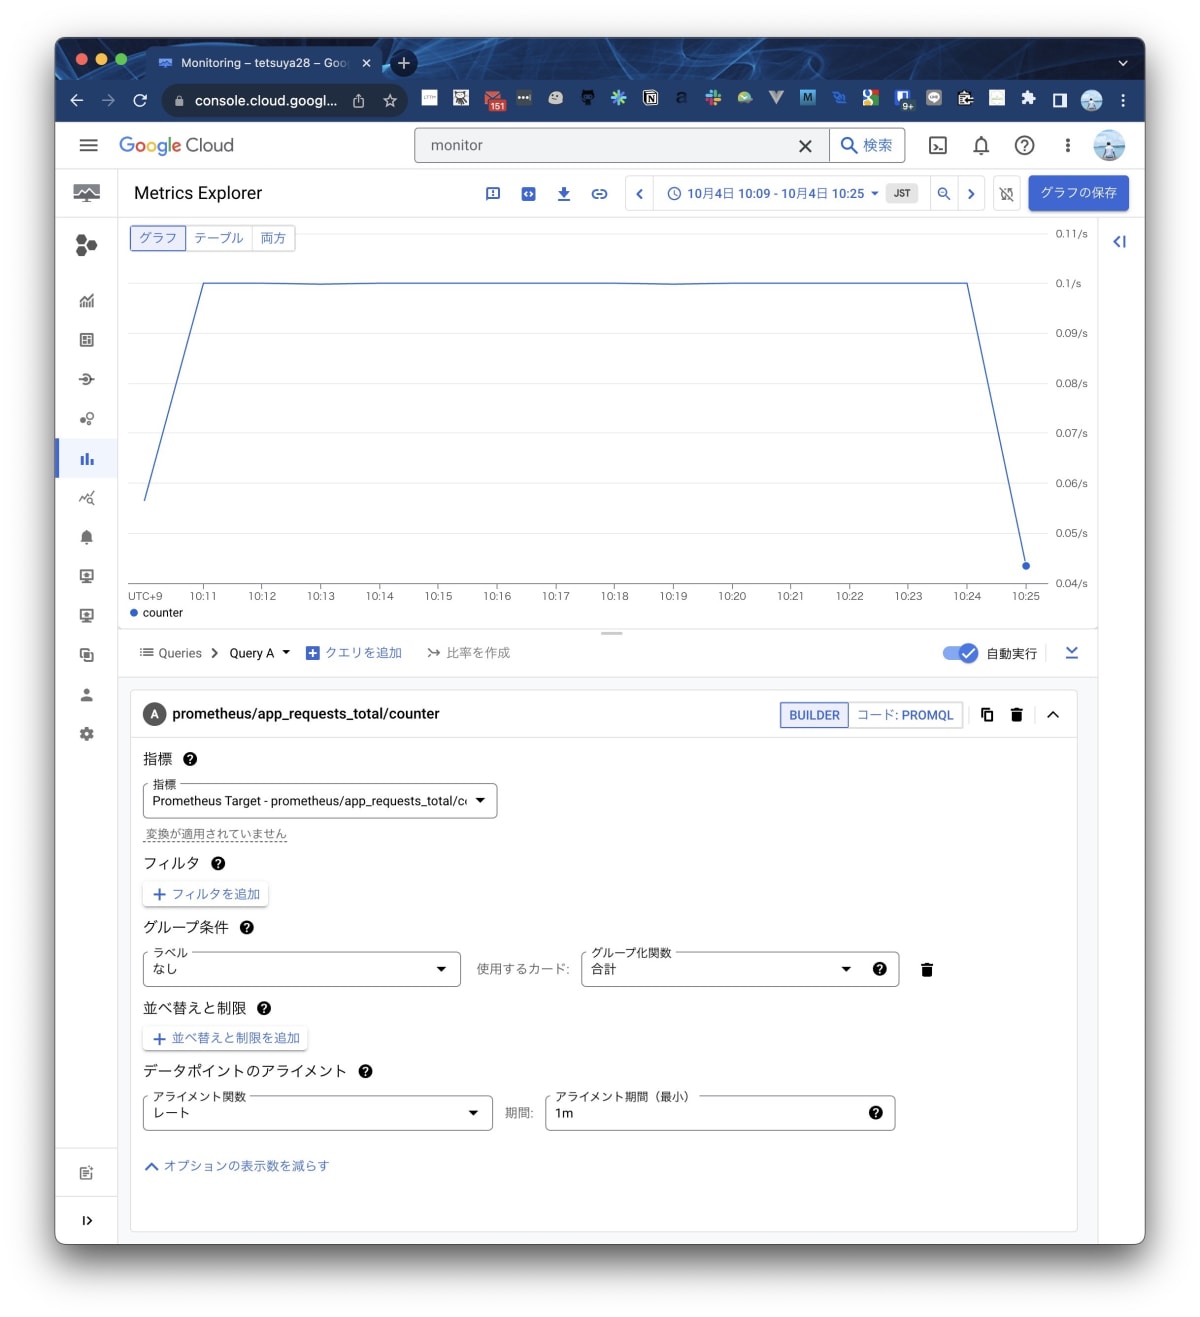
Cloud Monitoring と Cloud Trace でそれぞれメトリクスとトレース情報が可視化されていることが確認できます。
まとめ
アプリケーションの実装からメトリクスとトレース情報の送信や回収を OpenTelemetry Collector に委譲することにより Cloud Run だけではなく任意の環境で同じようなモニタリングの仕組みを実現することができるようになりました。
OpenTelemetry Collector の設定は yaml で管理する必要があり、またローカルと Cloud Run で設定も違うことも多いですが今回の記事では紹介しませんでしたが cue を用いて共通化しながら環境ごとに差分を適用することでかなり簡単に構成ファイルを管理することもできるようになっています。
気になる方は GitHub のレポジトリをご覧ください。
ご意見やご指摘などありましたらコメント / X ( Twitter ) での連絡お待ちしております。
Discussion