📊
GNUPLOT 基礎設定


GNUPLOT 基礎設定
この記事はGNUPLOTの備忘録である. 学生時代の私のメモを再構成した.
(前提) 動作環境
動作確認に用いた環境はLinux(Ubuntu)の以下のとおりである.
$ cat /proc/version
Linux version 5.4.0-91-generic (buildd@lcy01-amd64-017) (gcc version 9.3.0 (Ubuntu 9.3.0-17ubuntu1~20.04)) #102-Ubuntu SMP Fri Nov 5 16:31:28 UTC 2021
$ cat /etc/os-release
NAME="Ubuntu"
VERSION="20.04.3 LTS (Focal Fossa)"
ID=ubuntu
ID_LIKE=debian
PRETTY_NAME="Ubuntu 20.04.3 LTS"
VERSION_ID="20.04"
HOME_URL="https://www.ubuntu.com/"
SUPPORT_URL="https://help.ubuntu.com/"
BUG_REPORT_URL="https://bugs.launchpad.net/ubuntu/"
PRIVACY_POLICY_URL="https://www.ubuntu.com/legal/terms-and-policies/privacy-policy"
VERSION_CODENAME=focal
UBUNTU_CODENAME=focal
$ gnuplot --version
gnuplot 5.2 patchlevel 8
デフォルトの terminal 確認
起動直後に確認を行う.
gnuplot> show terminal
terminal type is qt 0 font "Sans,9"
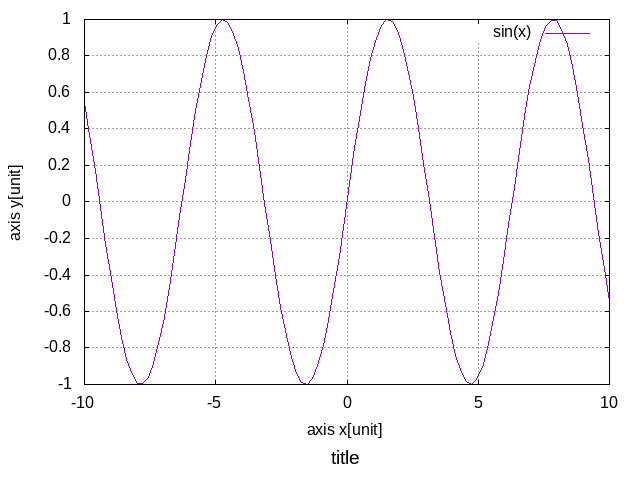
グラフタイトル, 軸タイトル, グリッド
グラフタイトルを図の下, x/yそれぞれに軸タイトルをつけ, 図中に軸の目盛りを描画する.
gnuplot> set label 11 center at graph 0.5,char 1 "title" font ",14"
gnuplot> set bmargin 5
gnuplot> set xlabel "axis x"
gnuplot> set ylabel "axis y"
gnuplot> set grid
グラフの画像出力
実行しているディレクトリにfoo.png(sin関数)が作成される. 出力をsvg画像にしたければ set terminal svg とすれば良い. 最後の unset terminal は出力先をデフォルト(この環境ではqtのウィンドウ)に戻すためのもの.
gnuplot> set terminal png
Terminal type is now 'png'
Options are 'nocrop enhanced size 640,480 font "arial,12.0" '
gnuplot> set output 'foo.png'
gnuplot> plot sin(x)
gnuplot> unset terminal
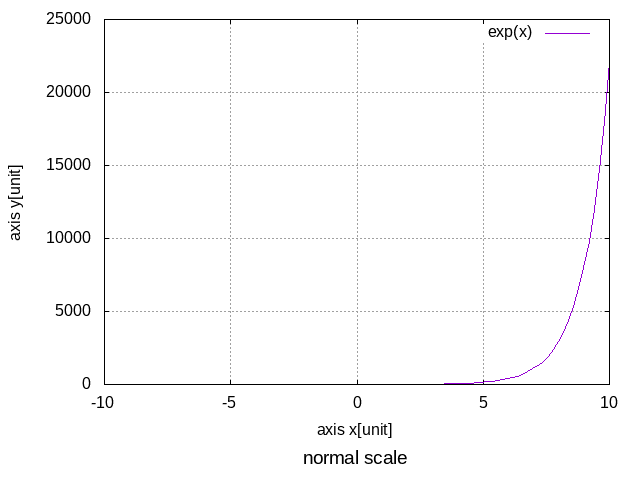
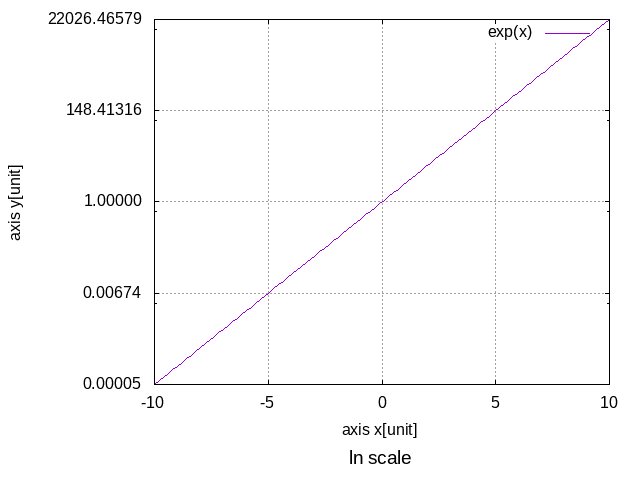
対数軸
自然対数( exp(1) を 単に10 とすれば10を底とする対数軸がとれる.
gnuplot> set logscale y exp(1)
関数定義
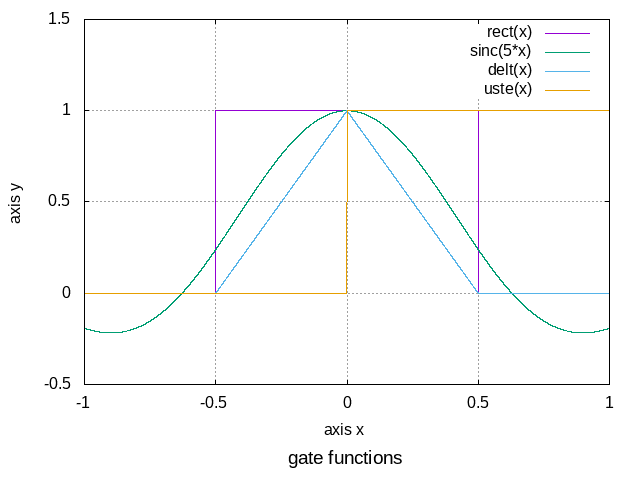
ここでは一部のゲート関数の定義を例とする.
set sample 10000 でx軸のサンプル回数を10000点分に変更している. デフォルトの100点分では鋭角部が評価されきれず, 関数の正確な形が見てとれない.
図はsinc関数のみ5倍周期である.
gnuplot> rect(x) = 0.5 < abs(x) ? 0 : 0.5 > abs(x) ? 1 : 0.5
gnuplot> sinc(x) = 0 == x ? 1 : sin(x)/x
gnuplot> delt(x) = 0.5 < abs(x) ? 0 : 1 - abs(x) * 2
gnuplot> uste(x) = 0 > x ? 0 : 1
gnuplot> set sample 10000
複素数
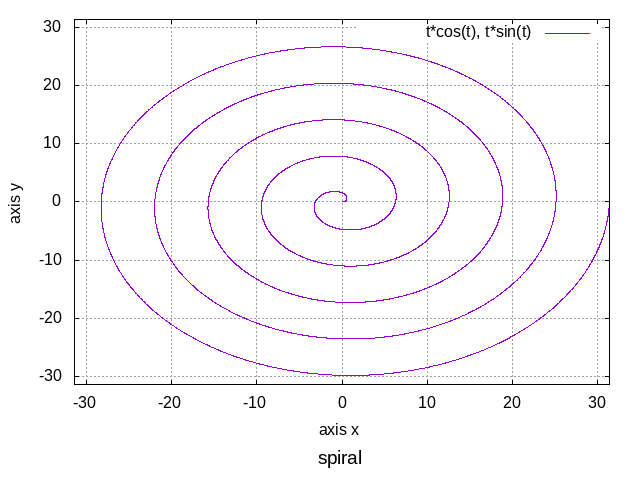
set parametric で媒介変数を利用するモードになる. このモードでは x ではなく, t を変数として扱い, plotでは
gnuplot> set parametric
gnuplot> set xrange [-10*pi:10*pi]
gnuplot> set yrange [-10*pi:10*pi]
gnuplot> set trange [0:10*pi]
gnuplot> plot t*cos(t),t*sin(t)
gnuplot> unset parametric
参考
- GNUPLOTを用いたグラフ作成
- Gnuplotの利用
- gnuplotの使い方メモ
- 学生時代の私のメモ
Discussion
当時の私に対する回答はこれでよいのだろうか.