国際連合の世界人口統計 Web サイトの使い方について調べる
このスクラップについて
このスクラップでは国連(United Nations: UN)の世界人口統計(World Population Prospects) Web サイトの統計データにアクセスする方法について記録していく。
英語の勉強
prospects は「見込み」や「見通し」という意味で「推計」と訳されるようだ。
トップページ
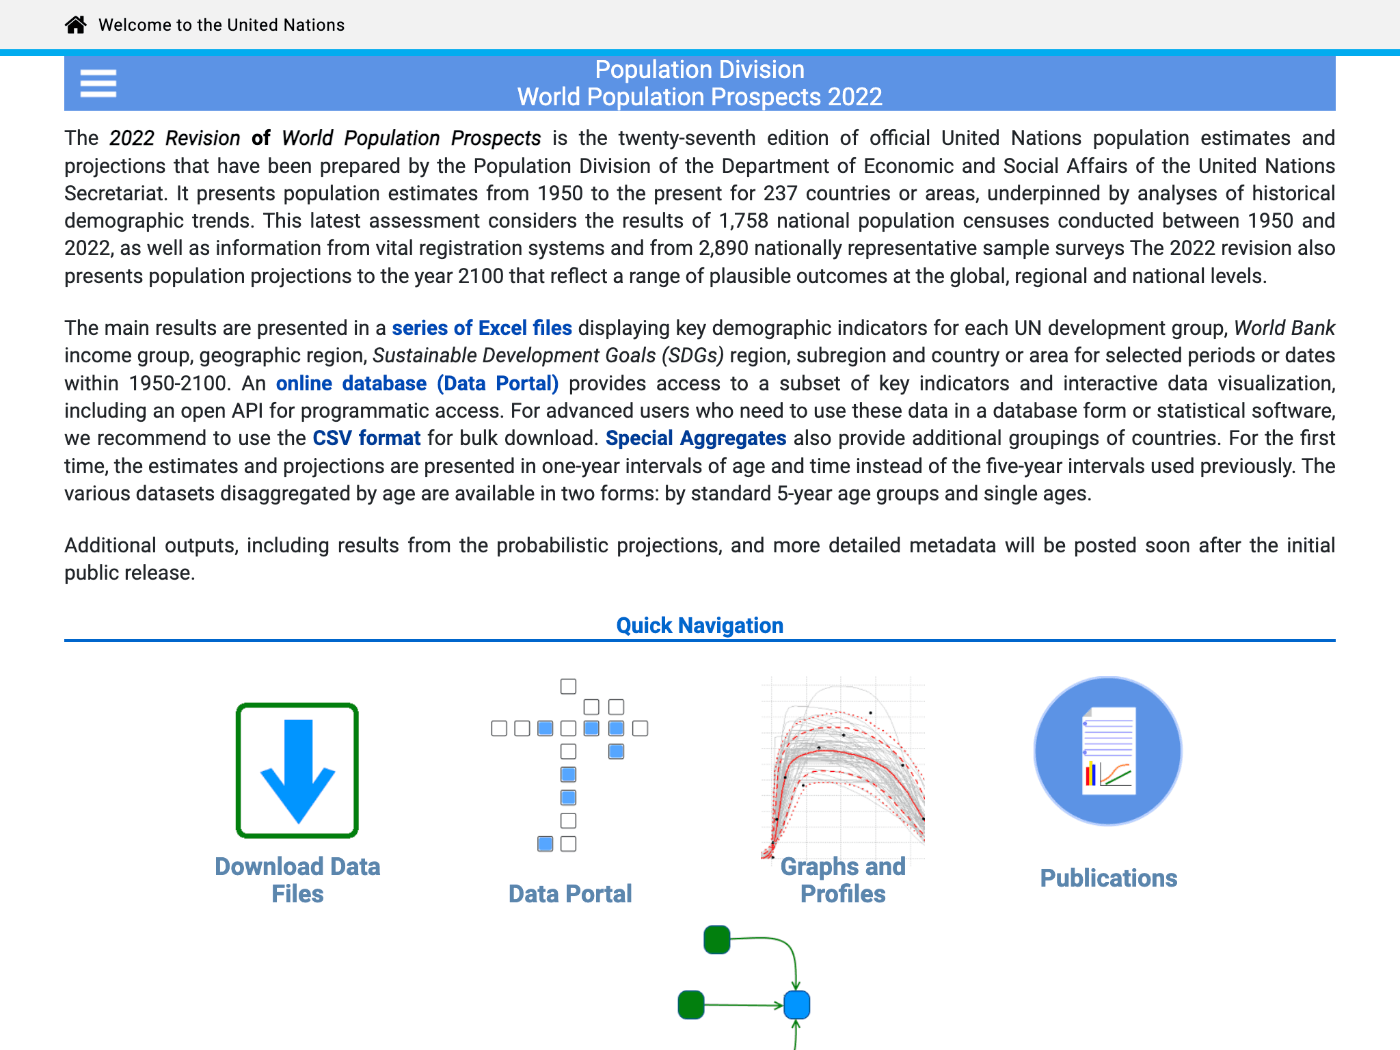
Web サイトについて解説する本文、Quick Navigation、Disclaimer(免責事項)から構成されている。
Web サイトの解説
少し長いが要点を拾ってみよう。
The 2022 Revision of World Population Prospects is the twenty-seventh edition of official United Nations population estimates and projections that have been prepared by the Population Division of the Department of Economic and Social Affairs of the United Nations Secretariat. It presents population estimates from 1950 to the present for 237 countries or areas, underpinned by analyses of historical demographic trends. This latest assessment considers the results of 1,758 national population censuses conducted between 1950 and 2022, as well as information from vital registration systems and from 2,890 nationally representative sample surveys The 2022 revision also presents population projections to the year 2100 that reflect a range of plausible outcomes at the global, regional and national levels.
- 2022 年版世界人口推計は 27 番目の国連公式の人口に関する推定と予測である。
- 237 の国または地域の 1950 年から現在までの人口の推定値と 2100 年までの予想値が紹介されている。
The main results are presented in a series of Excel files displaying key demographic indicators for each UN development group, World Bank income group, geographic region, Sustainable Development Goals (SDGs) region, subregion and country or area for selected periods or dates within 1950-2100. An online database (Data Portal) provides access to a subset of key indicators and interactive data visualization, including an open API for programmatic access. For advanced users who need to use these data in a database form or statistical software, we recommend to use the CSV format for bulk download. Special Aggregates also provide additional groupings of countries. For the first time, the estimates and projections are presented in one-year intervals of age and time instead of the five-year intervals used previously. The various datasets disaggregated by age are available in two forms: by standard 5-year age groups and single ages.
- 統計データは Excel ファイルで提供される。
- Data Portal というオンラインデータベースを使うと統計データの一部分を取得したり可視化したりすることができる。
- Data Portal には API アクセスもできる、また、上級者向けに CSV 形式でデータも提供されている。
- Special Aggregates からは国・地域以外のグループごとの統計データにアクセスできる。
- 2022 年版から初めて 5 年単位ではなく 1 年単位で人口の推定値や予想値が紹介されている。
ヘッダーナビゲーション
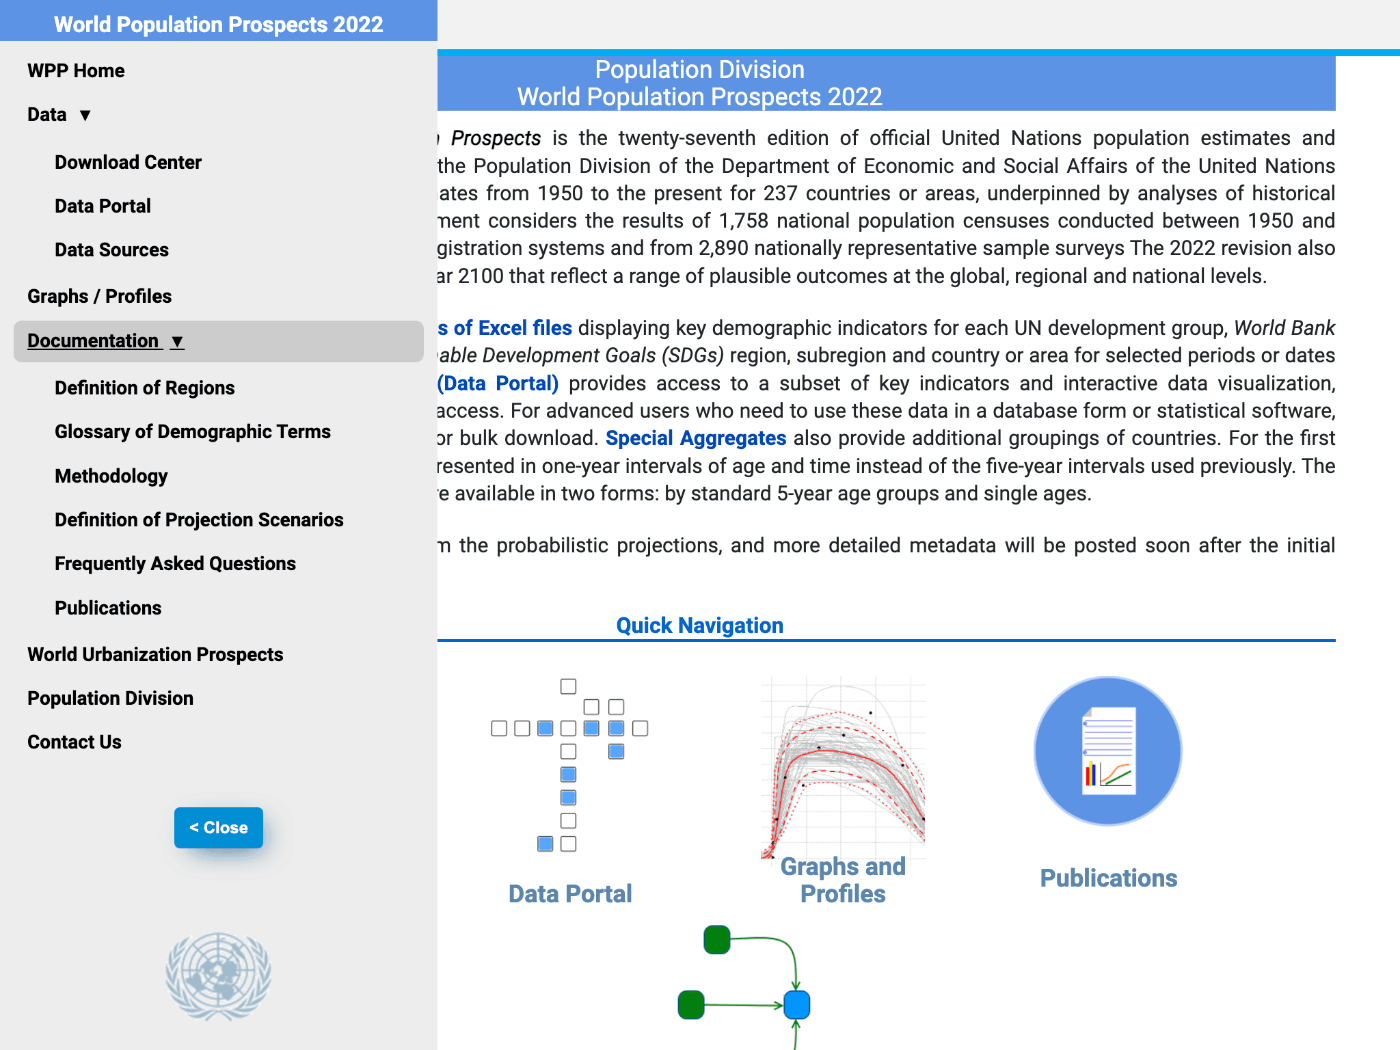
WPP Home、Data など 7 つの項目がある、Data と Documentation は 2 階層になっている。
Download Center
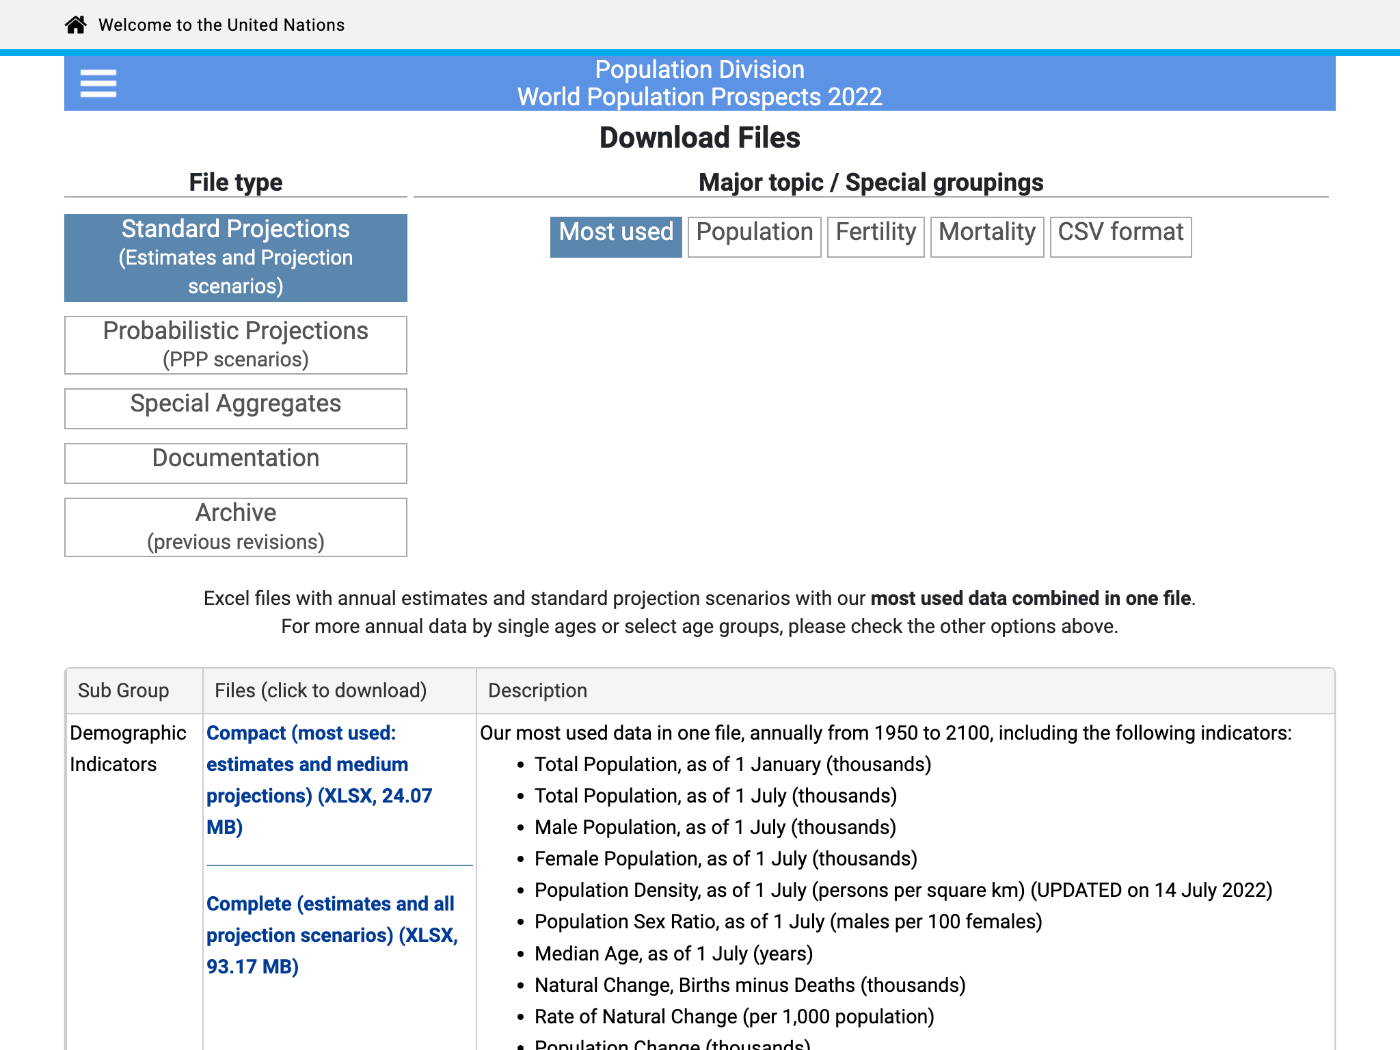
Excel ファイルをダウンロードできるページのようだ。
Excel ファイルの一覧は File type と Major topic / Special groupings の選択状態によって変わるようだ。
File type
下記 5 つの File type がある。
- Standard Projections
- Probablistic Projections
- Special Aggregates
- Documentation
- Archive
Major topic / Special groupings
一例として File type として Standard Projections を選ぶと下記 5 つの項目が表示される。
- Most used
- Population
- Fertility
- Mortality
- CSV format
Standard Projections と Probablistic Projections の違い
上記のページが参考になりそう。
Standard Projections では様々なシナリオを想定して予想しているようだ。
試しにダウンロード
最も最初に表示される Compact (most used: estimates and medium projections) をダウンロードしてみる。
24.07 MB もある!Mac の Excel で開けるのか心配だ。
ダウンロードには 1 分くらいかかった。
Description によると下記のようなデータが含まれているようだ。
- Total Population, as of 1 January (thousands)
- Total Population, as of 1 July (thousands)
- Male Population, as of 1 July (thousands)
- Female Population, as of 1 July (thousands)
- Population Density, as of 1 July (persons per square km)
世界の人口

1 シート目には国・地域 × 西暦年の人口推定値の統計データが掲載されている。
データによると 2021 年 7 月 1 日時点で 79 億人、うち男性は 39.7 億人、女性は 39.3 億人、人口密度は 1 平方キロメートルあたり 60.7 人のようだ。
逆に 1 人あたりの占有面積は 60.7 の逆数を取るので 0.0164 平方キロメートル、平方根は 0.128 km なので 128 m × 128 m のスペースがある。
1 坪は約 3.3 平米(3.3e-6 平方キロメートルなので)なのでほぼ 5,000 坪になる。
サッカーコートが 7,140㎡(約2,160坪)らしいのでみんなで分けるとサッカーコート 2.5 個分の土地がもらえることになる。
日本の人口
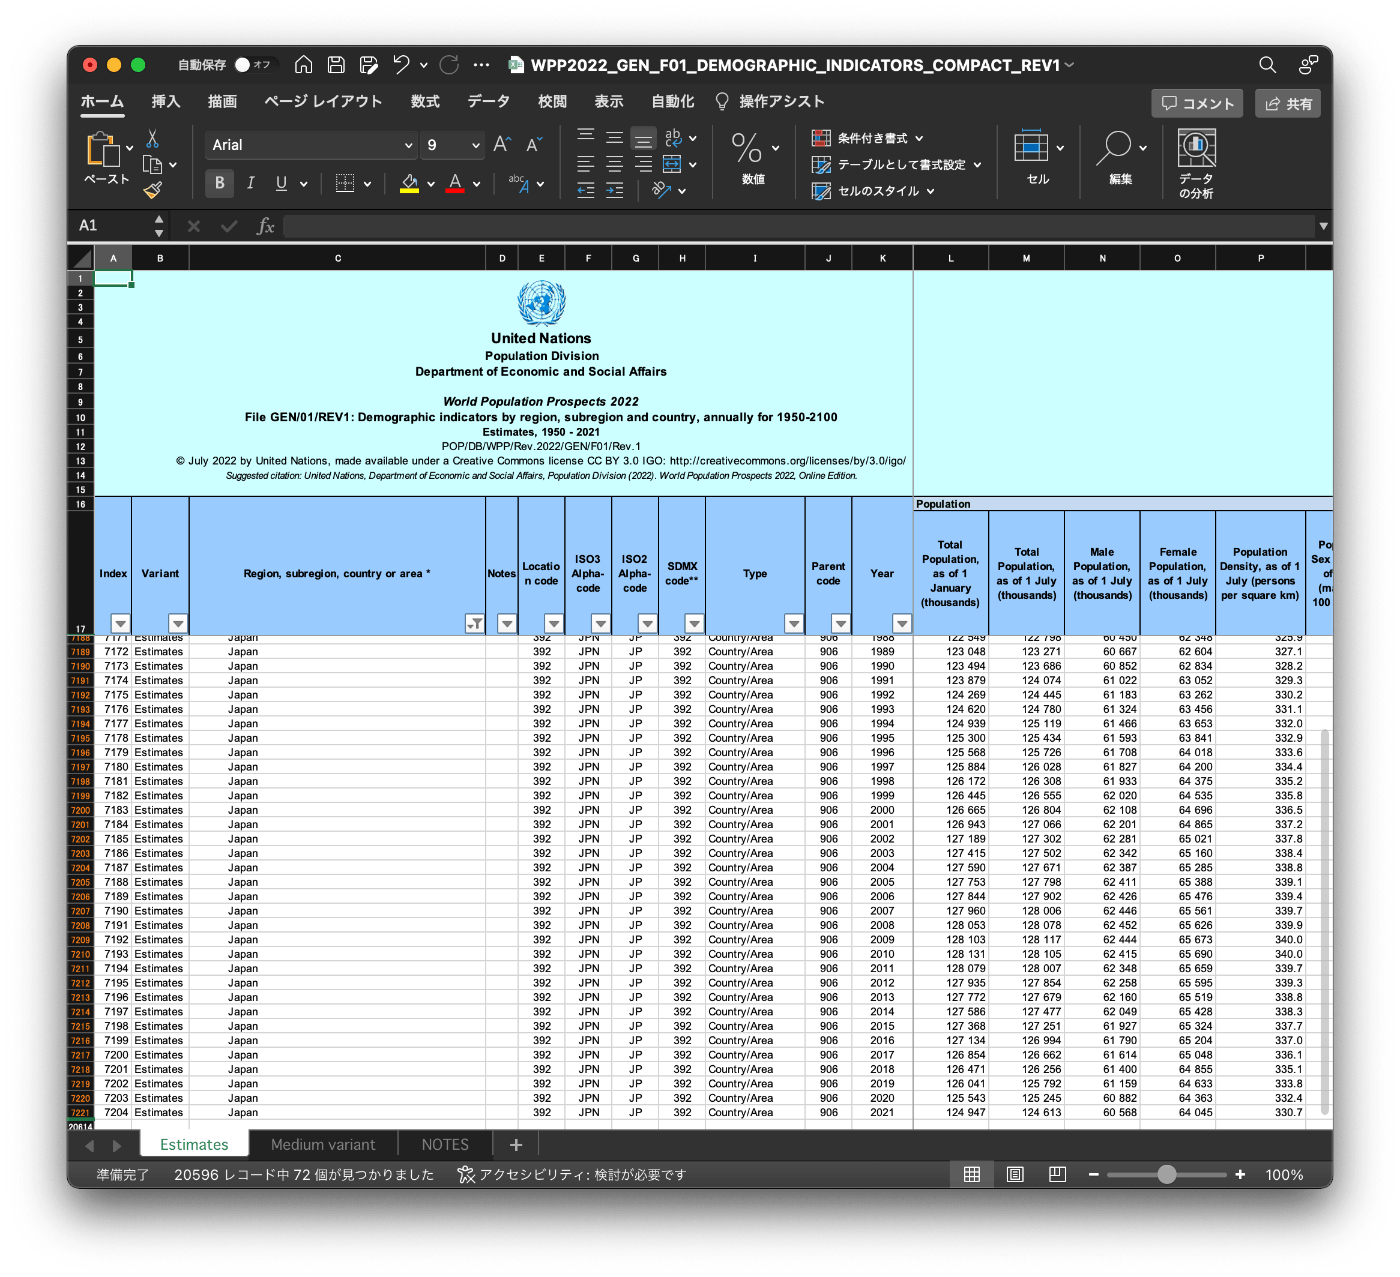
行頭(17 行目)のフィルタ機能を使って日本のデータのみに絞り込んだ。
2021 年 7 月 1 時点で人口は 1 億 2461 万人、男性は 6056 万人、女性は 6404 万人。
女性の方が 348 万人も多い!女性の方が平均寿命が長そうなので当然の結果か。
人口密度は 1 平方キロメートルあたり 330.7 人、1 人あたりの占有面積は 0.003 平方キロメートル、平方根は 0.055 km なので 55 m × 55 m のスペースがある。
坪数に換算すると 916 坪、家の広さは 30〜40 坪(100 平米)なので建ぺい率 50 % としても平家が 10 軒以上建てられそうだ。
日本の人口についてもっと
興味深かったのでこのまま主要な数字を見ていこう。
人口ピーク
日本の人口は 2010 年 1 月 1 日時点の 1 億 2,813 万人 がピークになっている。
2020 年は 1 億 2,554 万人なので 10 年で 259 万人減っている、1 年間だと 25.9 万人減っている。
僕の住んでいる新潟県長岡市の令和 5 年 10 月 1 日時点の人口が 25.8 万人なので 1 年ごとに長岡市が消滅している感じだ、そう考えると少し怖いな。
男女比
2022 年 7 月 1 日時点で男性 ÷ 女性 = 94.6 %
結婚適齢期と言われる 20〜40 代の男女比はどうなっているんだろう?
人口ピラミッドを見ればわかるかも知れない。
年齢の中央値
2022 年時点では 48.4 才、毎年 0.5 才くらい増えている。
出生数マイナス死亡数
2022 年時点で -75.6 万人とある。
ただ、1/1 時点でも 7/1 時点でも前年の総人口の差はそれぞれ -59.6 万人 -61.4 万人となっていて 15 万人くらい増えている。
おそらく移民とか帰国した人とかそういうのなのだろう。
そういうのを考慮しないと 2005 年時点で出生数マイナス死亡数は -6.2 万人とマイナスになっている。
出生数マイナス死亡数の割合
2022 年時点で 1,000 人あたり -6.1 人なので人口 1.5 万人くらいの長岡市栃尾地域なら 15 倍で毎年 91.5 名の純減となる。
学校なら 3 クラスくらい無くなってしまいそうだ。
人口変化
2022 年時点で -66.8 万人、1 年で 5〜10 万人くらい減っているので 2023 年は -70 万人、2030 年は -100 万人くらいになりそうだな。
人口変化について後から予測値を見たら 2023 年は -65.3 万人、2030 年は -70.6 万人で全然そんなことは無かった。