NW図 as Code(5) Graphvizのさまざまなグラフを見てみる
前回のおさらい
Graphvizを使って2種類の物理ネットワーク構成図を書きました。
様々なグラフを見てみる
ところでGraphvizは(グラフ理論の)グラフを描くためのツールです。グラフの各ノード、エッジの配置を決めるレイアウトエンジンがいくつか用意されていて、レイアウトエンジンごとに結構違う見た目のグラフになります。
ネットワーク図として使うにはデフォルトのdotエンジンがいいと思うのですが、暇つぶしにほかのレイアウトエンジンも見てみましょう。
dot
“hierarchical” or layered drawings of directed graphs.
dot is the default tool to use if edges have directionality.
The layout algorithm aims edges in the same direction (top to bottom, or left to right) and then attempts to avoid edge crossings and reduce edge length.
Graphvizのデフォルトです。有向グラフの階層的、層状の図。
Graphvizでグラフを使うのに使う言語をDOT言語というので、そこから来ている名前だと思うのですが、DOT言語は何の略なんだろう?

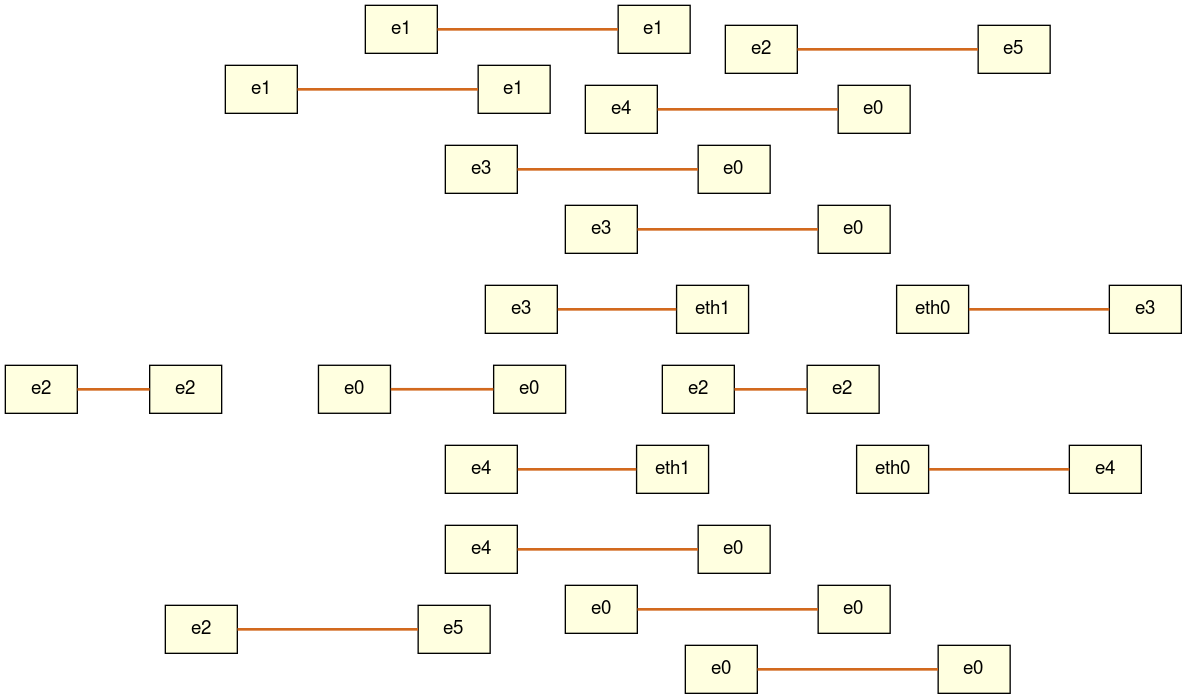
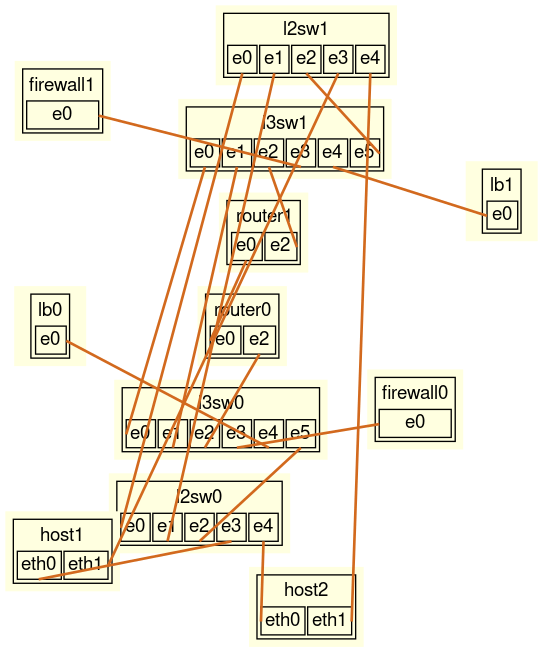
Polygone-basedのネットワーク図(dot)

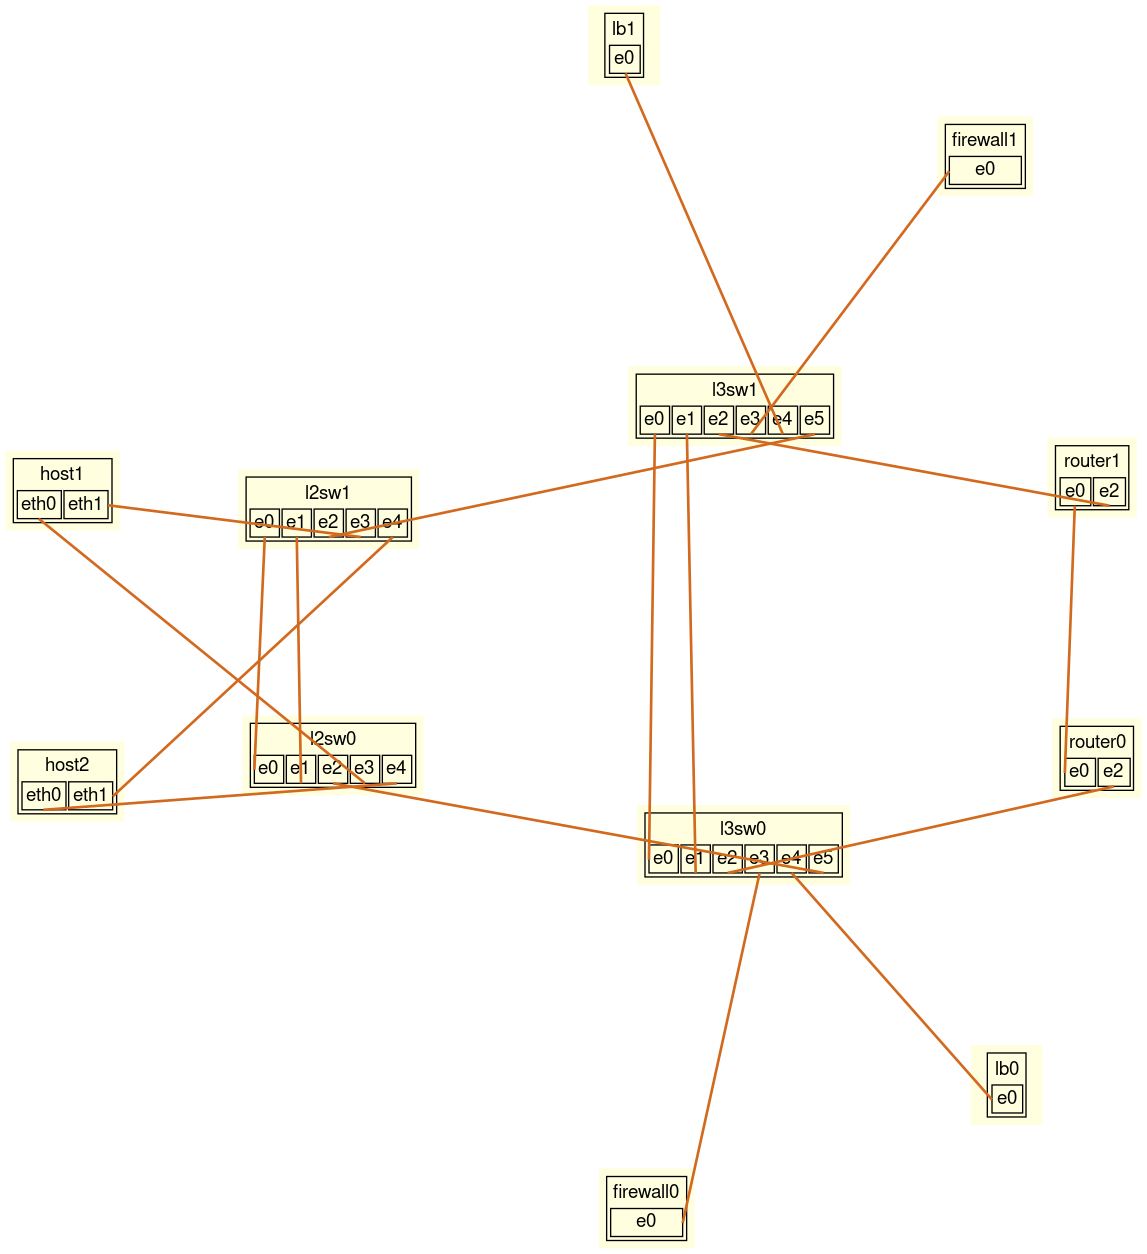
HTML-like labelのネットワーク図(dot)
neato
“spring model” layouts.
neato is a reasonable default tool to use for undirected graphs that aren’t too large (about 100 nodes), when you don’t know anything else about the graph.
neato attempts to minimize a global energy function, which is equivalent to statistical multi-dimensional scaling.
バネモデルのレイアウトだそうです。
「neato」の意味が分からないんですよね。
英辞郎だと「俗〉素晴らしい、格好いい◆1960年代後半から10代の若者の間で使われるようになったスラング。」と書いてあるんですが、これだろうか?
neatoで画像検索してもロボット掃除機(ルンバみたいなやつ)しか出てこない。
naato ballで画像検索するとむぎゅっと握りつぶすおもちゃ(?)が出てきます。出てきたグラフとか「バネ」という言葉のイメージからするともしかしたらこれなのかな?


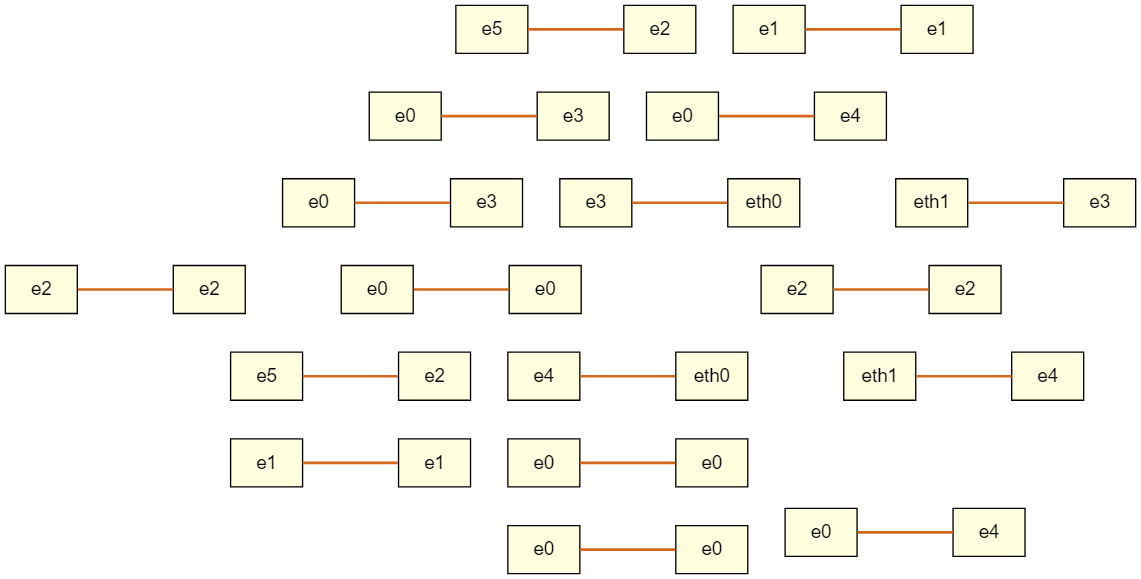
Polygone-basedのネットワーク図(neato)

HTML-like labelのネットワーク図(neato)
Polygone-basedはsubgraph(cluster)が消えているのでもはや何の意味もない図になっていますね。
global energy functionの最小化を試みるとか言われても無学すぎて何もわからないんですけど、HTML-like labelはかなり密着しています。
fdp
stands for Force Directed Placement.
“spring model” layouts similar to those of neato, but does this by reducing forces rather than working with energy.
fdp implements the Fruchterman-Reingold heuristic including a multigrid solver that handles larger graphs and clustered undirected graphs.
強制的な向きあり配置? またenergyとか言ってるし…

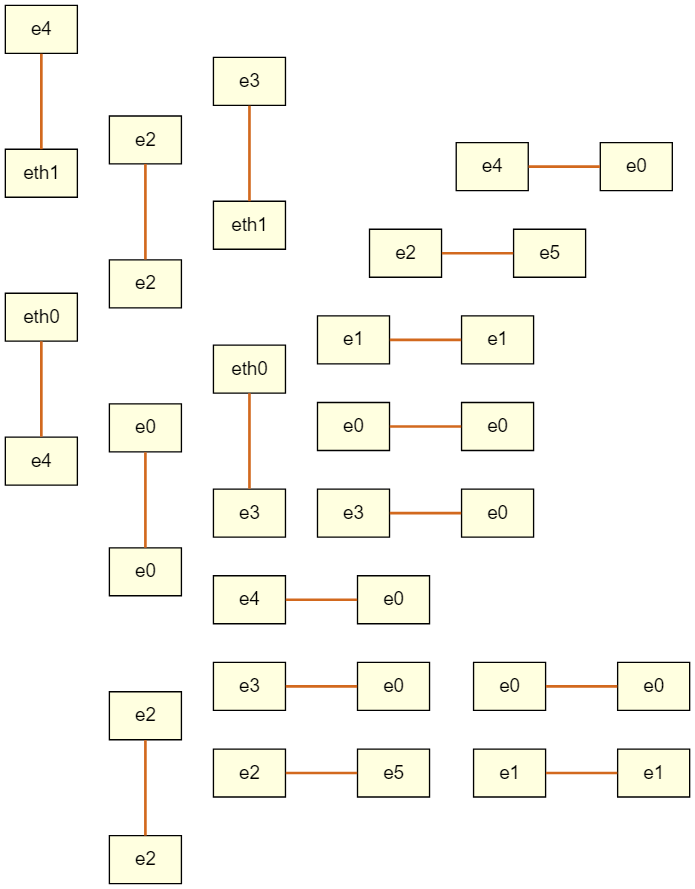
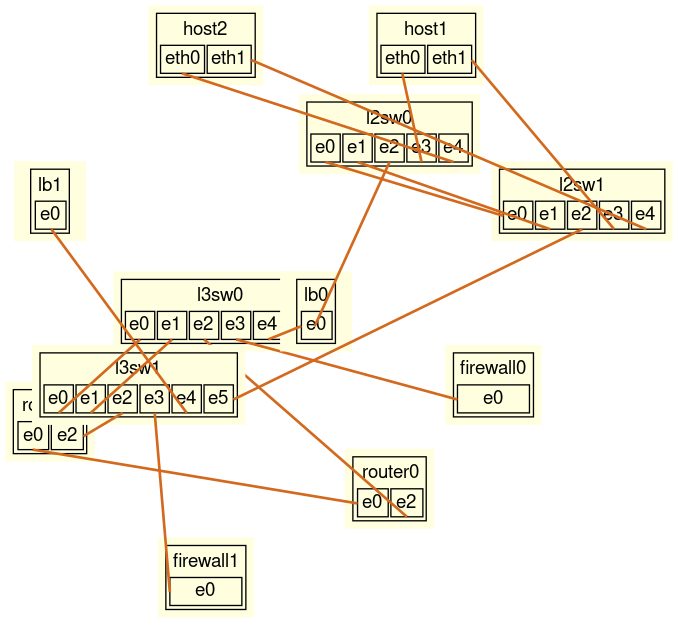
Polygone-basedのネットワーク図(fdp)

HTML-like labelのネットワーク図(fdp)
ネットワーク図としては見たことない配置ですが、個人的には結構好きです。L2、L3スイッチを中心とした構成になっているのが視覚化されていますね。
sfdp
stands for Scalable Force Directed Placement.
sfdp is a fast, multilevel, force-directed algorithm that efficiently layouts large graphs, outlined in “Efficient and High Quality Force-Dircted Graph Drawing”1.
Multiscale version of the fdp layout, for the layout of large graphs.
fdpをスケーラブルにしたとのこと。
Polygone-basedのネットワーク図(sfdp)
HTML-like labelのネットワーク図(sfdp)
Polygone-basedはsubgraphが消えてしまいました。
HTML-like labelはfdpよりもちょっと広がりましたね。
ちなみに、オンラインエディタではsfdpレイアウトエンジンが使えなかったので、上記の図はコマンドラインで作成しました。
polygone.gv、htmllike.gvにDOT形式のテキストファイルを格納しておいて、-Tで出力フォーマット指定、-Kでレイアウトエンジン指定、-oで出力ファイル名指定です。
# dot -Tpng -Ksfdp -opolygone_sfdp.png polygone.gv
# dot -Tpng -Ksfdp -ohtmllike_sfdp.png htmllike.gv
circo
circular layout.
After Six and Tollis 1999, Kauffman and Wiese 2002.
This is suitable for certain diagrams of multiple cyclic structures, such as certain telecommunications networks.
円形のレイアウト。
circleとかcircularなら分かるんですよ。circoって何?
イタリア語とスペイン語でcircoはサーカスという意味らしいんですが、これ?
Polygone-basedのネットワーク図(circo)

HTML-like labelのネットワーク図(circo)
Polygone-basedはsubgraphが消えてしまいました。
HTML-like labelは確かに円形に配置されています。多対多のルータが接続するWAN構成の図をきれいに描けそうです。
twopi
radial layout.
After Graham Wills 1997.
Nodes are placed on concentric circles depending their distance from a given root node.
You can set the root node, or let twopi do it.
放射状のレイアウト。これはtwo pi、つまり2πのことかな。
Polygone-basedのネットワーク図(twopi)

HTML-like labelのネットワーク図(twopi)
Polygone-basedはsubgraphが消えてしまいました。
HTML-like labelは同心円状なのかな?どれが中心なんでしょう?host1?
中心に来るノードは指定しなければGraphvizが選んでくれるそうです。自分で指定するとどうなるでしょうか?
dotコマンドに-Gコマンドを付けるとattributeを設定できます。twopiレイアウトの中心はroot attributeで指定します。
# dot -Tpng -Ktwopi -ohtmllike_twopi.png -Groot=router0 htmllike.gv
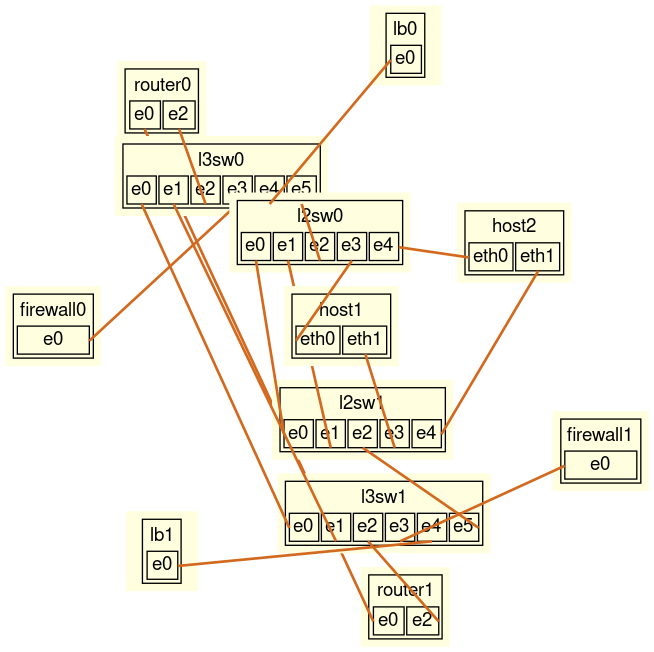
HTML-like labelのネットワーク図(twopi, root=router0)
router0が中心です。点対称っぽい感じでいいですね。

HTML-like labelのネットワーク図(twopi, root=l3sw0)
l3sw0が中心です。neatoに似ているような。
HTML-like labelのネットワーク図(twopi, root=lb0)
ネットワークトポロジ的には端っこにいるlb0を同心円の中心にしてみました。さっきのl3sw0を中心にしたときは他の装置がl3sw0から近いところに集まっていて図が密集しすぎていたのに対し、これは適度な距離感があります。
HTML-like labelのネットワーク図(twopi, root=host1)
rootを指定しないで作成した図と同じですね。やはり最初の図はhost1が中心だったようです。
osage
draws clustered graphs.
As input, osage takes any graph in the dot format.
osage draws the graph recursively. At each level, there will be a collection of nodes and a collection of cluster subgraphs. The internals of each cluster subgraph are laid out, then the cluster subgraphs and nodes at the current level are positioned relative to each other, treating each cluster subgraph as a node.
At each level, the nodes and cluster subgraphs are viewed as rectangles to be packed together. At present, edges are ignored during packing. Packing is done using the standard packing functions. In particular, the graph attributes pack and packmode control the layout. Each graph and cluster can specify its own values for these attributes. Remember also that a cluster inherits its attribute values from its parent graph.
After all nodes and clusters, edges are routed based on the value of the splines attribute.
クラスタ状のグラフとのことなんですが、全然分からないんですよね。
osageって何なのか? 日本語の「お下げ」(髪の毛の編み方?)? 違う気もしますね。
ネイティブアメリカンの部族にosage族という人たちがいるらしいのですが、この人たちに関連している?
説明も分かり辛いんですよね。nodeとsubgraphを再帰的に並べていく?
図を見た方が早いと思ったのですが。

Polygone-basedのネットワーク図(osage)

HTML-like labelのネットワーク図(osage)
やはり分からない…
clusterにはブドウの房という意味もあるらしいんですが、ネットワーク図がブドウに見えてきたのはたまたま?
patchwork
draws clustered graphs using a squarified treemap layout.
As input, patchwork takes any graph in the dot format.
Each cluster is given an area based on the areas specified by the clusters and nodes it contains. The areas of nodes and empty clusters can be specified by the area attribute. The default area is 1.
The root graph is laid out as a square. Then, recursively, the region of a cluster or graph is partitioned among its top-level nodes and clusters, with each given a roughly square subregion with its specified area.
コマンドラインで図を作成しました。
# dot -Tpng -Kpatchwork -ohtmllike_patchwork.png htmllike.gv
# dot -Tpng -Kpatchwork -opolygone_patchwork.png polygone.gv
Polygone-basedのネットワーク図(patchwork)

HTML-like labelのネットワーク図(patchwork)
無理です… もう何も分からない… エッジ(ケーブル)はどこ行った?
まとめ
グラフ作成用ツールであるGraphvizをネットワーク作成に流用してみたこと、Graphvizは複数のレイアウトエンジンを持つことから試しにいろんなレイアウトの図を描いてみました。
やはりネットワーク図としてはデフォルトのdotレイアウトが一番なのですが、fdp、twopiも結構個人的には好きだな、という印象でした。
Discussion