多重共線性の検証(線形回帰とRandomForest)
はじめに
私の職場では「多重共線性はだめだ!多重共線性を取り除け!」とよく叫ばれています。
ただ、多重共線性の説明をみると大体が線形回帰の例のみで、それ以外のケースはどうなのかについてはあまり言及されていませんでした。
そこで、今回は線形回帰(sklearnのLinearRegression)に加えて、非線形の回帰手法であるRandomForest(こちらもsklearnのRandomForestRegressor)で多重共線性があるのかを検証したいと思います。
また、多重共線性はモデルの予測精度にも影響を与えるものだと勘違いしていましたので、RMSEもどれくらい変わるのかを今回の検証では含めております。
検証データ
多重共線性を持ったデータセットを作成するために、以下のコードを作成しました。
x1がランダムに生成され、x2はx1にノイズを乗せたものになります。
そして、yは3×X1+2×X2で計算されたものに誤差を乗せたものとします。
# 説明変数 x1, x2 を生成
x1 = np.random.randn(n)
noise = np.random.randn(n) * 0.1
x2 = x1 + noise

# 被説明変数 y を生成
error = np.random.randn(n)
y = 3*x1 + 2*x2 + error
相関係数を確認すると、変数間に強い相関を持っていることがわかります。
print("相関係数")
print(np.corrcoef(x1, x2))
相関係数
[[1. 0.99476756]
[0.99476756 1. ]]
検証方法
以下のような流れで検証を進めました。
- 各特徴量の大きさを保存するlist・RMSEを保存するlistを作成
- モデルをfitさせ、特徴量の係数or重要度を保存
- テストデータをトレーニングデータと同じように生成
- モデルに予測させ、RMSEを計算・保存
- 2~4のステップを100回繰り返し
- 1のlistをヒストグラムで可視化&平均と標準偏差を評価します。
結果
非常に冗長なコードになったので隠します。
また、比較として、多重共線性がないデータセットも作成し用いています。
多重共線性がない場合のLinearRegressionでの結果
intercept_list = []
coefficients_list = []
RMSE_list = []

for i in range(0, 100):

    # データのサイズ
    n = 100

    # 説明変数 x1, x2 を生成
    x1 = np.random.randn(n)
    noise = np.random.randn(n) * 0.1
    x2 = np.random.randn(n)

    # 被説明変数 y を生成
    error = np.random.randn(n)
    y = 3*x1 + 2*x2 + error

    # データを列方向にスタック
    X = np.column_stack((x1, x2))

    # OLSでモデルを推定
    model = LinearRegression().fit(X, y)

    # 回帰式の切片と係数
    intercept_list.append(model.intercept_)
    coefficients_list.append(model.coef_)

    # testデータを生成
    nn = 20
    x1_test = np.random.randn(nn)
    noise = np.random.randn(nn) * 0.1
    x2_test = x1_test + noise

    # 被説明変数 y を生成
    error = np.random.randn(nn)
    y_test = 3*x1_test + 2*x2_test + error

    # データを列方向にスタック
    X_test = np.column_stack((x1_test, x2_test))

    # 予測値を計算
    y_pred = model.predict(X_test)

    # RMSEを計算
    RMSE = np.sqrt(mean_squared_error(y_test, y_pred, squared=False))
    RMSE_list.append(RMSE)

import matplotlib.pyplot as plt
coefficients_list = pd.DataFrame(coefficients_list)
no_MC_ols_result = pd.DataFrame(columns=["mean", "std"])

plt.hist(intercept_list, bins=20)
plt.xlim(-0.3, 0.3)
plt.ylim(0, 15)
plt.show()

no_MC_ols_result.loc["intercept", "mean"] = np.mean(intercept_list)
no_MC_ols_result.loc["intercept", "std"] = np.std(intercept_list)
print("切片の平均値: ", np.mean(intercept_list))
print("切片の標準偏差: ", np.std(intercept_list))

plt.hist(coefficients_list.iloc[:, 0], bins=20)
plt.xlim(0, 6)
plt.ylim(0, 15)
plt.show()

no_MC_ols_result.loc["x1", "mean"] = coefficients_list.iloc[:, 0].mean()
no_MC_ols_result.loc["x1", "std"] = coefficients_list.iloc[:, 0].std()
print("x1の係数の平均値: ", coefficients_list.iloc[:, 0].mean())
print("x1の係数の標準偏差: ", coefficients_list.iloc[:, 0].std())

plt.hist(coefficients_list.iloc[:, 1], bins=20)
plt.xlim(-1, 5)
plt.ylim(0, 15)
plt.show()

no_MC_ols_result.loc["x2", "mean"] = coefficients_list.iloc[:, 1].mean()
no_MC_ols_result.loc["x2", "std"] = coefficients_list.iloc[:, 1].std()
print("x2の係数の平均値: ", coefficients_list.iloc[:, 1].mean())
print("x2の係数の標準偏差: ", coefficients_list.iloc[:, 1].std())

no_MC_ols_result.loc["RMSE", "mean"] = np.mean(RMSE_list)
no_MC_ols_result.loc["RMSE", "std"] = np.std(RMSE_list)
print("RMSEの平均値: ", np.mean(RMSE_list))
print("RMSEの標準偏差: ", np.std(RMSE_list))

display(no_MC_ols_result)
多重共線性がある場合のLinearRegressionでの結果
import numpy as np
from sklearn.linear_model import LinearRegression
from sklearn.metrics import mean_squared_error

intercept_list = []
coefficients_list = []
RMSE_list = []

for i in range(0, 100):
    # データのサイズ
    n = 100

    # 説明変数 x1, x2 を生成
    x1 = np.random.randn(n)
    noise = np.random.randn(n) * 0.1
    x2 = x1 + noise

    # 被説明変数 y を生成
    error = np.random.randn(n)
    y = 3*x1 + 2*x2 + error

    # データを列方向にスタック
    X = np.column_stack((x1, x2))

    # OLSでモデルを推定
    model = LinearRegression().fit(X, y)

    # 回帰式の切片と係数
    intercept_list.append(model.intercept_)
    coefficients_list.append(model.coef_)

    # testデータを生成
    nn = 20
    x1_test = np.random.randn(nn)
    noise = np.random.randn(nn) * 0.1
    x2_test = x1_test + noise

    # 被説明変数 y を生成
    error = np.random.randn(nn)
    y_test = 3*x1_test + 2*x2_test + error

    # データを列方向にスタック
    X_test = np.column_stack((x1_test, x2_test))

    # 予測値を計算
    y_pred = model.predict(X_test)

    # RMSEを計算
    RMSE = np.sqrt(mean_squared_error(y_test, y_pred, squared=False))
    RMSE_list.append(RMSE)

import matplotlib.pyplot as plt
coefficients_list = pd.DataFrame(coefficients_list)
ols_result = pd.DataFrame(columns=["mean", "std"])

plt.hist(intercept_list, bins=20)
plt.xlim(-0.3, 0.3)
plt.ylim(0, 15)
plt.show()

ols_result.loc["intercept", "mean"] = np.mean(intercept_list)
ols_result.loc["intercept", "std"] = np.std(intercept_list)
print("切片の平均値: ", np.mean(intercept_list))
print("切片の標準偏差: ", np.std(intercept_list))

plt.hist(coefficients_list.iloc[:, 0], bins=20)
plt.xlim(0, 6)
plt.ylim(0, 15)
plt.show()

ols_result.loc["x1", "mean"] = coefficients_list.iloc[:, 0].mean()
ols_result.loc["x1", "std"] = coefficients_list.iloc[:, 0].std()
print("x1の係数の平均値: ", coefficients_list.iloc[:, 0].mean())
print("x1の係数の標準偏差: ", coefficients_list.iloc[:, 0].std())

plt.hist(coefficients_list.iloc[:, 1], bins=20)
plt.xlim(-1, 5)
plt.ylim(0, 15)
plt.show()

ols_result.loc["x2", "mean"] = coefficients_list.iloc[:, 1].mean()
ols_result.loc["x2", "std"] = coefficients_list.iloc[:, 1].std()
print("x2の係数の平均値: ", coefficients_list.iloc[:, 1].mean())
print("x2の係数の標準偏差: ", coefficients_list.iloc[:, 1].std())

ols_result.loc["RMSE", "mean"] = np.mean(RMSE_list)
ols_result.loc["RMSE", "std"] = np.std(RMSE_list)
print("RMSEの平均値: ", np.mean(RMSE_list))
print("RMSEの標準偏差: ", np.std(RMSE_list))

display(ols_result)
まず、LinearRegressionでの多重共線性の影響を見てみます。

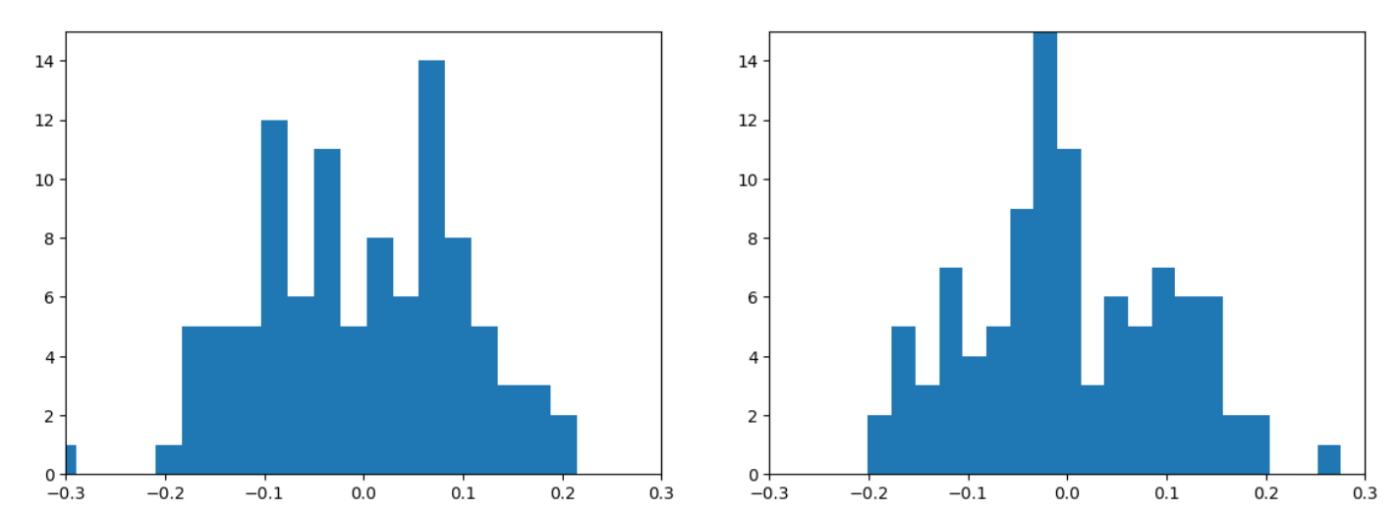
LinearRegressionの切片のヒストグラム(左:多重共線性なし、右:多重共線性あり)

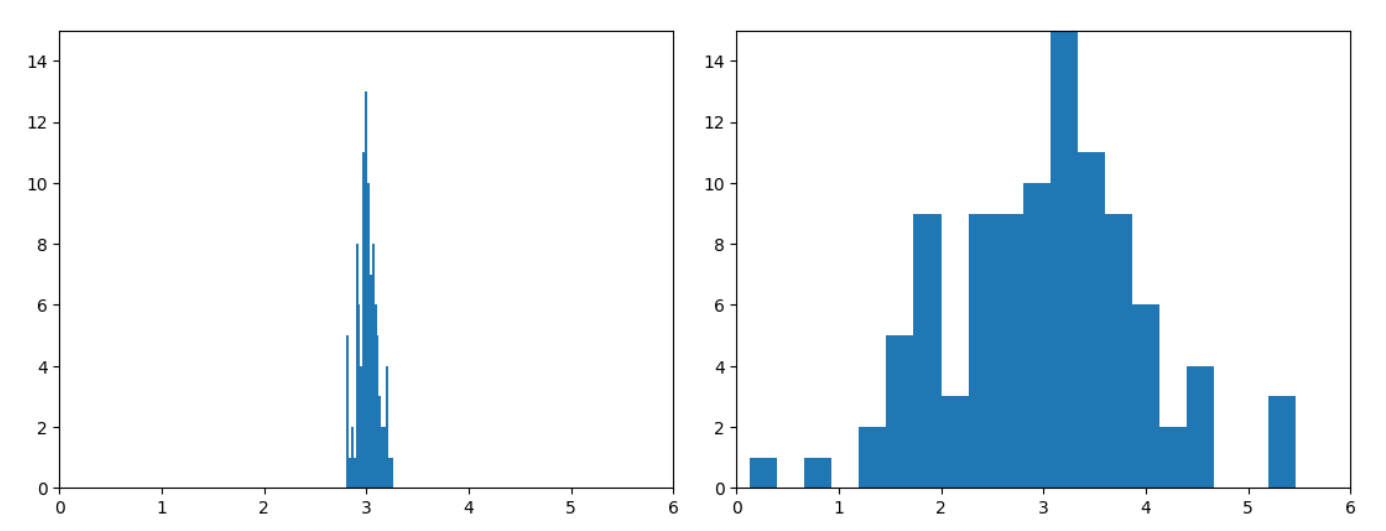
LinearRegressionのx1の係数のヒストグラム(左:多重共線性なし、右:多重共線性あり)

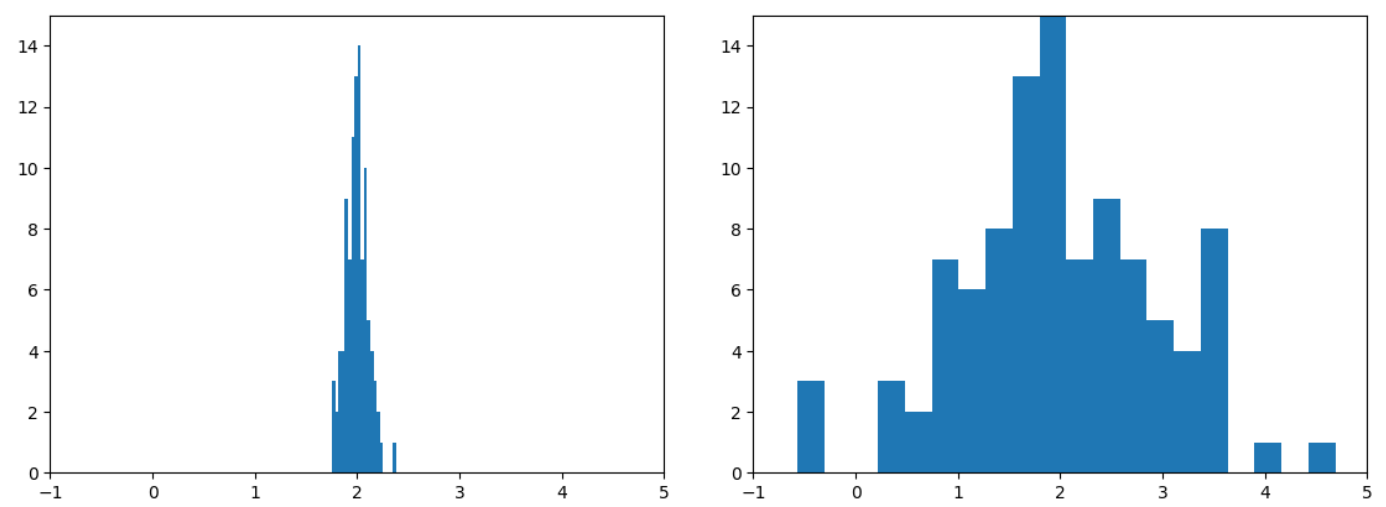
LinearRegressionのx2の係数のヒストグラム(左:多重共線性なし、右:多重共線性あり)
切片には影響が見られませんが、係数のほうはかなり結果が不安定になっているのが確認できます。
以下が、RMSEを含めた詳細な数値になります。
平均は多重共線性ありなしで差がありませんが、標準偏差の大きさが多重共線性ありだとかなり大きくなっています。
はじめにでも言及しましたが、私の勘違いで多重共線性はモデルの精度にも影響するものだと思っていましたが、今回の検証でそうではないことがわかりました。
多重共線性なし
| 平均 | 標準偏差 | |
|---|---|---|
| intercept | -0.00388 | 0.102578 |
| x1 | 3.013752 | 0.098172 |
| x2 | 1.997477 | 0.111237 |
| RMSE | 0.992322 | 0.079325 |
多重共線性あり
| 平均 | 標準偏差 | |
|---|---|---|
| intercept | 0.001987 | 0.09973 |
| x1 | 3.006065 | 0.956191 |
| x2 | 1.990663 | 0.962632 |
| RMSE | 0.994401 | 0.074514 |
多重共線性がない場合のRandomForestRegressionでの結果
from sklearn.ensemble import RandomForestRegressor

feature_importances_list = []

for i in range(0, 100):

    # データのサイズ
    n = 100

    # 説明変数 x1, x2 を生成
    x1 = np.random.randn(n)
    noise = np.random.randn(n) * 0.1
    x2 = np.random.randn(n)

    # 被説明変数 y を生成
    error = np.random.randn(n)
    y = 3*x1 + 2*x2 + error

    # データを列方向にスタック
    X = np.column_stack((x1, x2))

    # random forestでモデルを推定
    model = RandomForestRegressor(n_estimators=100).fit(X, y)

    # feature importanceを取得し、リストに追加
    feature_importances_list.append(model.feature_importances_)

    # testデータを生成
    nn = 20
    x1_test = np.random.randn(nn)
    noise = np.random.randn(nn) * 0.1
    x2_test = np.random.randn(nn)

    # 被説明変数 y を生成
    error = np.random.randn(nn)
    y_test = 3*x1_test + 2*x2_test + error

    # データを列方向にスタック
    X_test = np.column_stack((x1_test, x2_test))

    # 予測値を計算
    y_pred = model.predict(X_test)

    # RMSEを計算
    RMSE = np.sqrt(mean_squared_error(y_test, y_pred, squared=False))
    RMSE_list.append(RMSE)


import matplotlib.pyplot as plt
feature_importances_list = pd.DataFrame(feature_importances_list)
no_MC_rf_result = pd.DataFrame(columns=["mean", "std"])

plt.hist(feature_importances_list.iloc[:, 0], bins=20)
plt.xlim(0, 1)
plt.ylim(0, 15)
plt.show()

no_MC_rf_result.loc["x1", "mean"] = feature_importances_list.iloc[:, 0].mean()
no_MC_rf_result.loc["x1", "std"] = feature_importances_list.iloc[:, 0].std()
print("feature_importance[0]の平均値: ", feature_importances_list.iloc[:, 0].mean())
print("feature_importance[0]の標準偏差: ", feature_importances_list.iloc[:, 0].std())

plt.hist(feature_importances_list.iloc[:, 1], bins=20)
plt.xlim(0,1)
plt.ylim(0, 15)
plt.show()

no_MC_rf_result.loc["x2", "mean"] = feature_importances_list.iloc[:, 1].mean()
no_MC_rf_result.loc["x2", "std"] = feature_importances_list.iloc[:, 1].std()
print("feature_importance[1]の平均値: ", feature_importances_list.iloc[:, 1].mean())
print("feature_importance[1]の標準偏差: ", feature_importances_list.iloc[:, 1].std())

no_MC_rf_result.loc["RMSE", "mean"] = np.mean(RMSE_list)
no_MC_rf_result.loc["RMSE", "std"] = np.std(RMSE_list)
print("RMSEの平均値: ", np.mean(RMSE_list))
print("RMSEの標準偏差: ", np.std(RMSE_list))
display(no_MC_rf_result)
多重共線性がある場合のRandomForestRegressionでの結果
from sklearn.ensemble import RandomForestRegressor

feature_importances_list = []

for i in range(0, 100):

    # データのサイズ
    n = 100

    # 説明変数 x1, x2 を生成
    x1 = np.random.randn(n)
    noise = np.random.randn(n) * 0.1
    x2 = x1 + noise

    # 被説明変数 y を生成
    error = np.random.randn(n)
    y = 3*x1 + 2*x2 + error

    # データを列方向にスタック
    X = np.column_stack((x1, x2))

    # random forestでモデルを推定
    model = RandomForestRegressor(n_estimators=100).fit(X, y)

    # feature importanceを取得し、リストに追加
    feature_importances_list.append(model.feature_importances_)

    # testデータを生成
    nn = 20
    x1_test = np.random.randn(nn)
    noise = np.random.randn(nn) * 0.1
    x2_test = x1_test + noise

    # 被説明変数 y を生成
    error = np.random.randn(nn)
    y_test = 3*x1_test + 2*x2_test + error

    # データを列方向にスタック
    X_test = np.column_stack((x1_test, x2_test))

    # 予測値を計算
    y_pred = model.predict(X_test)

    # RMSEを計算
    RMSE = np.sqrt(mean_squared_error(y_test, y_pred, squared=False))
    RMSE_list.append(RMSE)
import matplotlib.pyplot as plt
feature_importances_list = pd.DataFrame(feature_importances_list)
rf_result = pd.DataFrame(columns=["mean", "std"])

plt.hist(feature_importances_list.iloc[:, 0], bins=20)
plt.xlim(0, 1)
plt.ylim(0, 15)
plt.show()

rf_result.loc["x1", "mean"] = feature_importances_list.iloc[:, 0].mean()
rf_result.loc["x1", "std"] = feature_importances_list.iloc[:, 0].std()
print("feature_importance[0]の平均値: ", feature_importances_list.iloc[:, 0].mean())
print("feature_importance[0]の標準偏差: ", feature_importances_list.iloc[:, 0].std())

plt.hist(feature_importances_list.iloc[:, 1], bins=20)
plt.xlim(0,1)
plt.ylim(0, 15)
plt.show()
rf_result.loc["x2", "mean"] = feature_importances_list.iloc[:, 1].mean()
rf_result.loc["x2", "std"] = feature_importances_list.iloc[:, 1].std()
print("feature_importance[1]の平均値: ", feature_importances_list.iloc[:, 1].mean())
print("feature_importance[1]の標準偏差: ", feature_importances_list.iloc[:, 1].std())

rf_result.loc["RMSE", "mean"] = np.mean(RMSE_list)
rf_result.loc["RMSE", "std"] = np.std(RMSE_list)
print("RMSEの平均値: ", np.mean(RMSE_list))
print("RMSEの標準偏差: ", np.std(RMSE_list))

display(rf_result)
次にRandomForestでの結果です。

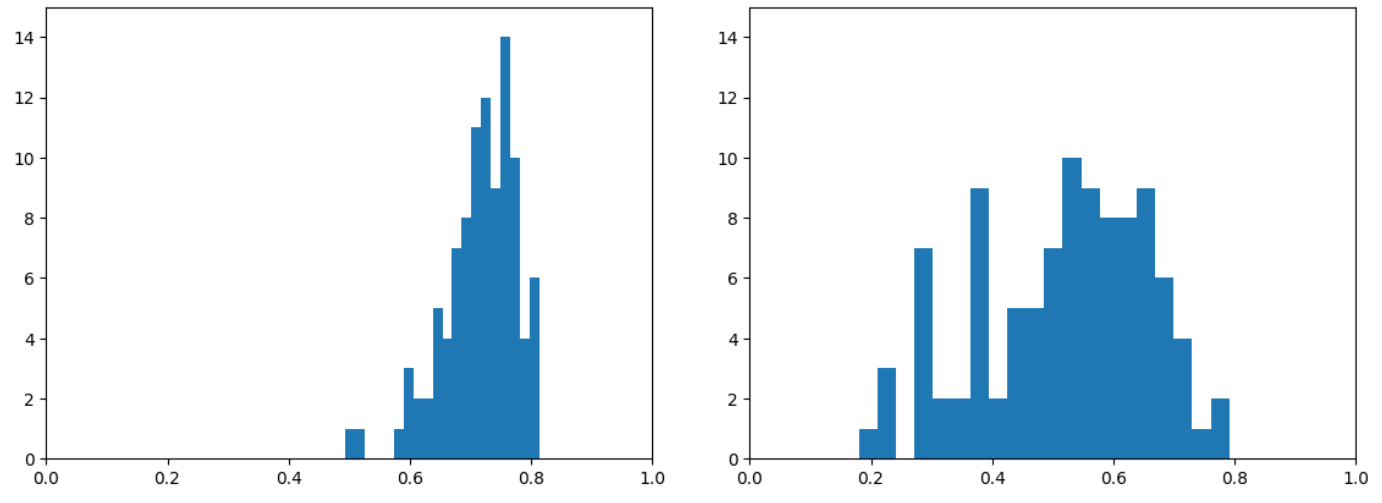
RandomForestRegressionのx1の変数重要度のヒストグラム(左:多重共線性なし、右:多重共線性あり)

RandomForestRegressionのx2の変数重要度のヒストグラム(左:多重共線性なし、右:多重共線性あり)
RandomForestでも多重共線性の影響が出てくることがわかります。
以下に、詳細な数値を表示しています。
線形回帰の場合だと、平均にはそれほど差がなかったのに対して、RandomForestだと値が異なっていることがわかります。
また、線形回帰の場合と同じく、標準偏差の大きさも多重共線性があるほうが大きくなっています。
ただ、やはりRMSEに関してはそれほど違いがないことがわかります。
多重共線性なし
| 平均 | 標準偏差 | |
|---|---|---|
| x1 | 0.714975 | 0.061805 |
| x2 | 0.285025 | 0.061805 |
| RMSE | 1.077309 | 0.117777 |
多重共線性あり
| 平均 | 標準偏差 | |
|---|---|---|
| x1 | 0.518635 | 0.138601 |
| x2 | 0.481365 | 0.138601 |
| RMSE | 1.034296 | 0.097545 |
結論
- 線形回帰だけでなく、非線形回帰の場合も多重共線性が起こる場合がある。
- 予測精度のみを考えるのであれば、多重共線性があっても大丈夫?
Discussion