Go パッケージのクラス図を PlantUML で描く
今回は軽く小ネタで。
Go で作ったパッケージを UML 図で表せたらいいのに,と思ったことはないだろうか。そう思う人は結構いるらしく,いろんなツールが公開されている。それらの中でも今回は jfeliu007/goplantuml を紹介する。
goplantuml は Go パッケージを解析するためのパーサと,それを使った CLI (Command-Line Interface) ツールで構成されている。また,このパッケージを使った Dumels という Web サービスもあるらしい。今回は CLI ツールの方を試してみる。
CLI ツールのダウンロードとビルド
バイナリは用意されてないようなので,おとなしく go get コマンドでダウンロード&ビルドする。モジュール・モードが on になっているなら,以下で無問題。
$ go get github.com/jfeliu007/goplantuml/cmd/goplantuml@latest

$ goplantuml -h
Usage of goplantuml:
  -aggregate-private-members
    	Show aggregations for private members. Ignored if -show-aggregations is not used.
  -hide-connections
    	hides all connections in the diagram
  -hide-fields
    	hides fields
  -hide-methods
    	hides methods
  -ignore string
    	comma separated list of folders to ignore
  -notes string
    	Comma separated list of notes to be added to the diagram
  -output string
    	output file path. If omitted, then this will default to standard output
  -recursive
    	walk all directories recursively
  -show-aggregations
    	renders public aggregations even when -hide-connections is used (do not render by default)
  -show-aliases
    	Shows aliases even when -hide-connections is used
  -show-compositions
    	Shows compositions even when -hide-connections is used
  -show-connection-labels
    	Shows labels in the connections to identify the connections types (e.g. extends, implements, aggregates, alias of
  -show-implementations
    	Shows implementations even when -hide-connections is used
  -show-options-as-note
    	Show a note in the diagram with the none evident options ran with this CLI
  -title string
    	Title of the generated diagram
よしよし。
パッケージの解析
解析を行うにはパッケージのあるディレクトリを引数として渡せばよい。
$ goplantuml ~/go/src/github.com/spiegel-im-spiegel/pa-api > pa-api.puml
解析結果は PlantUML の記述形式で標準出力に出力されるので,適当にリダイレクトしておく。あとは PlantUML を使って画像データに変換すればよい。
java -jar /path/to/plantuml.jar -charset UTF-8 pa-api.puml
結果はこんな感じ。
ちゃんとパッケージ単位でまとめられているのが分かるだろう。なお -recursive オプションを付けるとサブディレクトリのパッケージも再帰的に解析してくれる。本来 UML 図を描くなら多重度が必須だが,今回はコードから図を起こしてるのだから重要ではあるまい。
ドキュメンテーションのオトモにどうぞ。
Windows では dot コマンドに注意
Windows 版 Graphviz 2.44 に含まれる dot コマンドを使う場合[1],コマンドプロンプトで dot.exe コマンドのあるフォルダまで降りて dot -c コマンドを打っておく必要があるらしい。
おまけ
拙作の spiegel-im-spiegel/depm を使えばモジュール単位の依存関係を可視化できる。たとえばこんな感じ。
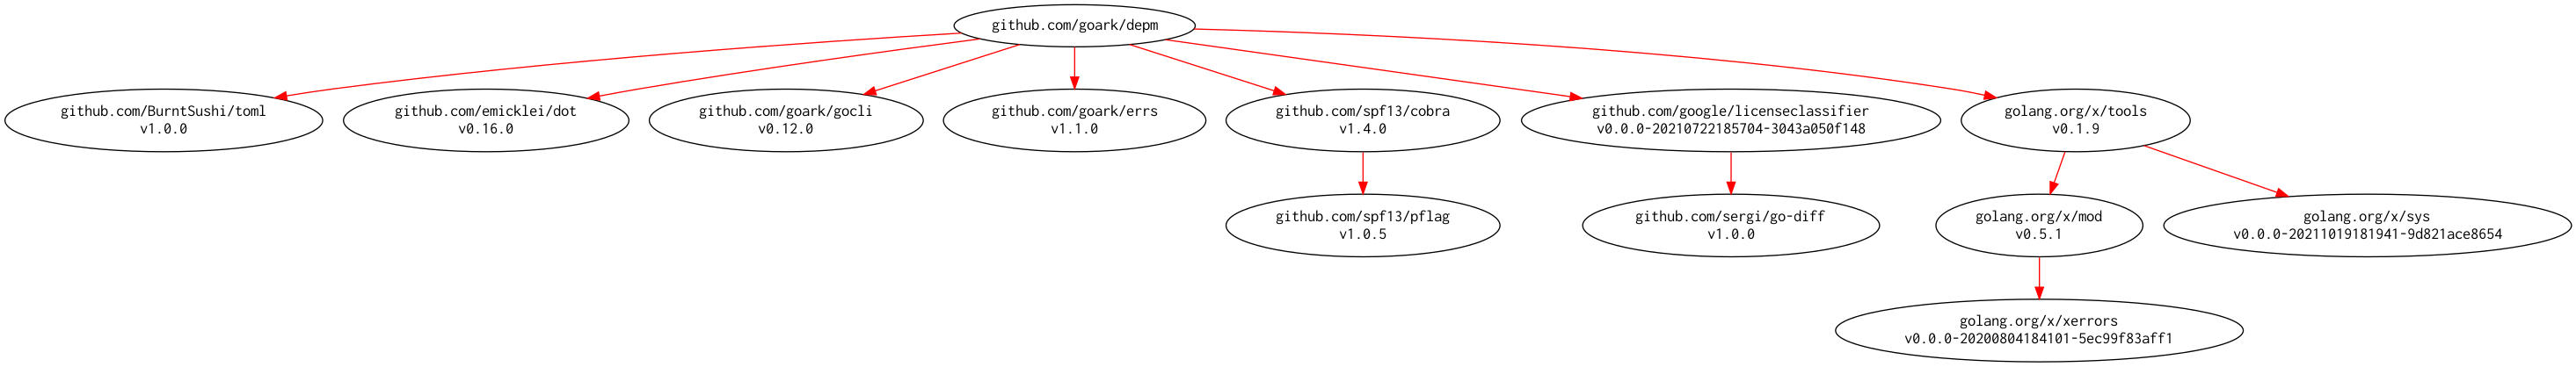
詳しくは以下の紹介ページを参考にどうぞ。
以上,広告でした(笑)
参考
- bykof/go-plantuml: Generate plantuml diagrams from go source files or directories
- 真面目に PlantUML (1) : PlantUML のインストール
- 真面目に PlantUML (3) : クラス図
Discussion