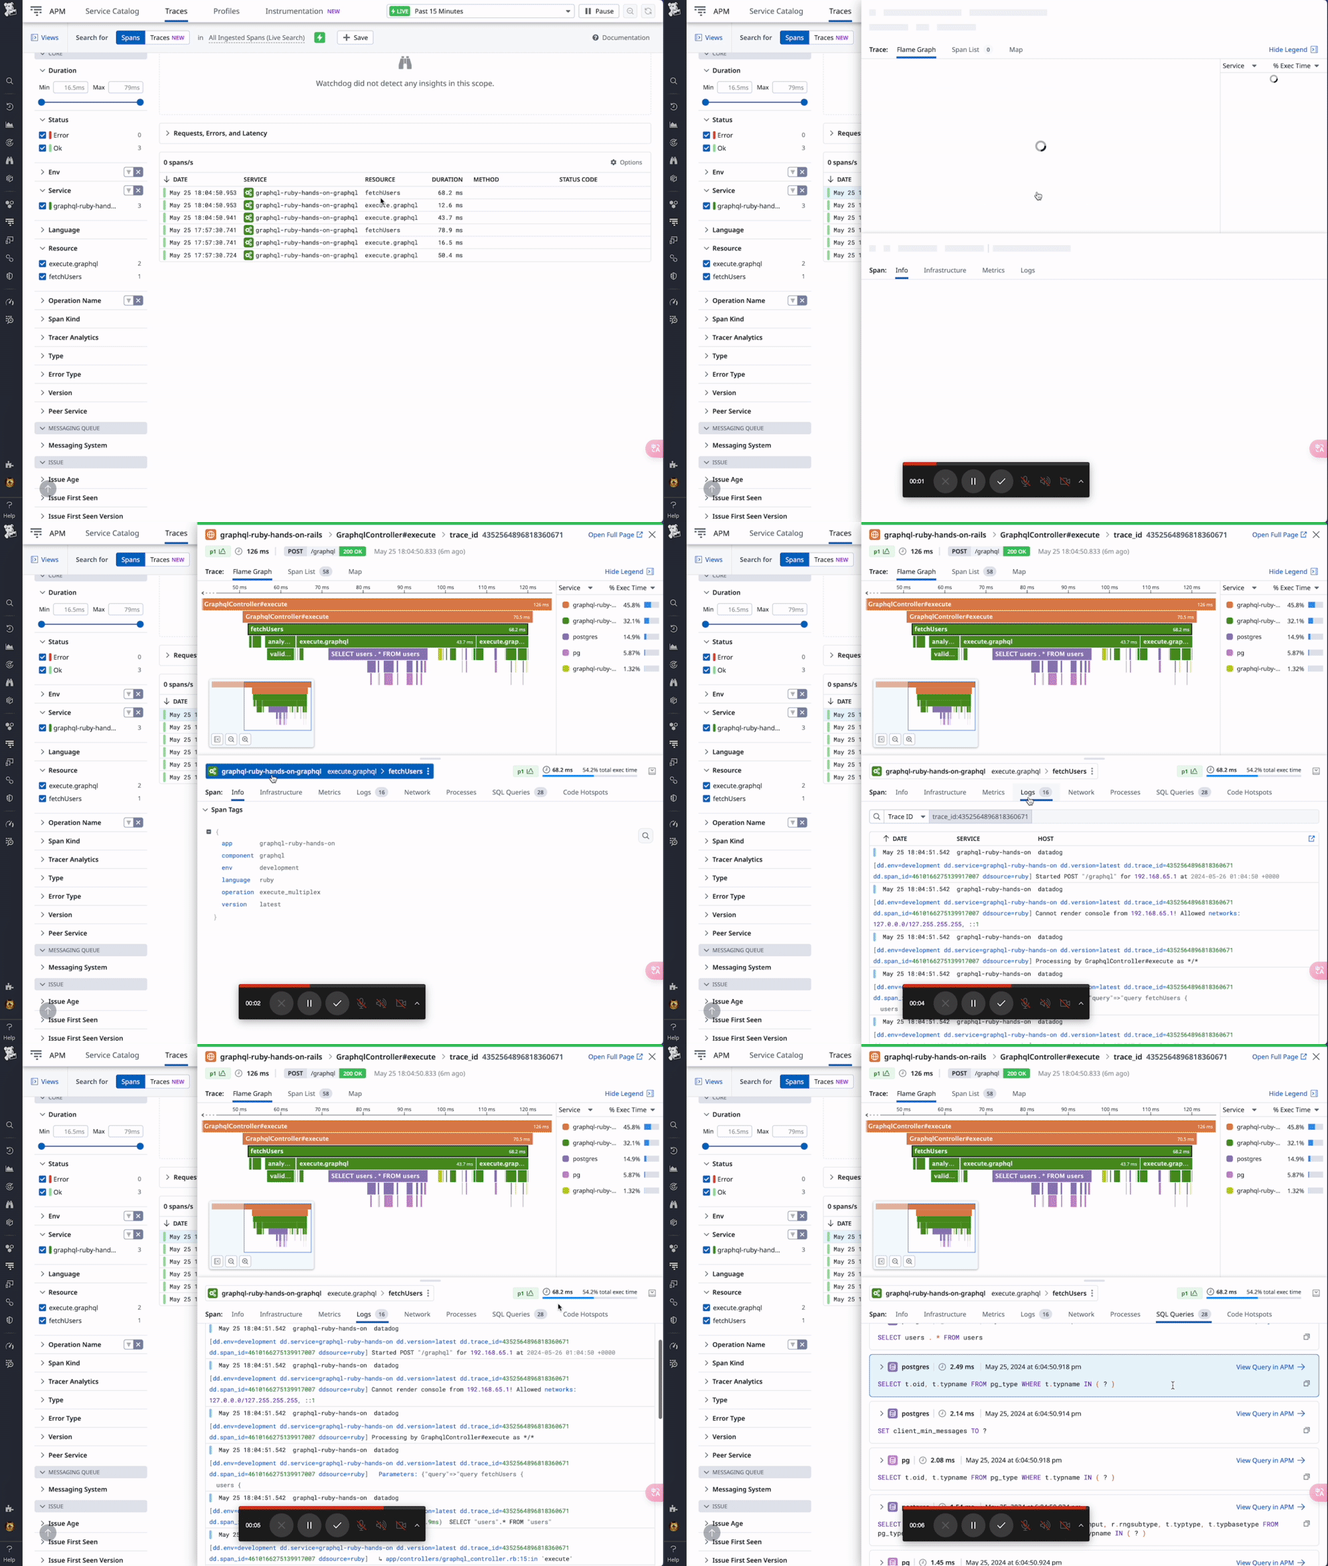
Tracing Rails & GraphQL API in Docker Compose with Datadog APM
Originally published at samuraikun.dev/articles/datadog-apm-in-ruby-on-rails-for-observability
Motiavation
Most of Rails developers often manage local Rails app on Docker Compose. One day, I struggled with researching of long latency performance issue.
Of course, production environment has already monitored system performance by some metrics and integration of Datadog APM.
However, it’s the best that is finding performance issues before production deployment.
So that’s why, I tried to incorporate Datadog APM to local rails app in order to find early performance issues.
Why Datadog APM?
The main reason is Datadog APM can visualize overall app execution flows as trace.
It is a Observability-Engineering-based approach.
What is “Observability Engineering”?
“Observability Engineering” is the practice of instrumenting and monitoring systems to ensure they are operating correctly and to identify any issues. It involves collecting and analyzing metrics, logs, and traces to gain insight into the internal state of an application. This approach enables developers and operators to understand how their systems behave, diagnose problems, and improve performance and reliability.
Specifically, by adopting a trace-first investigation approach instead of a log-first one, it becomes easier for team members, even those who are not the most experienced veterans, to investigate and understand the system. This shift enhances the overall efficiency and effectiveness of the team in troubleshooting and maintaining the application. Observability Engineering helps in creating a more resilient and efficient system by providing a comprehensive view of the system's operations and facilitating proactive troubleshooting.
Requirements
- Ruby v3.3.1
- Ruby on Rails v7.1
- GraphQL API/graphql-ruby
- Sidekiq v7
- Datadog APM
- ddtrace gem
- Docker Compose
- PostgreSQL
- Redis
TL;DR: Implementation Details and Code
I have documented this process step-by-step in a pull request.
https://github.com/samuraikun/graphql-ruby-hands-on/pull/11
Setup
Rails Setup
Based on below repository.
The repo has already setup Ruby and Rails, GraphQL API and Sidekiq.
https://github.com/samuraikun/graphql-ruby-hands-on
Datadog APM Setup
Create Account of Datadog
If you haven’t start Datadog yet, It provides free trial plan.
↓ The page of getting started Datadog

Add ddtrace gem to Gemfile
gem "ddtrace", require: "ddtrace/auto_instrument"
Create Dockerfile for Datadog Agent
docker/datadog/Dockerfile
FROM public.ecr.aws/datadog/agent:latest AS datadog-agent
Add settings for Datadog to docker-compose.yml
- Full content of
docker-compose.yml
services:
  app: &app
	  build:
		  context: .
      dockerfile: docker/app/Dockerfile
    environment:
      ...
      DD_AGENT_HOST: datadog-agent
      DD_ENV: development
      DD_SERVICE: "graphql-ruby-hands-on"
      DD_VERSION: latest
      DD_TRACE_AGENT_PORT: 8126
      DD_TRACE_STARTUP_LOGS: false
  ...

  # NEW
  datadog-agent:
    build:
      context: .
      dockerfile: docker/datadog/Dockerfile
    container_name: datadog-agent
    env_file: .env
    environment:
      DD_API_KEY: ${DD_API_KEY}
      DD_ENV: development
      DD_VERSION: latest
      DD_SITE: "us3.datadoghq.com" # It depends on your datadog host.
      DD_HOSTNAME: "datadog"
      DD_SERVICE: "graphql-ruby-hands-on"
      DD_APM_ENABLED: true
      DD_APM_NON_LOCAL_TRAFFIC: true
      DD_LOGS_ENABLED: true
      DD_LOGS_CONFIG_CONTAINER_COLLECT_ALL: true
    volumes:
      - /var/run/docker.sock:/var/run/docker.sock:ro
      - /proc/:/host/proc/:ro
      - /sys/fs/cgroup/:/host/sys/fs/cgroup:ro
      - /var/lib/docker/containers:/var/lib/docker/containers:ro
      - log-data:/workspace/log
    networks:
      - default
Add API Key to .env
- If you create Datadog account, you can get API Key from Datadog API Key page.
BINDING='0.0.0.0'
SOLARGRAPH_SOLARGRAPH_CACHE=/workspace/.solargraph
DB_HOST=postgres
DB_USER=postgres
DB_PASSWORD=password
DD_API_KEY=xxxx # <- here
Add Rails initializer for tracing Rails & Sidekiq on Datadog APM
config/initializers/datadog.rb
Datadog.configure do |c|
  service_name = "graphql-ruby-hands-on"
  c.tags = { env: Rails.env, app: service_name }
  c.tracing.instrument :rails, service_name: "#{service_name}-rails"
  c.tracing.instrument :sidekiq, service_name: "#{service_name}-sidekiq"
  c.tracing.sampling.default_rate = 1.0 # default is 1.0
  c.tracing.enabled = true
end
Add setting for tracing GraphQL
app/graphql/workspace_schema.rb- ref https://docs.datadoghq.com/tracing/trace_collection/automatic_instrumentation/dd_libraries/ruby/#graphql
class WorkspaceSchema < GraphQL::Schema
  mutation(Types::MutationType)
  query(Types::QueryType)

  ...

  # Add here!
  use GraphQL::Tracing::DataDogTracing, service: 'graphql-ruby-hands-on-graphql'

  ...
end
Then, restart Docker Compose. The Rails app is traced on Datadog APM. 🎉

Connect Traces and Logs
Not only does Datadog show tracing of app executions, but it can also connect between traces and related logs like below.

Step1: Change Rails logs to JSON
Use lograge gem for logging
https://github.com/roidrage/lograge
Gemfile
gem "lograge"
gem "lograge-sql"
Create Custom JSON Logger
lib/json_log_formatter.rb
class JsonLogFormatter < Logger::Formatter
  def call(severity, time, progname, message)
    log = {
      timestamp: time.iso8601(6),
      level:     severity,
      progname:,
      message:,
    }

    "#{log.to_json}\n"
  end
end
Create config/initializers/lograge.rb
require 'lograge/sql/extension'
require Rails.root.join("lib/json_log_formatter")

Rails.application.configure do
  logger = ActiveSupport::Logger.new(Rails.root.join('log', "#{Rails.env}.log"))
  logger.formatter = JsonLogFormatter.new

  config.logger = ActiveSupport::TaggedLogging.new(logger)
  config.lograge.enabled = true
  config.lograge.formatter = Lograge::Formatters::Json.new
  config.lograge.keep_original_rails_log = true
  config.colorize_logging = false
  config.lograge_sql.keep_default_active_record_log = true
  config.lograge_sql.min_duration_ms = 5000 # milliseconds Defaults is zero
  config.lograge.custom_options = lambda do |event|
    {
      ddsource: 'ruby',
      params: event.payload[:params].reject { |k| %w(controller action).include? k },
      level: event.payload[:level],
    }
  end
end
Step2: Add Ruby log pipeline to Datadog Agent setting
To send Rails logs to Datadog, log to a file with Lograge and tail this file with Datadog Agent.
-
Create a
ruby.d/folder in theconf.d/Agent configuration directory. -
Create a
conf.yamlfile inruby.d/with the following content:docker/datadog/conf.d/ruby.d/conf.yamllogs: - type: file path: "/workspace/log/development.log" service: graphql-ruby-hands-on source: ruby sourcecategory: sourcecode -
Add
conf.yamltodocker/datadog/DockerfileFROM public.ecr.aws/datadog/agent:latest AS datadog-agent ADD docker/datadog/conf.d/ruby.d/conf.yaml /etc/datadog-agent/conf.d/ruby.d/conf.yaml
Full content of connecting traces to logs is below commit.
Monitoring
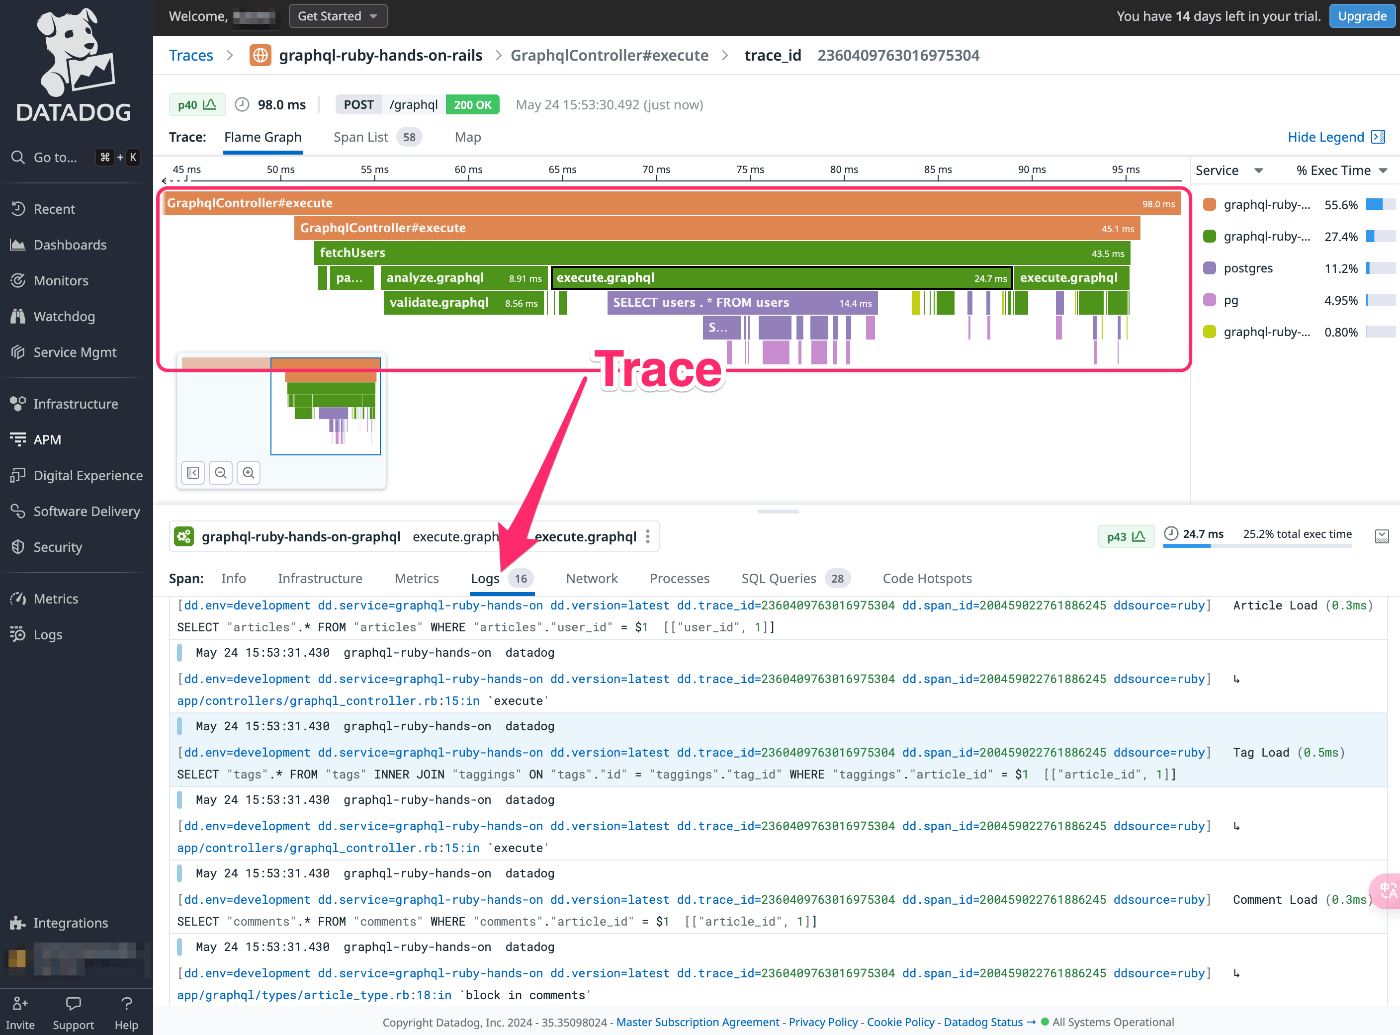
The preparation was done! Datadog APM shows tracing and logs such as Rails, Sidekiq, GraphQL, and SQL queries.
Trace GraphQL
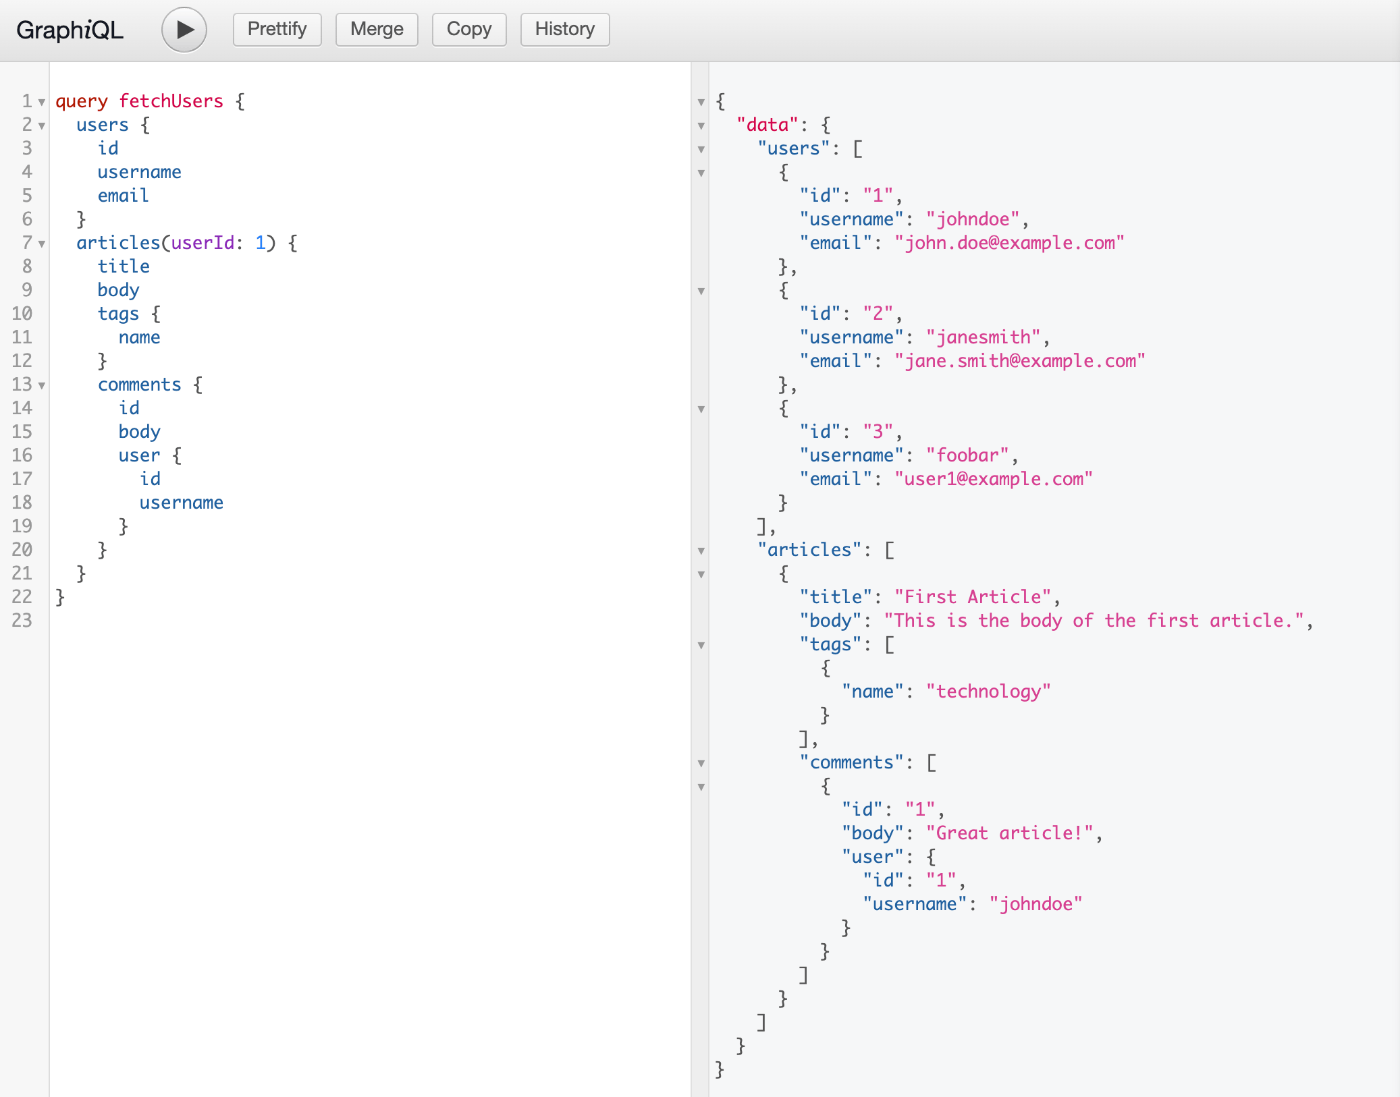
When I run following GraphQL query:

Datadog shows the trace related to GraphQL query e.x query fetchUsers :

Of course, It can check Rails app logs from trace:

Summary
In this article, I explained how I integrated a Ruby on Rails application built in a Docker Compose environment with Datadog APM. By implementing Datadog APM, it became possible to monitor the performance of applications in a local development environment and identify performance issues early.
The main steps I followed included creating a Datadog account, adding the required ddtrace gem, creating a Dockerfile for the Datadog agent, adding settings to docker-compose.yml, and setting the API key. Additionally, I covered the initial setup for tracing Rails, Sidekiq, and GraphQL.
Furthermore, I explained how I connected Datadog traces and logs. By changing Rails logs to JSON format and adding a Ruby log pipeline to the Datadog agent settings, I could link traces with related logs.
Ultimately, with Datadog APM, I was able to monitor traces and logs for Rails, Sidekiq, GraphQL, and SQL queries in one place. This setup helped in identifying and resolving performance issues early during the development phase.
Discussion