AWS でオブサーバビリティを完結させる Application Signals をデモしながら理解する
こんにちは。
ご機嫌いかがでしょうか。
"No human labor is no human error" が大好きな吉井 亮です。
オブサーバビリティの基盤を用意することは簡単ではありません。(難しくもありません)
そして、それを運用していくコストも考えなければなりません。顧客向けのサービスではないので、導入するにあたりプロジェクトオーナーを説得できない場合もあるかもしれません。
それが CloudWatch の画面だけで完結するとしたら素敵なことですね。
Grafana も Prometheus も Jaeger も要りません。CloudWatch だけです。
デモ
Docker compose で Application Signals を体験できるデモを作りました。このデモを触りながら Application Signals の機能を理解していきましょう。
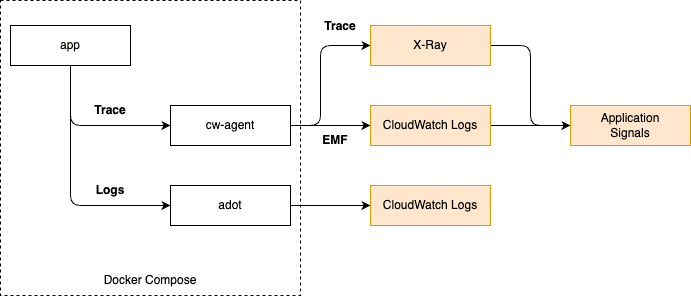
構成は以下になります。
EC2 上で3つのコンテナを立ち上げます。
app は OpenTelemetry の Java サンプルアプリケーションです。
ソースコードは Docs/Language APIs & SDKs/Java/Instrumentation にあります。
app には ADOT Java Agent を含めています。
cw−agent は CloudWatch Agent です。
app から送信したトレースを受け取り、X-Ray 形式に変換して X-Ray へ送信します。
また、トレースからメトリクスを生成し、EMF に変換して CloudWatch Logs へ送信します。CloudWatch 側で自動的に CloudWatch Metrics に表示してくれます。
adot は、AWS Distro for OpenTelemetry Collector です。
今回の構成では、app から送信されたログを受け取り、CloudWatch Logs へ送信する役割で使用しています。
準備
以下のリソースを作成してください。
CloudFormation テンプレート も用意しています。
- VPC
- 既存のものでも新規作成でも構いません
- パブリックサブネット
- 1つ
- 既存のものでも新規作成でも構いません
- EC2 インスタンスプロファイル
- 1つ
- 付与するポリシーは2つ
- AmazonSSMManagedInstanceCore
- CloudWatchAgentServerPolicy
- セキュリティグループ
- 1つ
- アウトバウンドは全て許可
- EC2 インスタンス
- 1台
- AMI は以下のいずれか
- Amazon ECS-Optimized Amazon Linux 2023 (AL2023) x86_64 AMI
- 上のインスタンスプロファイルとセキュリティグループをアタッチ
- パブリックサブネットに配置
- スペック -> 2vCPU, 8GB メモリー以上
- EBS ボリューム -> 30GB 以上
- CloudWatch Logs ロググループ
- 1つ
- グループ名 -> dice-server
EC2 インスタンスが立ち上がったら、以下のコマンドを実行してください。
$ cd ~
$ bash
$ sudo dnf install git zip unzip -y

$ git clone https://github.com/YoshiiRyo1/opsjaws-application-signals-handson.git --depth 1
$ cd opsjaws-application-signals-handson
$ ls

$ chmod +x ./chap1/setup.sh
$ ./chap1/setup.sh
上記コマンドを実行したら、一度 Session Manager からログアウトして再度ログインしてください。
Application Signals 有効
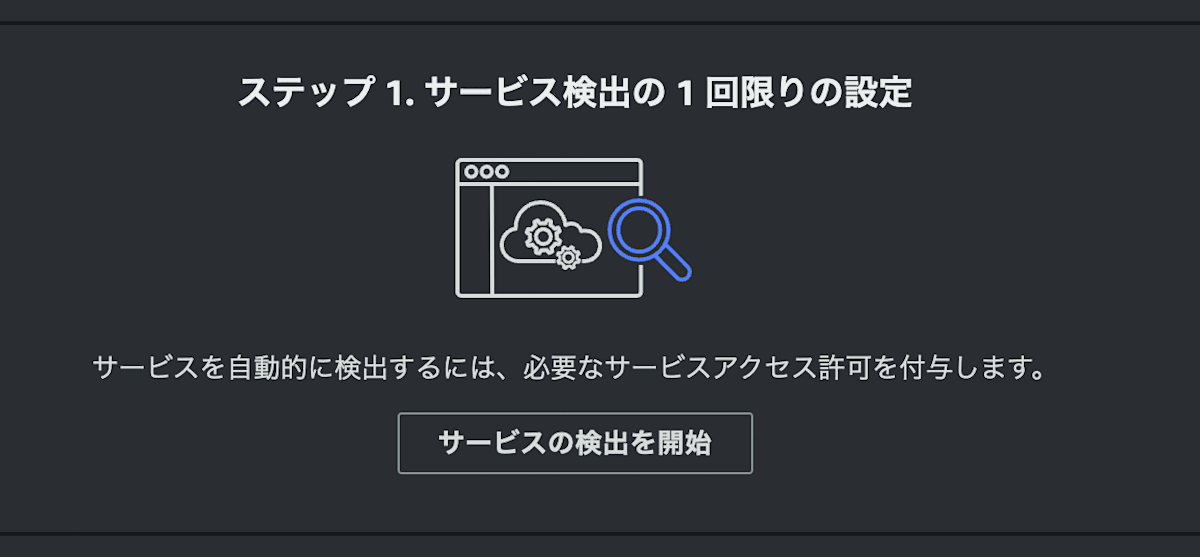
CloudWatch 画面から、左ペインの Application Signals → サービス を選択します。
初回アクセス時には以下のボタンが表示されます。サービスの検出を開始 をクリックしてください。
dice のビルド
クローンしたリポジトリの chap2 ディレクトリに移動します。
$ cd ~/opsjaws-application-signals-handson/chap2
build コマンドでアプリケーションをビルドします。
$ docker compose build
出力からエラーが無いことを確認してください。
コンテナ起動
ビルドが正常終了したならば、コンテナを起動します。
$ docker compose up -d
$ docker compose ps -a
## STATUS が全て Up になっていることを確認
リクエスト生成
load_generate.sh を実行して、app にリクエストを送信します。1回実行で1000リクエストを生成します。
リクエストが Application Signals に表示されるまで2~3分かかります。その間、何度が実行してみてください。
$ chmod +x load_generate.sh
$ ./load_generate.sh
シグナルの確認
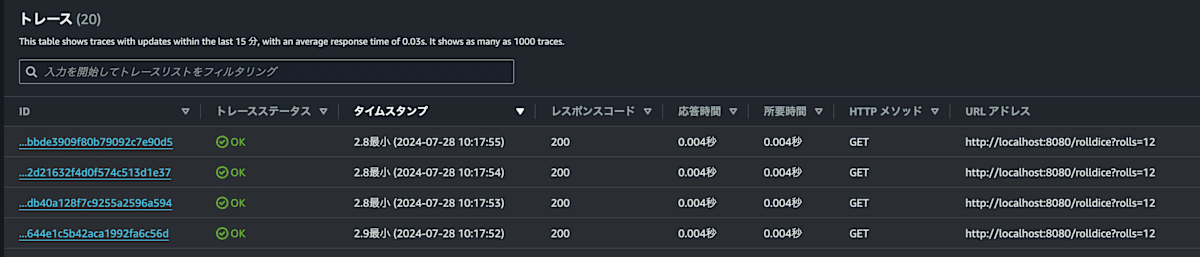
マネジメントコンソールの CloudWatch 画面から、左ペインの X-Ray トレース → トレース を選択します。
複数個のトレースが確認できるはずです。
トレースの1つをクリックします。詳細画面に遷移します。
ここでは関連するトレースマップ、トレースとスパン、トレースに関連したログが表示されています。
該当する API のレスポンスタイムやどの処理が遅いのか、どの処理が呼び出されているのかなどが確認できます。
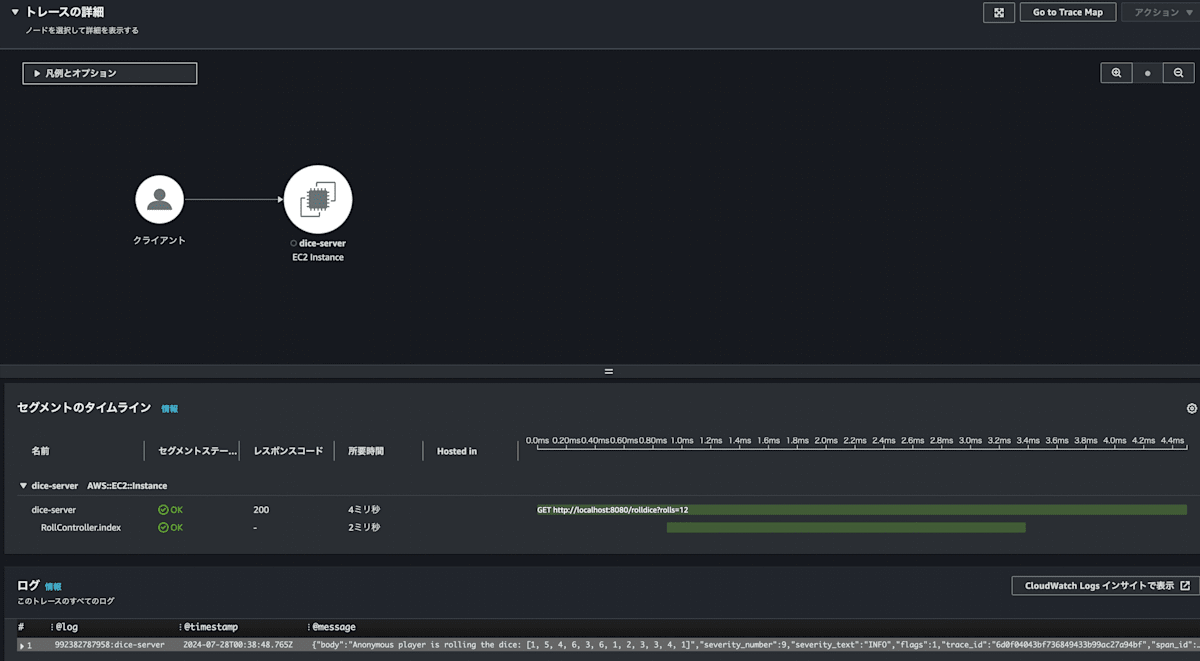
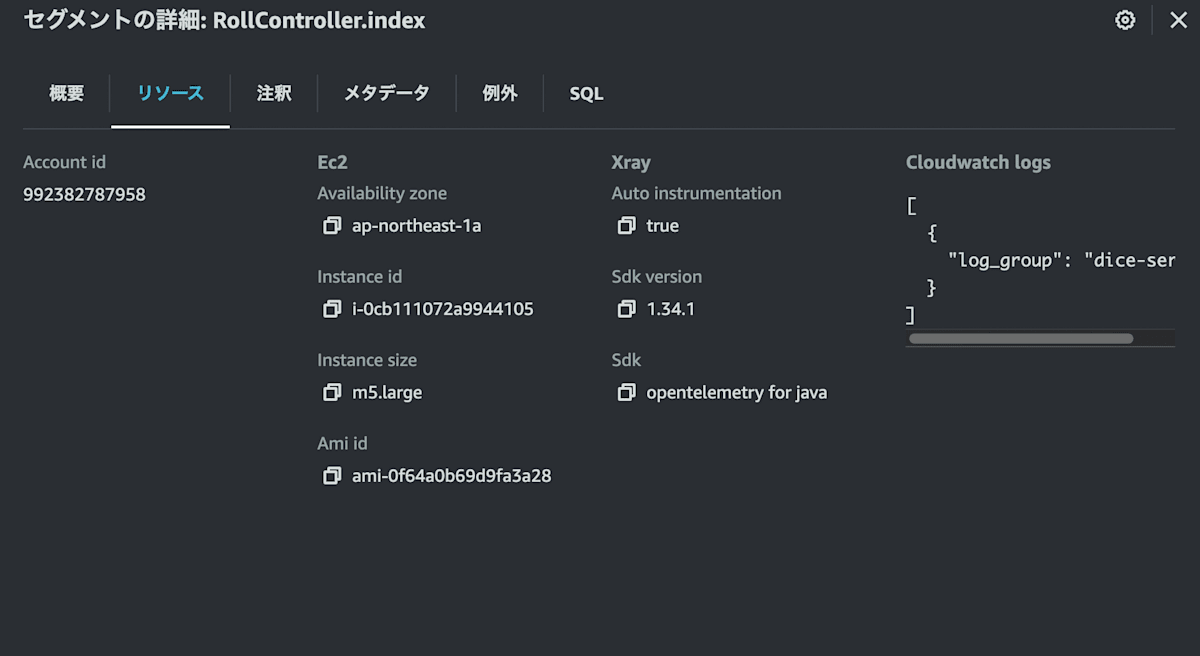
子スパンの RollController.index をクリックしてみてください。
概要、リソース、注釈、メタデータ、例外、SQL が表示されます。
OpenTelemetry SDK、ADOT Java Agent、CloudWatch Agent によって付与された様々なメタデータが表示されています。
ここを正確に、かつ、詳細に設定することで、トレースの分析が容易になります。
このデモでは自動計装により様々なメタデータが付与されています。
マネジメントコンソールの CloudWatch 画面から、左ペインの Application Signals → サービス を選択します。
サービス欄に dice-server が表示されています。 app コンテナから送信したシグナルが Application Signals まで届いています。
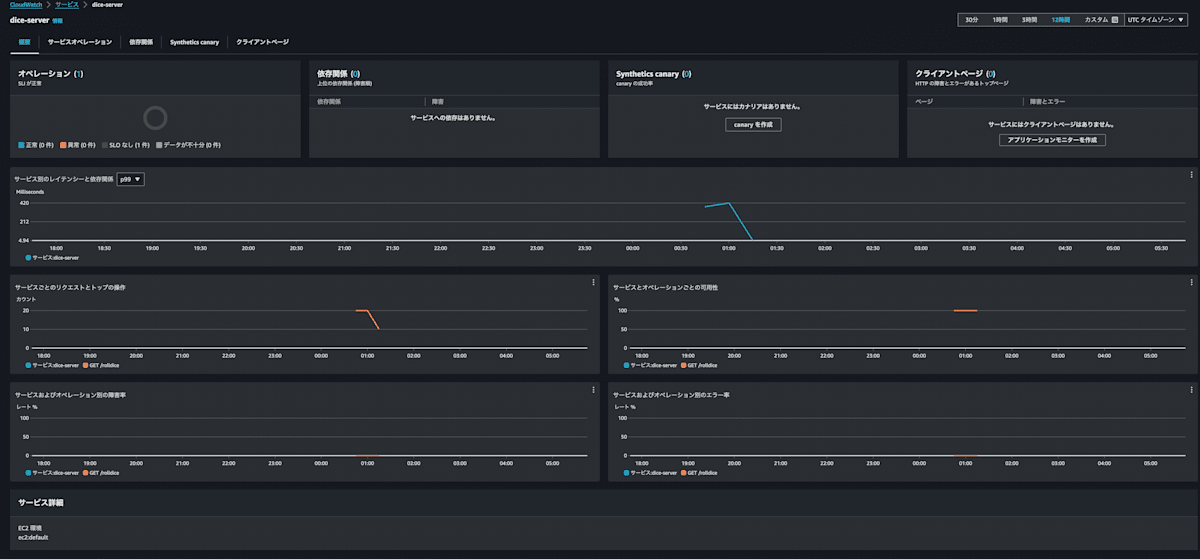
dice-server をクリックすると、サービスの健全性を測るために役立つメトリクスが表示されます。
特に サービスオペレーター タブに表示される情報は SLI として利用可能です。
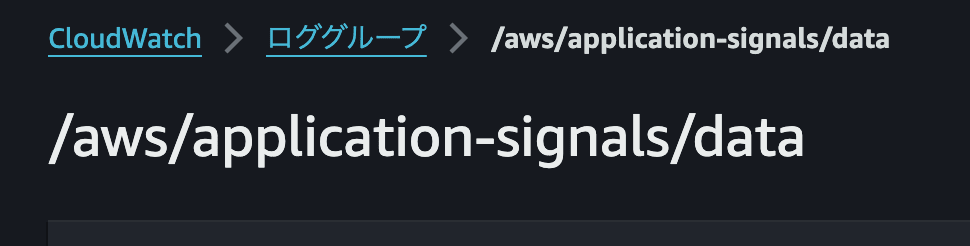
CloudWatch Logs を見てみます。
/aws/application-signalgs/data というロググループが作成されています。
ここに CloudWatch Agent から EMF 形式でメトリクスが送信されています。
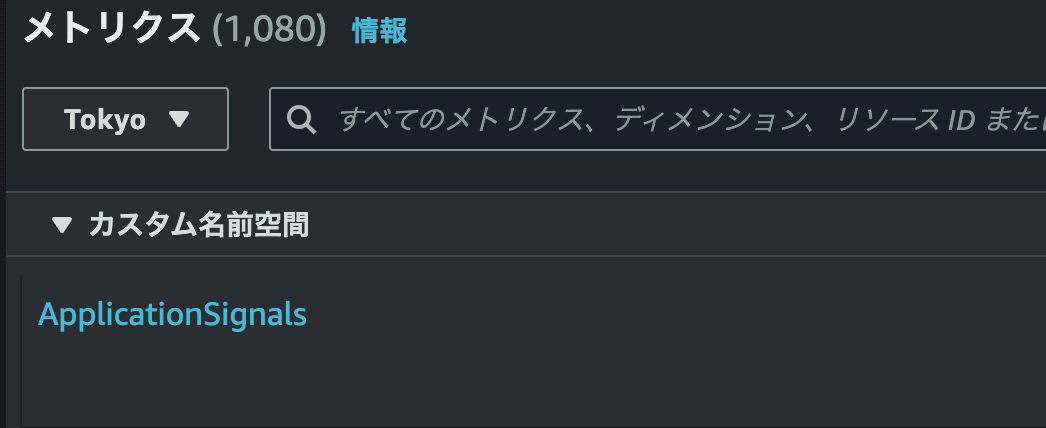
そのメトリクスは CloudWatch Metrics に表示されています。
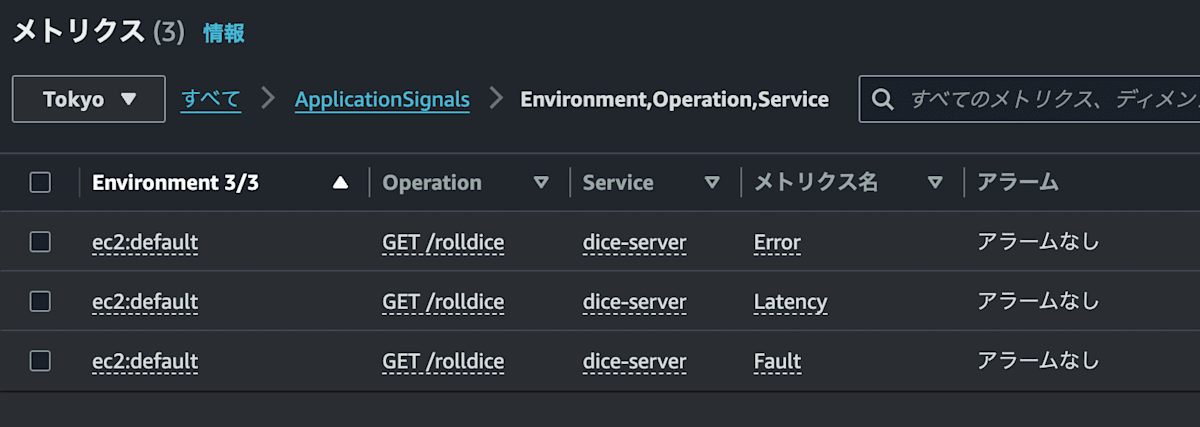
カスタム名前空間 ApplicationSignals が作られます。Error、Latency、Fault などのメトリクスが表示されています。
コンテナ停止
コンテナを停止します。
$ docker compose down
解説
Application Signals を利用するためには、以下の2つのコンポーネントが必要です。
- CloudWatch Agent
- AWS Distro for OpenTelemetry
Chapter 2 では、Dockerfile のなかで AWS Distro for OpenTelemetry を組み込んでいます。
Dockerfile に書かず Docker ボリュームを使う方法もあります。
これは、いわゆる自動計装エージェントです。アプリケーションコードに手を入れることなく、各シグナルを収集します。
ADD https://github.com/aws-observability/aws-otel-java-instrumentation/releases/download/v1.32.3/aws-opentelemetry-agent.jar ./aws-opentelemetry-agent.jar
この jar ファイルをコンテナ環境変数 JAVA_TOOL_OPTIONS に設定することで、アプリケーションに対してエージェントを使用可能な状態にできます。
JAVA_TOOL_OPTIONS="-javaagent:/app/aws-opentelemetry-agent.jar"
環境変数
他にも必要な環境変数があります。これらを正しく構成することで Application Signals にシグナルを送信できます。
| 環境変数 | 説明 |
|---|---|
| OTEL_TRACES_EXPORTER=otlp | 必ず otlp
|
| OTEL_LOGS_EXPORTER=otlp | 本ハンズオンで使用。ログを ADOT へ送信する。Application Signals では使わない。 |
| OTEL_METRICS_EXPORTER=none | 本ハンズオンで使用。Otel のメトリクスは送信しない。 |
| OTEL_PROPAGATORS=xray,tracecontext,baggage,b3 | 分散トレースにおいて後続へ情報を伝達するために使用。Application Signals では xray を含める。 |
| OTEL_RESOURCE_ATTRIBUTES=service.name=dice-server,aws.log.group.names=dice-server |
service.name はリソース属性を付与。トレース送信元を識別するのに必須。aws.log.group.namesはトレースとログの紐づけに使用。 |
| OTEL_EXPORTER_OTLP_PROTOCOL=http/protobuf | 必ず http/protobuf
|
| OTEL_EXPORTER_OTLP_TRACES_ENDPOINT=http://cw-agent:4316/v1/traces | CloudWatch Agent をトレース宛先として指定。 |
| OTEL_EXPORTER_OTLP_LOGS_ENDPOINT=http://adot:4318/v1/logs | 本ハンズオンで使用。ログ宛先。Application Signals では使わない。 |
| OTEL_AWS_APPLICATION_SIGNALS_EXPORTER_ENDPOINT=http://cw-agent:4316/v1/metrics | CloudWatch Agent をメトリクス宛先として指定。 |
| OTEL_AWS_APPLICATION_SIGNALS_ENABLED=true | Application Signals を有効。 |
| OTEL_TRACES_SAMPLER=always_on | トレースのサンプリングをしない。 |
| JAVA_TOOL_OPTIONS="-javaagent:/app/aws-opentelemetry-agent.jar" | Java 自動計装エージェントのパスを指定。 |
OpenTelemetry compatibility considerations
ログ
本ハンズオンではアプリケーションのログを CloudWatch Logs のロググループ dice-server に送信しています。
ADOT がログを受け取り、CloudWatch Logs へ送信します。
exporters:
  awscloudwatchlogs:
    log_group_name: "dice-server"
    log_stream_name: "dice"
    region: "ap-northeast-1"
    log_retention: 7
ログにはトレース ID を含めるようにあらかじめ設定しています。
    <encoder>
      <pattern>%d{HH:mm:ss.SSS} trace_id=%X{AWS-XRAY-TRACE-ID} span_id=%X{span_id} trace_flags=%X{trace_flags} %msg%n</pattern>
    </encoder>
コンテナの環境変数 OTEL_RESOURCE_ATTRIBUTES に aws.log.group.names=dice-server を設定することで、トレースとログを紐づけることができます。
OTEL_RESOURCE_ATTRIBUTES=service.name=dice-server,aws.log.group.names=dice-server
X Ray 画面でトレースを見た際に、ログも表示されていたことを思い出してください。
これらの設定により実現しています。
- ログにトレース ID を含める
- ログを CloudWatch Logs に送信
-
aws.log.group.namesでロググループを指定
宣伝
2024/09/04(水) に OpsJAWS Meetup30 GA記念 Application Signalsを体験しよう を開催します。
本エントリで紹介した内容に加えて、より深堀りしたデモも用意しています。オンラインでも会場参加でもお気軽にご参加ください。
おまけ
CloudWach Agent の起動ログを見てみると、OpenTelemetry Collector Config をうかがい知ることができます。
クリックして展開
exporters:
awsemf/application_signals:
certificate_file_path: ""
detailed_metrics: false
dimension_rollup_option: NoDimensionRollup
disable_metric_extraction: false
eks_fargate_container_insights_enabled: false
endpoint: ""
enhanced_container_insights: false
imds_retries: 1
local_mode: false
log_group_name: /aws/application-signals/data
log_retention: 0
log_stream_name: ""
max_retries: 2
metric_declarations:
- dimensions:
- - Environment
- Operation
- Service
- - Environment
- Service
label_matchers:
- label_names:
- Telemetry.Source
regex: ^(ServerSpan|LocalRootSpan)$
separator: ;
metric_name_selectors:
- Latency
- Fault
- Error
- dimensions:
- - Environment
- Operation
- RemoteOperation
- RemoteResourceIdentifier
- RemoteResourceType
- RemoteService
- Service
- - Environment
- Operation
- RemoteOperation
- RemoteService
- Service
- - Environment
- RemoteService
- Service
- - Environment
- RemoteOperation
- RemoteResourceIdentifier
- RemoteResourceType
- RemoteService
- Service
- - Environment
- RemoteOperation
- RemoteService
- Service
- - Environment
- RemoteResourceIdentifier
- RemoteResourceType
- RemoteService
- Service
- - RemoteResourceIdentifier
- RemoteResourceType
- RemoteService
- - RemoteService
label_matchers:
- label_names:
- Telemetry.Source
regex: ^(ClientSpan|ProducerSpan|ConsumerSpan)$
separator: ;
metric_name_selectors:
- Latency
- Fault
- Error
middleware: agenthealth/logs
namespace: ApplicationSignals
no_verify_ssl: false
num_workers: 8
output_destination: cloudwatch
profile: ""
proxy_address: ""
region: ap-northeast-1
request_timeout_seconds: 30
resource_arn: ""
resource_to_telemetry_conversion:
enabled: false
retain_initial_value_of_delta_metric: false
role_arn: ""
version: "1"
awsxray/application_signals:
certificate_file_path: ""
endpoint: ""
imds_retries: 1
index_all_attributes: false
indexed_attributes:
- aws.local.service
- aws.local.operation
- aws.local.environment
- aws.remote.service
- aws.remote.operation
- aws.remote.environment
- aws.remote.resource.identifier
- aws.remote.resource.type
local_mode: false
max_retries: 2
middleware: agenthealth/traces
no_verify_ssl: false
num_workers: 8
profile: ""
proxy_address: ""
region: ap-northeast-1
request_timeout_seconds: 30
resource_arn: ""
role_arn: ""
telemetry:
enabled: true
include_metadata: true
extensions:
agenthealth/logs:
is_usage_data_enabled: true
stats:
operations:
- PutLogEvents
usage_flags:
mode: EC2
region_type: EC2M
agenthealth/traces:
is_usage_data_enabled: true
stats:
operations:
- PutTraceSegments
usage_flags:
mode: EC2
region_type: EC2M
awsproxy/application_signals:
aws_endpoint: ""
certificate_file_path: ""
dialer:
timeout: 0s
endpoint: 0.0.0.0:2000
imds_retries: 1
local_mode: false
profile: ""
proxy_address: ""
region: ap-northeast-1
role_arn: ""
service_name: ""
processors:
awsapplicationsignals:
resolvers:
- name: ""
platform: ec2
resourcedetection:
aks:
resource_attributes:
cloud.platform:
enabled: true
cloud.provider:
enabled: true
k8s.cluster.name:
enabled: false
azure:
resource_attributes:
azure.resourcegroup.name:
enabled: true
azure.vm.name:
enabled: true
azure.vm.scaleset.name:
enabled: true
azure.vm.size:
enabled: true
cloud.account.id:
enabled: true
cloud.platform:
enabled: true
cloud.provider:
enabled: true
cloud.region:
enabled: true
host.id:
enabled: true
host.name:
enabled: true
compression: ""
consul:
address: ""
datacenter: ""
namespace: ""
resource_attributes:
cloud.region:
enabled: true
host.id:
enabled: true
host.name:
enabled: true
token_file: ""
detectors:
- eks
- env
- ec2
disable_keep_alives: false
docker:
resource_attributes:
host.name:
enabled: true
os.type:
enabled: true
ec2:
resource_attributes:
cloud.account.id:
enabled: true
cloud.availability_zone:
enabled: true
cloud.platform:
enabled: true
cloud.provider:
enabled: true
cloud.region:
enabled: true
host.id:
enabled: true
host.image.id:
enabled: true
host.name:
enabled: true
host.type:
enabled: true
tags:
- ^kubernetes.io/cluster/.*$
- ^aws:autoscaling:groupName
ecs:
resource_attributes:
aws.ecs.cluster.arn:
enabled: true
aws.ecs.launchtype:
enabled: true
aws.ecs.task.arn:
enabled: true
aws.ecs.task.family:
enabled: true
aws.ecs.task.id:
enabled: true
aws.ecs.task.revision:
enabled: true
aws.log.group.arns:
enabled: true
aws.log.group.names:
enabled: true
aws.log.stream.arns:
enabled: true
aws.log.stream.names:
enabled: true
cloud.account.id:
enabled: true
cloud.availability_zone:
enabled: true
cloud.platform:
enabled: true
cloud.provider:
enabled: true
cloud.region:
enabled: true
eks:
resource_attributes:
cloud.platform:
enabled: true
cloud.provider:
enabled: true
k8s.cluster.name:
enabled: false
elasticbeanstalk:
resource_attributes:
cloud.platform:
enabled: true
cloud.provider:
enabled: true
deployment.environment:
enabled: true
service.instance.id:
enabled: true
service.version:
enabled: true
endpoint: ""
gcp:
resource_attributes:
cloud.account.id:
enabled: true
cloud.availability_zone:
enabled: true
cloud.platform:
enabled: true
cloud.provider:
enabled: true
cloud.region:
enabled: true
faas.id:
enabled: true
faas.instance:
enabled: true
faas.name:
enabled: true
faas.version:
enabled: true
gcp.cloud_run.job.execution:
enabled: true
gcp.cloud_run.job.task_index:
enabled: true
gcp.gce.instance.hostname:
enabled: false
gcp.gce.instance.name:
enabled: false
host.id:
enabled: true
host.name:
enabled: true
host.type:
enabled: true
k8s.cluster.name:
enabled: true
heroku:
resource_attributes:
cloud.provider:
enabled: true
heroku.app.id:
enabled: true
heroku.dyno.id:
enabled: true
heroku.release.commit:
enabled: true
heroku.release.creation_timestamp:
enabled: true
service.instance.id:
enabled: true
service.name:
enabled: true
service.version:
enabled: true
http2_ping_timeout: 0s
http2_read_idle_timeout: 0s
idle_conn_timeout: 1m30s
k8snode:
auth_type: serviceAccount
context: ""
kube_config_path: ""
node_from_env_var: ""
resource_attributes:
k8s.node.name:
enabled: true
k8s.node.uid:
enabled: true
lambda:
resource_attributes:
aws.log.group.names:
enabled: true
aws.log.stream.names:
enabled: true
cloud.platform:
enabled: true
cloud.provider:
enabled: true
cloud.region:
enabled: true
faas.instance:
enabled: true
faas.max_memory:
enabled: true
faas.name:
enabled: true
faas.version:
enabled: true
max_idle_conns: 100
openshift:
address: ""
resource_attributes:
cloud.platform:
enabled: true
cloud.provider:
enabled: true
cloud.region:
enabled: true
k8s.cluster.name:
enabled: true
tls:
ca_file: ""
cert_file: ""
include_system_ca_certs_pool: false
insecure: false
insecure_skip_verify: false
key_file: ""
max_version: ""
min_version: ""
reload_interval: 0s
server_name_override: ""
token: ""
override: true
proxy_url: ""
read_buffer_size: 0
system:
resource_attributes:
host.arch:
enabled: false
host.cpu.cache.l2.size:
enabled: false
host.cpu.family:
enabled: false
host.cpu.model.id:
enabled: false
host.cpu.model.name:
enabled: false
host.cpu.stepping:
enabled: false
host.cpu.vendor.id:
enabled: false
host.id:
enabled: false
host.ip:
enabled: false
host.mac:
enabled: false
host.name:
enabled: true
os.description:
enabled: false
os.type:
enabled: true
timeout: 2s
tls:
ca_file: ""
cert_file: ""
include_system_ca_certs_pool: false
insecure: false
insecure_skip_verify: false
key_file: ""
max_version: ""
min_version: ""
reload_interval: 0s
server_name_override: ""
write_buffer_size: 0
receivers:
otlp/application_signals:
protocols:
grpc:
dialer:
timeout: 0s
endpoint: 0.0.0.0:4315
include_metadata: false
max_concurrent_streams: 0
max_recv_msg_size_mib: 0
read_buffer_size: 524288
transport: tcp
write_buffer_size: 0
http:
endpoint: 0.0.0.0:4316
include_metadata: false
logs_url_path: /v1/logs
max_request_body_size: 0
metrics_url_path: /v1/metrics
traces_url_path: /v1/traces
service:
extensions:
- awsproxy/application_signals
- agenthealth/traces
- agenthealth/logs
pipelines:
metrics/application_signals:
exporters:
- awsemf/application_signals
processors:
- resourcedetection
- awsapplicationsignals
receivers:
- otlp/application_signals
traces/application_signals:
exporters:
- awsxray/application_signals
processors:
- resourcedetection
- awsapplicationsignals
receivers:
- otlp/application_signals
telemetry:
logs:
development: false
disable_caller: false
disable_stacktrace: false
encoding: console
level: info
sampling:
enabled: true
initial: 2
thereafter: 500
tick: 10s
metrics:
address: ""
level: None
traces: {}
Discussion