InformerとAlpha Vantage APIを用いた株価予測メモ
InformerとAlpha Vantage APIを用いた株価予測
ChatGPTで採用されているアルゴリズム、Transformerを改良したInformerアルゴリズムを用いて時系列データである株価予測を行った備忘録
これを使って大損しても責任負いません!
本記事で記述するコードはInformer論文のファーストオーサーであるHaoyi Zhou氏が公開しているGithub Repositoryをアレンジしたものです
Informerとは
AAAI2021 Best paperとなった論文
TransformerのSelf-attentionメカニズムを確率的なスパース化を利用したProbSparse self-attentionメカニズムとしたことで、計算量を減少させた
これにより、長期の時系列データを扱う場合、Informerを用いることで比較的少ない計算量でそれなりの精度が出せるはず
実装
下記ステップで行う
- 初期設定
- 株価データの取得
- ハイパーパラメータ設定
- 学習
- 推論
- 評価
環境:GoogleColab Pro版 GPUノーマル(device = cuda)で動確済(2023/3/26)
初期設定
必要なライブラリ、リポジトリのクローン
!pip install yfinance
!git clone https://github.com/zhouhaoyi/Informer2020.git
!ls

import os
import sys
if not 'Informer2020' in sys.path:
    sys.path += ['Informer2020']

from utils.tools import dotdict
from exp.exp_informer import Exp_Informer
import torch

from torch.utils.data import DataLoader
from data.data_loader import Dataset_Pred
from torch.utils.data import DataLoader
import pandas as pd
import numpy as np
import yfinance as yf
import requests
import json
import time
株価データの取得
学習、予測を行うための株価データを取得する
Yahoo!Financeだと最短周期でも1h毎のデータしかとれないので、無料でmin単位のデータを取得できるAlpha Vantage APIを利用する
このコードでは、Appleの過去2年間のOHLCVデータを15min間隔で取得する
Alpha Vantageのサイトから無料APIを取得する(無料版は5request/min制約)
def get_stock_data(symbol, interval, api_key, slice):
    url = f"https://www.alphavantage.co/query?function=TIME_SERIES_INTRADAY_EXTENDED&symbol={symbol}&interval={interval}&slice={slice}&apikey={api_key}"
    response = requests.get(url)

    if response.status_code == 200:
        data = response.text.splitlines()
        return data
    else:
        print(f"Error {response.status_code}: Failed to fetch data.")
        return None

def convert_to_dataframe(raw_data):
    header = raw_data[0].split(',')
    data_rows = [row.split(',') for row in raw_data[1:]]

    df = pd.DataFrame(data_rows, columns=header)
    df['time'] = pd.to_datetime(df['time'])
    df[['open', 'high', 'low', 'close', 'volume']] = df[['open', 'high', 'low', 'close', 'volume']].apply(pd.to_numeric)

    # データフレームを古い順にソート
    df.sort_values(by='time', ascending=True, inplace=True)
    df.reset_index(drop=True, inplace=True)

    return df

def get_full_data(symbol, interval, api_key):
    # 720日間のデータを取得するためのスライスリスト
    slices = [f"year1month{i}" for i in range(1, 13)] + [f"year2month{i}" for i in range(1, 13)]

    all_data = []
    for slice in slices:
        raw_stock_data = get_stock_data(symbol, interval, api_key, slice)
        if raw_stock_data:
            all_data.extend(raw_stock_data[1:])
        time.sleep(15)  # APIの制限に従って待機(15秒)

    all_data.insert(0, raw_stock_data[0])
    stock_dataframe = convert_to_dataframe(all_data)

    return stock_dataframe

symbol = "AAPL" #Ticker
interval = "15min"  #Interval
api_key = "YOUR_API_KEY"  # ここにAlpha Vantageから取得したAPIキーを入力

stock_dataframe = get_full_data(symbol, interval, api_key)
stock_dataframe.rename(columns={'time': 'date'}, inplace=True)
stock_dataframe.head()
df = stock_dataframe

output_directory = '/content/'
csv_filename = "output.csv"
output_path = os.path.join(output_directory, csv_filename)
df.to_csv(output_path, index=True)
df.head()
ハイパーパラメータ設定
close(終値)に対してOHLCVの特徴量を使って15min毎にEncodingを行い、例として3営業日後の予測を行う
この部分の条件は下記コードから抜粋
args.target = "close"
args.freq = '15m'
args.features = 'MS'
args.pred_len = 84 # =4*7*3 (15min*4=1h , 7h=1営業日の市場Open,3日)
Set train parameters
args = dotdict()

args.model = 'informer' # model of experiment, options: [informer, informerstack, informerlight(TBD)]

args.data = 'custom' # data
args.root_path = '/content/' # root path of data file
args.data_path = 'output.csv' # data file
args.features = 'MS' # forecasting task, options:[M, S, MS];
                    #M:multivariate predict multivariate, S:univariate predict univariate,
                    #MS:multivariate predict univariate
args.target = 'close' # target feature in S or MS task
args.freq = '15m' # freq for time features encoding, options:[s:secondly, t:minutely, h:hourly, d:daily, b:business days, w:weekly, m:monthly], you can also use more detailed freq like 15min or 3h
args.checkpoints = './informer_checkpoints' # location of model checkpoints

args.seq_len = 96 # input sequence length of Informer encoder
args.label_len = 48 # start token length of Informer decoder
args.pred_len = 84 # prediction sequence length
# Informer decoder input: concat[start token series(label_len), zero padding series(pred_len)]

args.enc_in = 8 # encoder input size
args.dec_in = 8 # decoder input size
args.c_out = 8 # output size
args.factor = 5 # probsparse attn factor
args.d_model = 512 # dimension of model
args.n_heads = 8 # num of heads
args.e_layers = 2 # num of encoder layers
args.d_layers = 1 # num of decoder layers
args.d_ff = 2048 # dimension of fcn in model
args.dropout = 0.05 # dropout
args.attn = 'prob' # attention used in encoder, options:[prob, full]
args.embed = 'timeF' # time features encoding, options:[timeF, fixed, learned]
args.activation = 'gelu' # activation
args.distil = True # whether to use distilling in encoder
args.output_attention = False # whether to output attention in ecoder
args.mix = True
args.padding = 0
args.freq = 'h'

args.batch_size = 32
args.learning_rate = 0.0001
args.loss = 'mse'
args.lradj = 'type1'
args.use_amp = False # whether to use automatic mixed precision training

args.num_workers = 0
args.itr = 1
args.train_epochs = 20
args.patience = 3
args.des = 'exp'

args.use_gpu = True if torch.cuda.is_available() else False
args.gpu = 0

args.use_multi_gpu = False
args.devices = '0,1,2,3'
GPUの設定
args.use_gpu = True if torch.cuda.is_available() and args.use_gpu else False

if args.use_gpu and args.use_multi_gpu:
    args.devices = args.devices.replace(' ','')
    device_ids = args.devices.split(',')
    args.device_ids = [int(id_) for id_ in device_ids]
    args.gpu = args.device_ids[0]
# Set augments by using data name
data_parser = {
    'custom':{'data':'output.csv','T':'close','M':[6,6,6],'S':[1,1,1],'MS':[6,6,1]}, #特徴量の数に応じてここの配列を変更する
}
if args.data in data_parser.keys():
    data_info = data_parser[args.data]
    args.data_path = data_info['data']
    args.target = data_info['T']
    args.enc_in, args.dec_in, args.c_out = data_info[args.features]

args.detail_freq = args.freq
args.freq = args.freq[-1:]

Exp = Exp_Informer
print('Args in experiment:')
print(args)
学習
for ii in range(args.itr):
    # setting record of experiments
    setting = '{}_{}_ft{}_sl{}_ll{}_pl{}_dm{}_nh{}_el{}_dl{}_df{}_at{}_fc{}_eb{}_dt{}_mx{}_{}_{}'.format(args.model, args.data, args.features,
                args.seq_len, args.label_len, args.pred_len,
                args.d_model, args.n_heads, args.e_layers, args.d_layers, args.d_ff, args.attn, args.factor, args.embed, args.distil, args.mix, args.des, ii)

    # set experiments
    exp = Exp(args)

    # train
    print('>>>>>>>start training : {}>>>>>>>>>>>>>>>>>>>>>>>>>>'.format(setting))
    exp.train(setting)

    # test
    print('>>>>>>>testing : {}<<<<<<<<<<<<<<<<<<<<<<<<<<<<<<<<<'.format(setting))
    exp.test(setting)

    torch.cuda.empty_cache()

mse:0.042731158435344696, mae:0.15262167155742645となった
推論
# set saved model path
setting = 'informer_custom_ftMS_sl96_ll48_pl84_dm512_nh8_el2_dl1_df2048_atprob_fc5_ebtimeF_dtTrue_mxTrue_exp_0'
# path = os.path.join(args.checkpoints,setting,'checkpoint.pth')


# If you already have a trained model, you can set the arguments and model path, then initialize a Experiment and use it to predict
# Prediction is a sequence which is adjacent to the last date of the data, and does not exist in the data
# If you want to get more information about prediction, you can refer to code `exp/exp_informer.py function predict()` and `data/data_loader.py class Dataset_Pred`

exp = Exp(args)

exp.predict(setting, True)

prediction = np.load('./results/'+setting+'/real_prediction.npy')

prediction.shape

Data = Dataset_Pred
timeenc = 0 if args.embed!='timeF' else 1
flag = 'pred'; shuffle_flag = False; drop_last = False; batch_size = 1

freq = args.detail_freq

data_set = Data(
    root_path=args.root_path,
    data_path=args.data_path,
    flag=flag,
    size=[args.seq_len, args.label_len, args.pred_len],
    features=args.features,
    target=args.target,
    timeenc=timeenc,
    freq=freq
)
data_loader = DataLoader(
    data_set,
    batch_size=batch_size,
    shuffle=shuffle_flag,
    num_workers=args.num_workers,
    drop_last=drop_last)

len(data_set), len(data_loader)
評価、可視化
# When we finished exp.train(setting) and exp.test(setting), we will get a trained model and the results of test experiment
# The results of test experiment will be saved in ./results/{setting}/pred.npy (prediction of test dataset) and ./results/{setting}/true.npy (groundtruth of test dataset)

preds = np.load('./results/'+setting+'/pred.npy')
trues = np.load('./results/'+setting+'/true.npy')

# [samples, pred_len, dimensions]
preds.shape, trues.shape
import matplotlib.pyplot as plt

def plot_predictions(trues, preds, start_index, step, num_plots):
    num_rows = num_plots // 3
    num_cols = 3

    fig, axes = plt.subplots(num_rows, num_cols, figsize=(14, 3 * num_rows), sharex=True, sharey=True)

    for i, ax in enumerate(axes.flatten()):
        if i < num_plots:
            index = start_index + i * step

            ax.plot(trues[index, :, -1], label='GroundTruth')
            ax.plot(preds[index, :, -1], label='Prediction')

            ax.set_title(f'Index {index}')
            ax.legend()
            ax.set_xlabel('time (h)')
            ax.set_ylabel('Close Price')
            ax.tick_params(axis='both', which='both', labelsize=8, direction='in')

        else:
            ax.axis('off')

    # グラフを表示
    plt.tight_layout()
    plt.show()
plot_predictions(trues, preds, start_index=0, step=50, num_plots=9)
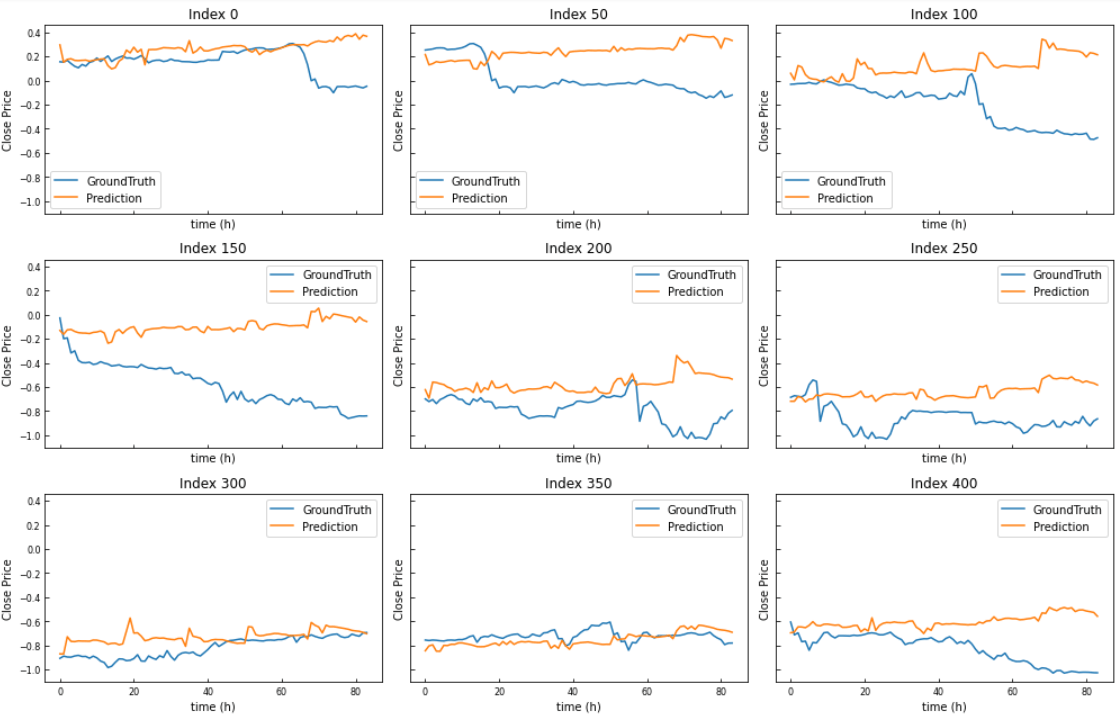
横軸が84じゃなくてmax21hですね。(15min×84)
終わり
Discussion