😸
【Python】Scattertextで2つのテキストデータの特徴をつかもう


1.はじめに
- テキストデータは、ニュース記事やユーザーレビューなど、様々な場面で利用されています。
- テキストデータは非構造化データであるため、これまでは、分析が難しいという課題がありましたが、自然言語処理技術の発達により、分析が可能になってきました。
- その中でも、Pythonライブラリーのscattertextは、文書間の語句の出現頻度を散布図で可視化することで、文書の特徴や差異を掴むことができる優れたツールです。
このブログでは、scattertextの概要や活用方法、Pythonでの実装方法を紹介します。
2.scattertextの概要
- scattertextは、文書での語句の出現頻度を計算します。
- そして、その頻度を基に、語句にXY座標を割り当てて散布図を作成します。
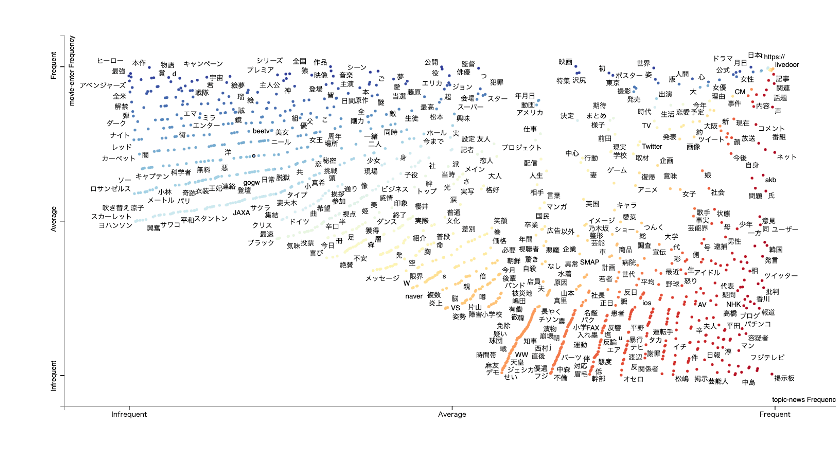
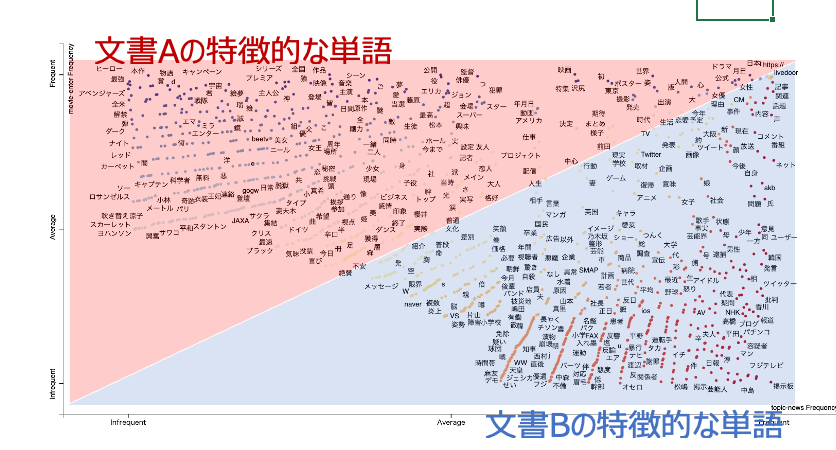
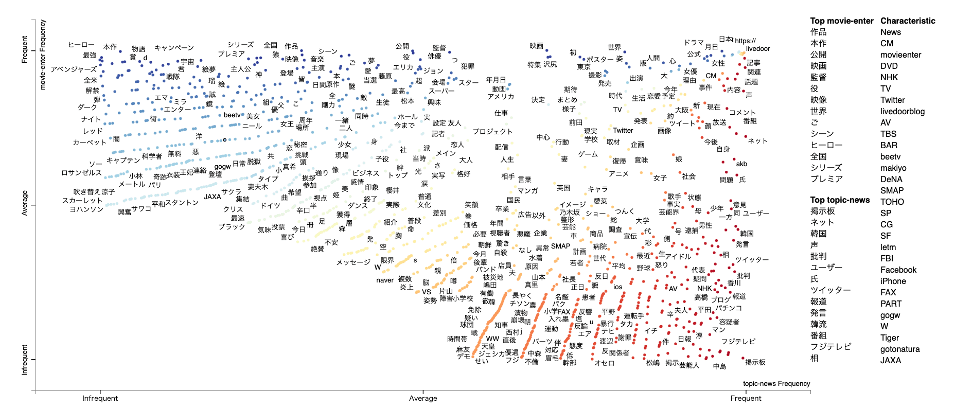
- この散布図では、Y軸は文書A内での頻度、X軸は文書B内での頻度を表します。
- したがって、散布図上では、文書Aに特徴的な語句は上側に、文書Bに特徴的な語句は右側に配置されます。
- また、散布図上の語句は色分けされており、色は語句とカテゴリーの関連度を示します。
3.scattertextの具体的な活用イメージ
例えばニュース記事なら...
- ニュース記事では、同じトピックでもメディアやジャンルによって表現や視点が異なることがあります。
- scattertextを使ってニュース記事を分析することで、メディアやジャンルごとの特徴的な語句や傾向を見つけることができます。
例えばユーザーレビューなら...
-
ユーザーレビューでは、商品やサービスにユーザーレビューでは、商品やサービスに対する評価や感想が記されています。
-
scattertextを使ってユーザーレビューを分析することで、商品やサービスの強みや弱み、改善点や要望などを抽出することができます 。
-
他にもカテゴリーが分かれる文書であれば、Scattertextを使うことで、その文書の特徴を掴むことができます。ビジネスへの活用事例は、さまざまでしょう。
4.Pythonでの実装方法
- scattertextはPythonのライブラリとして提供されており、pipで簡単にインストールできます。
- また、散布図はHTMLファイルとして出力されるため、ブラウザで閲覧できます。
- ここでは、LivedoorニュースのMovie-EnterとTopic-Newsの記事を対象にして、scattertextを使って分析してみます。
全体的な流れ
- まず、必要なライブラリをインポートします。
- そして、Movie-EnterとTopic-NewsのCSVファイルを読み込んで、テキストデータのみ抜き出し、テキストデータに対して前処理を行います。前処理では、日本語の形態素解析器であるGINZAを使って、テキストを単語に分割し、名詞だけを抽出します。
- 最後に、scattertext.CorpusFromPandasクラスを使ってコーパスを作成し、散布図を作成します 。
ライブラリーのインポート
!pip install SudachiPy==0.5.4 ginza==4.0.6 ja-ginza==4.0.0
!pip install japanize-matplotlib
!pip install pyvis
!pip install scattertext jieba empath astropy gensim umap-learn
!apt install fonts-takao-pgothic
ライブラリーのインポート
以下の2行は、 GoogleコラボでGINZAを使うためのおまじないです
import pkg_resources, imp
imp.reload(pkg_resources)
他のライブラリーもインポートします
import scattertext as st
from scattertext.features import FeatsFromSpacyDoc
from sklearn.feature_extraction.text import CountVectorizer
import numpy as np
import pandas as pd
import re
import networkx as nx
from pyvis.network import Network
from networkx.algorithms.community import greedy_modularity_communities
import matplotlib.pyplot as plt
import japanize_matplotlib
from matplotlib.pyplot import figure, text
import unicodedata
from IPython.display import HTML
from collections import Counter
from itertools import chain

import spacy
nlp = spacy.load('ja_ginza')
Scattertextに投入するためのデータフレームの作成
# ***にcsvが格納されているディクトリを指定します。
path_movie_enter = "/content/drive/***/movie-enter.csv"
path_topic_news = "/content/drive/***/topic_news.csv"

movie_enter_df = pd.read_csv(path_movie_enter)
topic_news_df = pd.read_csv(path_topic_news)

#テキストの正規化・クリーニングをする
def tokenizer(text):
    replaced_text = unicodedata.normalize("NFKC",text)
    replaced_text = replaced_text.upper()
    replaced_text = re.sub(r'[【】 () () 『』 「」]', '' ,replaced_text)
    replaced_text = re.sub(r'[\u3000]', ' ' ,replaced_text)
    replaced_text = re.sub(r'[\[\][]]', ' ', replaced_text)
    replaced_text = re.sub(r'[@@]\w+', '', replaced_text)
    replaced_text = re.sub(r'\d+\.*\d*', '', replaced_text)

    return replaced_text

def create_text(df):
    docs = []
    for i, row in df.iterrows():
        docs.append(row["body"])
    doc = ",".join(docs)
    text = tokenizer(doc)

    return text

#最初の50,000文字だけをとってくる
movie_enter_text = create_text(movie_enter_df)[:50000]
topic_news_text = create_text(topic_news_df)[:50000]


#scattertextに投入できるデータフレームの作成
type1 = "movie-enter"
type2 = "topic-news"
texts = [movie_enter_text,topic_news_text]
docs = list(nlp.pipe(texts, disable=["her"]))
idcc_df = pd.DataFrame({"types":[type1, type2], "texts":docs})
idcc_df
このようなデータフレームが作成されればOKです

テキストデータ前処理のためのクラスを作成
#ストップワードの指定
!wget http://svn.sourceforge.jp/svnroot/slothlib/CSharp/Version1/SlothLib/NLP/Filter/StopWord/word/Japanese.txt
with open("/content/Japanese.txt","r") as f:
    stopwords = f.read().split("\n")

def soften(word):
  replace_table = {
      '為る': 'する', '成る': 'なる', '遣る': 'やる', '有る': 'ある', '無い': 'ない',
      '御洒落': 'おしゃれ', '撫子': 'なでしこ', '未だ未だ': 'まだまだ', '迚も': 'とても',
      '唯': 'ただ', '筈': 'はず', '若し': 'もし'
  }
  return replace_table.get(word, word)

#クラスの作成
class PosFilteredUnigramFeatsFromSpacyDoc(object):
    def __init__(self,
                 use_lemmas=False,
                 strip_final_period=False,
                 poses_to_include=['PROPN', 'NOUN'],
                 stopwords=set()):
        self._use_lemmas = use_lemmas
        self._strip_final_period = strip_final_period
        self._poses_to_include = poses_to_include
        self._stopwords = stopwords

    def _post_process_term(self, term):
        if self._strip_final_period and (term.strip().endswith('.') or term.strip().endswith(',')):
            term = term.strip()[:-1]
        return term

    def get_doc_metadata(self, doc):
        return Counter()

    def get_feats(self, doc):
        ngram_counter = Counter()
        for sent in doc.sents:
            unigrams = self._get_unigram_feats(sent)
            ngram_counter += Counter(chain(unigrams, []))
        return ngram_counter

    def _get_unigram_feats(self, sent):
        unigrams = []
        for tok in sent:
            # Stopwordsの確認
            if tok.lower_ not in self._stopwords:
                if tok.pos_ in self._poses_to_include:
                    if self._use_lemmas and tok.lemma_.strip():
                        unigrams.append(self._post_process_term(tok.lemma_.strip()))
                    elif tok.lower_.strip():
                        unigrams.append(self._post_process_term(tok.lower_.strip()))
        return unigrams

    def has_metadata_term_list(self):
        return False

    def get_top_model_term_lists(self):
        raise Exception("No topic models associated with these features.")
散布図の描画
feats_from_spacy_doc
=PosFilteredUnigramFeatsFromSpacyDoc(use_lemmas=True,stopwords=stopwords)
corpus
= st.CorpusFromParsedDocuments(idcc_df, category_col="types", parsed_col="texts",feats_from_spacy_doc=feats_from_spacy_doc).build()


html = st.produce_scattertext_explorer(corpus, category=type1,
          category_name=type1, not_category_name=type2,
          width_in_pixels=1200, minimum_term_frequency=5, max_terms=2000)
HTML(html)
実行すると、以下のようなグラフが表示されるはずです。
Discussion