Local環境でPrometheusのPushgatewayを動かしてみた
記事の内容
PrometheusのPushgatewayをLocal環境でdockerを使って動作させてみます。
記事の長さ
3分で読めます
Goサーバーの構築
PrometheusとPushGatewayを構築する前に、PushGatewayに値を送信するGoサーバーを構築します。
main.go
package main

import (
	"github.com/labstack/echo/v4"
	"github.com/prometheus/client_golang/prometheus"
	"github.com/prometheus/client_golang/prometheus/push"
	"net/http"
)

func main() {
	customCounter := prometheus.NewCounter(
		prometheus.CounterOpts{
			Name: "hello_counter",
			Help: "This is my custom counter",
		},
	)

	prometheus.MustRegister(customCounter)

	e := echo.New()
	e.GET("/", func(c echo.Context) error {
		customCounter.Inc()

		if err := push.New("http://pushgateway:9091", "my_counter_job").
			Collector(customCounter).Push(); err != nil {
			println("Could not push to Pushgateway:", err)
			return c.String(http.StatusInternalServerError, "Could not push to Pushgateway")
		}

		return c.String(http.StatusOK, "Hello, World!")
	})

	e.Logger.Fatal(e.Start(":8080"))
}
8080ポートでリッスンして、エンドポイントにアクセスされるたびに、pushgatewayにメトリクスを送信するGoサーバーができました。
PrometheusとPushgatewayを準備する
次に、PrometheusとPushgatewayを動作させるdocker-composeを用意します。(一緒にGoサーバーも動作させます)
Docker
docker-compose.yml
version: "3.9"

services:
  prometheus:
    image: prom/prometheus
    container_name: prometheus
    ports:
     - '9090:9090'
    volumes:
     - './prometheus.yml:/etc/prometheus/prometheus.yml'
     - 'prometheus-data:/prometheus'
    restart: always
  pushgateway:
    image: prom/pushgateway
    container_name: pushgateway
    restart: always
    ports:
      - '9091:9091'
  go-app:
    build: .
    container_name: go-app
    restart: always
    volumes:
      - .:/app
    ports:
      - "8080:8080"
volumes:
  prometheus-data: {}
このファイルを作成して、docker compose upを実行すると以下三つのコンテナが立ち上がり、実験の準備が完了します。
- Go (Webサーバー)
- Prometheus
- Pushgateway
Prometheusの設定
コンテナの準備ができたので、prometheusの設定をファイルに追記します。
prometheus.yml
global:
  scrape_interval: 15s
scrape_configs:
  - job_name: pushgateway
    static_configs:
      - targets:
          - pushgateway:9091
PrometheusのスクレイパーがPushgatewayが動作するコンテナを15秒に一回スクレイピングする設定を記述したymlファイルです。
メトリクスを確認する
ここまでで準備が完了しました。実際にコンテナを起動して、メトリクスが正常にGatewayにPushされているか確認しましょう。
Docker composeの起動
以下コマンドにて3つのコンテナが立ち上がることを確認します。
$ docker compose up
Webサーバーにアクセス
Goで動作するWebサーバーにアクセスして、PushGatewayにメトリクスを送信します。
$ curl localhost:8080
Hello, World!%
PushGatewayを確認
PushGateway上で正常にメトリクスが記録されているかを確認します。
http://localhost:9091 にアクセスすれば確認できます。

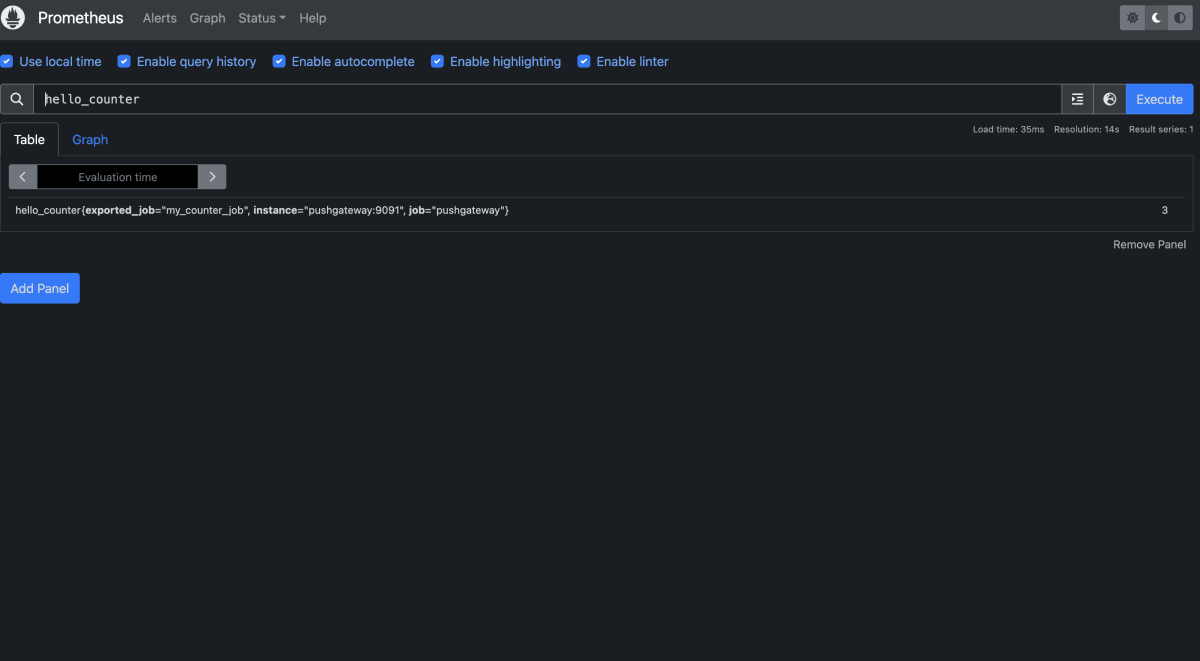
Prometheusを確認
Prometheus上でも正常にCounterが記録されていることを確認できます。(つまり、PushGatewayに記録されたMetricsをPrometheusがスクレイピングできたということになります)
まとめ
今回は常駐型のWebサーバーで実験を行なってしまいましたが、Jobのような一時的に起動するサーバーの場合PushGatewayを利用しないとメトリクスが取得できません。
PushGatewayを使えるようになって、良い監視生活を送ってください!
note
勉強法やキャリア構築法など、エンジニアに役立つ記事をnoteで配信しています。
Discussion