Prometheusの4つの計測法をGoのEchoに実装する【Count, Gauge, Summary, Histogram】
記事の内容
Prometheusの4つの計測方法(Count, Gauge, Summary, Histogram)をGoのEchoサーバーに実装する方法を紹介します。
記事の長さ
5分で読めます
GoのEchoサーバーが動作する環境の用意
GoのEchoサーバーがDocker上で動作し、そのメトリクスをPrometheusで取得できる構成を以下の記事で紹介しています。
この記事で構成した環境を元に今回の実装を進めます。
Count
まずはCountを実装します。
Countとは
Countは回数やサイズを計測するための機能です。
特定のパスに対してリクエストが何回実行されたか?のような計測によく利用されます。
CountをGoサーバーに実装する
Hello, World!と返すエンドポイントに何回アクセスされたかどうかを計測するCountを追加します。
main.goファイルを以下のように変更してください。
main.go
package main

import (
	"errors"
	"github.com/labstack/echo-contrib/echoprometheus"
	"github.com/labstack/echo/v4"
	"github.com/prometheus/client_golang/prometheus"
	"log"
	"net/http"
)

func main() {
	e := echo.New()                              // this Echo instance will serve route on port 8080
	e.Use(echoprometheus.NewMiddleware("myapp")) // adds middleware to gather metrics

	go func() {
		metrics := echo.New()                                // this Echo will run on separate port 8081
		metrics.GET("/metrics", echoprometheus.NewHandler()) // adds route to serve gathered metrics
		if err := metrics.Start(":8081"); err != nil && !errors.Is(err, http.ErrServerClosed) {
			log.Fatal(err)
		}
	}()

	customCounter := prometheus.NewCounter(
		prometheus.CounterOpts{
			Name: "custom_requests_total",
			Help: "How many HTTP requests processed, partitioned by status code and HTTP method.",
		},
	)
	if err := prometheus.Register(customCounter); err != nil {
		log.Fatal(err)
	}
	e.GET("/", func(c echo.Context) error {
		customCounter.Inc()
		return c.String(http.StatusOK, "Hello, World!")
	})

	if err := e.Start(":8080"); err != nil && !errors.Is(err, http.ErrServerClosed) {
		log.Fatal(err)
	}
}
	customCounter := prometheus.NewCounter(
		prometheus.CounterOpts{
			Name: "custom_requests_total",
			Help: "How many HTTP requests processed, partitioned by status code and HTTP method.",
		},
	)
	if err := prometheus.Register(customCounter); err != nil {
		log.Fatal(err)
	}
ここでCounterを作成し、
	e.GET("/", func(c echo.Context) error {
		customCounter.Inc()
		return c.String(http.StatusOK, "Hello, World!")
	})
ここで、increment(customCounter.Inc())を実装します。incrementなので、このメソッドが実行されるたびに、custom_requests_totalというメトリクスのカウントが1増えます。
メトリクスを確認する
正常にメトリクスが取れているかどうかを確認します。
$ curl localhost:8081/metrics
# HELP custom_requests_total How many HTTP requests processed, partitioned by status code and HTTP method.
# TYPE custom_requests_total counter
custom_requests_total 41
# HELP go_gc_duration_seconds A summary of the pause duration of garbage collection cycles.
# TYPE go_gc_duration_seconds summary
...
# HELP promhttp_metric_handler_requests_total Total number of scrapes by HTTP status code.
# TYPE promhttp_metric_handler_requests_total counter
promhttp_metric_handler_requests_total{code="200"} 36
何度かlocalhost:8080にアクセスしてHello,Worldエンドポイントを実行した後、metricsのエンドポイントにアクセスすると、正常にcustom_requests_totalのメトリクスが取得できていることが確認できます。
Prometheusのダッシュボードで確認する
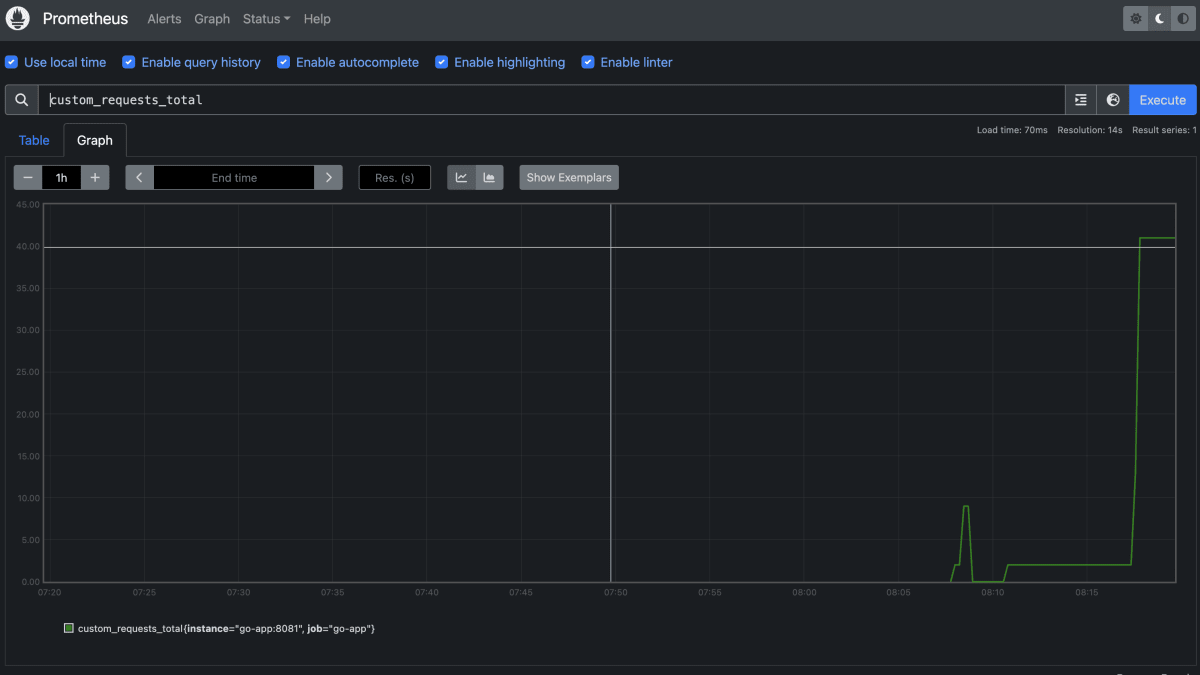
このように、Prometheusのダッシュボードからでもメトリクスが正常に取得できていることを確認できます。
※再起動してしまったので画像では数値が下がっていますが、基本的には増え続けます。
PromQL
増え続けるメトリクスに対しては、rate 等のPromQLが使いやすいです。
例えば、rate(custom_requests_total[1m])というPromQLを実行すると、過去1分間でのリクエスト数の推移をみることができ、1分間でHello worldエンドポイントが平均的にどれぐらい実行されているかを確認できます。

他にも、ログイン用のエンドポイントにこのCounterを設置しておき、1分間で何回ログイン失敗が行われたかを観測することができます。こうすることで、ブルートフォースアタックによる攻撃を検知することができます。
Gauge
次に、Gaugeについて解説します。
Gaugeとは
Gaugeはある特定のタイミングでの状態を表す数値です。
例えば、現在のメモリ使用量・現在のアクティブなスレッドの数などが計測対象です。
Countと違い、現在の状態を表す数値のため、増えたり減ったりします。
GaugeをGoサーバーに実装する
GaugeのGoサーバーへの実装はCountとほぼ同じです。
main.go
package main

import (
	"errors"
	"github.com/labstack/echo-contrib/echoprometheus"
	"github.com/labstack/echo/v4"
	"github.com/prometheus/client_golang/prometheus"
	"log"
	"net/http"
)

func main() {
	e := echo.New()                              // this Echo instance will serve route on port 8080
	e.Use(echoprometheus.NewMiddleware("myapp")) // adds middleware to gather metrics

	go func() {
		metrics := echo.New()                                // this Echo will run on separate port 8081
		metrics.GET("/metrics", echoprometheus.NewHandler()) // adds route to serve gathered metrics
		if err := metrics.Start(":8081"); err != nil && !errors.Is(err, http.ErrServerClosed) {
			log.Fatal(err)
		}
	}()

	customGauge := prometheus.NewGauge(
		prometheus.GaugeOpts{
			Name: "hello_world_last_request_time",
			Help: "Last time a request was served",
		},
	)
	if err := prometheus.Register(customGauge); err != nil {
		log.Fatal(err)
	}
	e.GET("/", func(c echo.Context) error {
		customGauge.SetToCurrentTime()
		return c.String(http.StatusOK, "Hello, World!")
	})

	if err := e.Start(":8080"); err != nil && !errors.Is(err, http.ErrServerClosed) {
		log.Fatal(err)
	}
}
	customGauge := prometheus.NewGauge(
		prometheus.GaugeOpts{
			Name: "hello_world_last_request_time",
			Help: "Last time a request was served",
		},
	)
	if err := prometheus.Register(customGauge); err != nil {
		log.Fatal(err)
	}
ここでcustomGaugeを設定し、
	e.GET("/", func(c echo.Context) error {
		customGauge.SetToCurrentTime()
		return c.String(http.StatusOK, "Hello, World!")
	})
こちらで、現在時刻をセットします。
これで、最後にアクセスした時間がhello_world_last_request_timeに設定されます。
メトリクスを確認する
$ curl localhost:8081/metrics
# HELP go_gc_duration_seconds A summary of the pause duration of garbage collection cycles.
...
# HELP hello_world_last_request_time Last time a request was served
# TYPE hello_world_last_request_time gauge
hello_world_last_request_time 1.7069172233843265e+09
...
localhost:8080にアクセスした後、メトリクスエンドポイントをcurlすると、正常にhello_world_last_request_timeが取得されているのを確認できます。
Prometheusのダッシュボードで確認する

Prometheus上のダッシュボードでも確認ができました。
Gaugeのメソッド一覧
type Gauge interface {
	Metric
	Collector

	// Set sets the Gauge to an arbitrary value.
	Set(float64)
	// Inc increments the Gauge by 1. Use Add to increment it by arbitrary
	// values.
	Inc()
	// Dec decrements the Gauge by 1. Use Sub to decrement it by arbitrary
	// values.
	Dec()
	// Add adds the given value to the Gauge. (The value can be negative,
	// resulting in a decrease of the Gauge.)
	Add(float64)
	// Sub subtracts the given value from the Gauge. (The value can be
	// negative, resulting in an increase of the Gauge.)
	Sub(float64)

	// SetToCurrentTime sets the Gauge to the current Unix time in seconds.
	SetToCurrentTime()
}
今回はSetToCurrentTimeを利用しましたが、Gaugeには様々なメソッドが存在し、適切なメソッドを利用することでメトリクスを計測していきます。
Summary
次にSummaryを解説します。
Summaryとは
Summaryは少し特殊な計測方法で、2つのメトリクスを同時に取得することできます。
1つはメトリクスを計測した回数で、もう一つはそのメトリクスの実際の値の合計です。
例えば、リクエスト数とそのリクエストにかかった時間の合計が同時に取得可能です。
2つの数値を取得する意味
2つの数値を取得することで、特定のメトリクスの平均値を取ることができます。
例えば、10回Hello, World!にリクエストが発生した場合のリクエスト回数(10)と全てのリクエストにかかった時間の合計を保持することで、1回の平均リクエスト時間を計測できます。
SummaryをGoサーバーに実装する
Summaryも他のメトリクスと同じような設定方法です。
main.go
package main

import (
	"errors"
	"github.com/labstack/echo-contrib/echoprometheus"
	"github.com/labstack/echo/v4"
	"github.com/prometheus/client_golang/prometheus"
	"log"
	"net/http"
	"time"
)

func main() {
	e := echo.New()                              // this Echo instance will serve route on port 8080
	e.Use(echoprometheus.NewMiddleware("myapp")) // adds middleware to gather metrics

	go func() {
		metrics := echo.New()                                // this Echo will run on separate port 8081
		metrics.GET("/metrics", echoprometheus.NewHandler()) // adds route to serve gathered metrics
		if err := metrics.Start(":8081"); err != nil && !errors.Is(err, http.ErrServerClosed) {
			log.Fatal(err)
		}
	}()

	customSummary := prometheus.NewSummary(
		prometheus.SummaryOpts{
			Name: "hello_latency_seconds",
			Help: "Time taken to serve the request",
		},
	)
	if err := prometheus.Register(customSummary); err != nil {
		log.Fatal(err)
	}
	e.GET("/", func(c echo.Context) error {
		start := time.Now()
		time.Sleep(1000 * time.Millisecond)
		customSummary.Observe(time.Since(start).Seconds())
		return c.String(http.StatusOK, "Hello, World!")
	})

	if err := e.Start(":8080"); err != nil && !errors.Is(err, http.ErrServerClosed) {
		log.Fatal(err)
	}
}
	customSummary := prometheus.NewSummary(
		prometheus.SummaryOpts{
			Name: "hello_latency_seconds",
			Help: "Time taken to serve the request",
		},
	)
	if err := prometheus.Register(customSummary); err != nil {
		log.Fatal(err)
	}
ここでlatencyに関するSummaryを設定します。
	e.GET("/", func(c echo.Context) error {
		start := time.Now()
		time.Sleep(1000 * time.Millisecond)
		customSummary.Observe(time.Since(start).Seconds())
		return c.String(http.StatusOK, "Hello, World!")
	})
Hello, World!エンドポイントに対して、1秒待ってからリクエストを返すプログラムを実装し、リクエストにかかった時間をSummaryで計測できるようにします。
メトリクスを確認する
$ curl localhost:8081/metrics
...
# HELP hello_latency_seconds Time taken to serve the request
# TYPE hello_latency_seconds summary
hello_latency_seconds_sum 6.005802836000001
hello_latency_seconds_count 6
...
上記のように、2つのメトリクスが取得できることを確認できます。
前者は全てのリクエストにかかった総時間・後者は回数です。
このように2つのメトリクスを取得し、前者を後者で割り算することで、1回あたりの平均を計測することができます。
Prometheusのダッシュボードで確認する


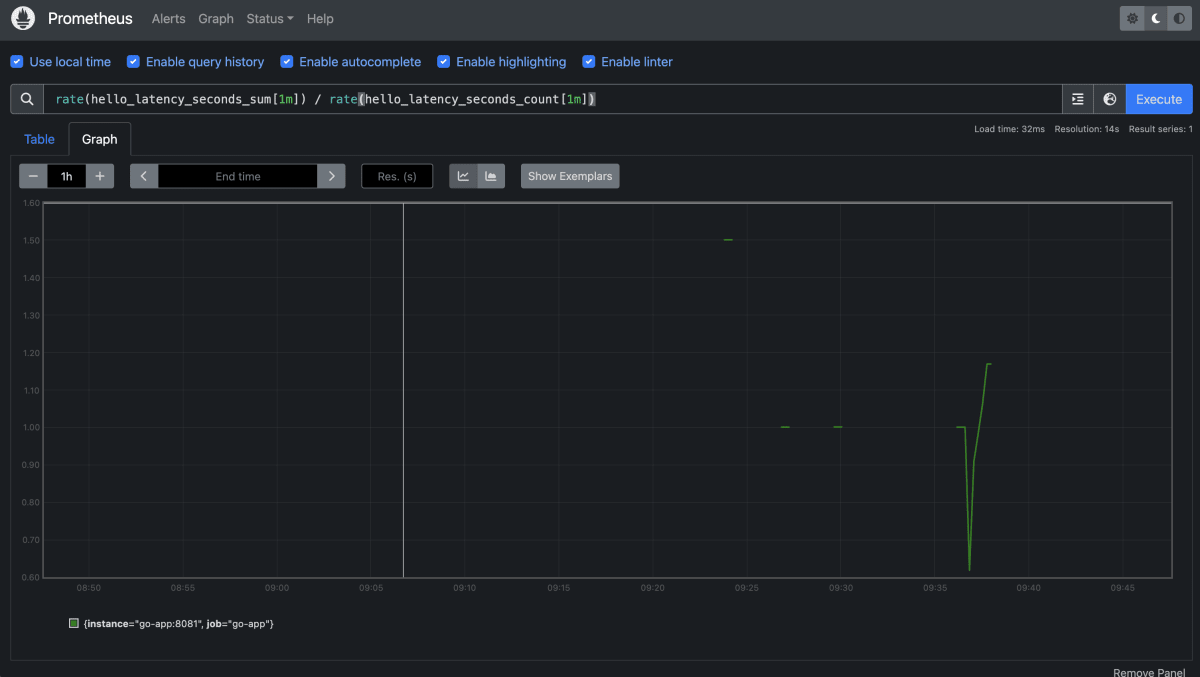
Prometheusのダッシュボードでも正常にメトリクスを確認できます。
PromQL
rate(hello_latency_seconds_sum[1m]) / rate(hello_latency_seconds_count[1m]) というPromQLを実行することで、過去一分間の平均実行時間を取得できます。
Histogram
最後にHistogramについて解説します。
Histogramとは
Histogramは特定のパーセンタイル単位でメトリクスを取得する際に利用される計測単位です。
例えば、95パーセンタイルのリクエストが何秒以下で処理されているなどを計測します。
HistogramをGoサーバーに実装する
Histogramの実装はSummaryとほぼ同じです。
main.go
package main

import (
	"errors"
	"github.com/labstack/echo-contrib/echoprometheus"
	"github.com/labstack/echo/v4"
	"github.com/prometheus/client_golang/prometheus"
	"log"
	"net/http"
	"time"
	"math/rand"
)

func main() {
	e := echo.New()                              // this Echo instance will serve route on port 8080
	e.Use(echoprometheus.NewMiddleware("myapp")) // adds middleware to gather metrics

	go func() {
		metrics := echo.New()                                // this Echo will run on separate port 8081
		metrics.GET("/metrics", echoprometheus.NewHandler()) // adds route to serve gathered metrics
		if err := metrics.Start(":8081"); err != nil && !errors.Is(err, http.ErrServerClosed) {
			log.Fatal(err)
		}
	}()

	customHistogram := prometheus.NewHistogram(
		prometheus.HistogramOpts{
			Name: "hello_latency_seconds",
			Help: "Time taken to serve the request",
		},
	)
	if err := prometheus.Register(customHistogram); err != nil {
		log.Fatal(err)
	}
	e.GET("/", func(c echo.Context) error {
		start := time.Now()
		wait := rand.Intn(2000)
		time.Sleep(time.Duration(wait) * time.Millisecond)
		customHistogram.Observe(time.Since(start).Seconds())
		return c.String(http.StatusOK, "Hello, World!")
	})

	if err := e.Start(":8080"); err != nil && !errors.Is(err, http.ErrServerClosed) {
		log.Fatal(err)
	}
}
	customHistogram := prometheus.NewHistogram(
		prometheus.HistogramOpts{
			Name: "hello_latency_seconds",
			Help: "Time taken to serve the request",
		},
	)
	if err := prometheus.Register(customHistogram); err != nil {
		log.Fatal(err)
	}
ここでHistogramをセッティングします。
	e.GET("/", func(c echo.Context) error {
		start := time.Now()
		wait := rand.Intn(2000)
		time.Sleep(time.Duration(wait) * time.Millisecond)
		customHistogram.Observe(time.Since(start).Seconds())
		return c.String(http.StatusOK, "Hello, World!")
	})
ここで、Hello, World!エンドポイントに費やした時間を計測します。
ヒストグラムのバケット単位での値が理解しやすいように、今回はランダムに待ち時間を設定しました。
メトリクスを確認する
$ curl localhost:8081/metrics
...
# HELP hello_latency_seconds Time taken to serve the request
# TYPE hello_latency_seconds histogram
hello_latency_seconds_bucket{le="0.005"} 0
hello_latency_seconds_bucket{le="0.01"} 0
hello_latency_seconds_bucket{le="0.025"} 0
hello_latency_seconds_bucket{le="0.05"} 0
hello_latency_seconds_bucket{le="0.1"} 0
hello_latency_seconds_bucket{le="0.25"} 0
hello_latency_seconds_bucket{le="0.5"} 2
hello_latency_seconds_bucket{le="1"} 6
hello_latency_seconds_bucket{le="2.5"} 10
hello_latency_seconds_bucket{le="5"} 10
hello_latency_seconds_bucket{le="10"} 10
hello_latency_seconds_bucket{le="+Inf"} 10
hello_latency_seconds_sum 9.684856836
hello_latency_seconds_count 10
...
このように複数の単位のメトリクスが取得できます。(各行をそれぞれバケットと呼びます。ex: 0.005バケット・0.01バケット等)
上記の例だと、
- 0.5秒以内に完了したリクエストが2回
- 1秒以内に完了したリクエストが6回
- 2.5秒以内に完了したリクエストが10回
...
という計測結果です。(0.5秒以内に完了したリクエスト数は、1秒以内に完了したリクエスト数に含まれるため、0.5秒以上かつ1秒以内に完了したリクエスト数は4回になります)
Prometheusのダッシュボードで確認する

各バケットの値が線グラフで表されており、非常にわかりやすいです。
バケットの設定
Prometheusは自動でバケットの単位を設定してくれますが、自分でバケットの単位を設定することも可能です。
HistogramとSummaryについて
Histogramを使うと、Summaryで取得できる全ての合計時間と回数を取得できます。
どうせ同じ値が取得できるかつ、バケット単位で詳しいメトリクスも取得できるのならばHistogramだけを使えばいいじゃんと思うかもしれませんが、実際のところバケット単位でのメトリクスが必要ない場合はSummaryを利用してください。
なぜなら、Prometheusは非常に大量のデータを保存します。その際に不要なデータも保存するとパフォーマンスやコストに悪い影響があります。そのため、カーディナリティを下げるために不要なメトリクスは取得しないべきです。
まとめ
Prometheusの基本的な4つの計測方法を紹介しました。
note
勉強法やキャリア構築法など、エンジニアに役立つ記事をnoteで配信しています。
Discussion