Dockerで動作するGoのEchoサーバーをPrometheusで監視する
記事の内容
Dockerとdocker-compose上で動作するGoのEchoサーバーにPrometheusがスクレイピングする用のmetricsエンドポイントを追加します。
記事の長さ
3分で読めます
Goの検証環境を用意する
まず最初にモニタリング対象となるGoで動くWebサーバーを構築します。
Echoの公式チュートリアルに作成します。
Goの環境構築
Goの環境構築を行います。
$ go mod init myapp
$ go get github.com/labstack/echo/v4
今回のプロジェクトを作成するディレクトリにて上記を実行してください。
すると、go.sum等のGoプロジェクトに必要なファイルが作成されます。
Webサーバーの構築
Goの環境構築が完了したので、Webサーバーを起動するGoのコードを追加します。
main.go
package main

import (
  "net/http"

  "github.com/labstack/echo/v4"
)

func main() {
  e := echo.New()
  e.GET("/", func(c echo.Context) error {
    return c.String(http.StatusOK, "Hello, World!")
  })
  e.Logger.Fatal(e.Start(":8080"))
}
8080ポートでhttpリクエストをリッスンするGoコードです。
Dockerで動かす
次に、main.goをDocker上で動作させます。
Airを使う
airコマンドでGoアプリケーションを起動すると、ファイルが変更されたときに自動で再起動を行い、変更を自動反映してくれます。
そのため、今回はAirを使ってGoを動かします。 (Goが動く環境なら、Airを使わなくても大丈夫です。)
Dockerfile
FROM golang:1.21.5
WORKDIR /app
RUN go install github.com/cosmtrek/air@latest
CMD ["air"]
.air.toml
# Config file for [Air](https://github.com/cosmtrek/air) in TOML format

# Working directory
# . or absolute path, please note that the directories following must be under root.
root = "."
tmp_dir = "tmp"

[build]
# Array of commands to run before each build
pre_cmd = ["echo 'hello air' > pre_cmd.txt"]
# Just plain old shell command. You could use `make` as well.
cmd = "go build -o ./tmp/main ."
# Array of commands to run after ^C
post_cmd = ["echo 'hello air' > post_cmd.txt"]
# Binary file yields from `cmd`.
bin = "tmp/main"
# Customize binary, can setup environment variables when run your app.
full_bin = "APP_ENV=dev APP_USER=air ./tmp/main"
# Watch these filename extensions.
include_ext = ["go", "tpl", "tmpl", "html"]
# Ignore these filename extensions or directories.
exclude_dir = ["assets", "tmp", "vendor", "frontend/node_modules"]
# Watch these directories if you specified.
include_dir = []
# Watch these files.
include_file = []
# Exclude files.
exclude_file = []
# Exclude specific regular expressions.
exclude_regex = ["_test\\.go"]
# Exclude unchanged files.
exclude_unchanged = true
# Follow symlink for directories
follow_symlink = true
# This log file places in your tmp_dir.
log = "air.log"
# Poll files for changes instead of using fsnotify.
poll = false
# Poll interval (defaults to the minimum interval of 500ms).
poll_interval = 500 # ms
# It's not necessary to trigger build each time file changes if it's too frequent.
delay = 0 # ms
# Stop running old binary when build errors occur.
stop_on_error = true
# Send Interrupt signal before killing process (windows does not support this feature)
send_interrupt = false
# Delay after sending Interrupt signal
kill_delay = 500 # nanosecond
# Rerun binary or not
rerun = false
# Delay after each executions
rerun_delay = 500
# Add additional arguments when running binary (bin/full_bin). Will run './tmp/main hello world'.
args_bin = ["hello", "world"]

[log]
# Show log time
time = false
# Only show main log (silences watcher, build, runner)
main_only = false

[color]
# Customize each part's color. If no color found, use the raw app log.
main = "magenta"
watcher = "cyan"
build = "yellow"
runner = "green"

[misc]
# Delete tmp directory on exit
clean_on_exit = true

[screen]
clear_on_rebuild = true
keep_scroll = true
docker compose を用意する
次に、docker-compose.ymlファイルを用意して、作成したDockerfileを元にGoアプリケーションを起動します。
docker-compose.yml
version: "3.9"

services:
  go-app:
    build: .
    container_name: go-app
    restart: always
    volumes:
      - .:/app
    ports:
      - "8080:8080"
ここまで準備が完了したら、ファイル構成は以下のようになっているはずです。
$ tree -a -L 1
.
├── .air.toml
├── Dockerfile
├── docker-compose.yml
├── go.mod
├── go.sum
├── main.go
この状態でdocker compose upコマンドを実行して、Goのサーバーが起動することを確認します。
$ docker compose up
...
起動したことを確認したら、curlコマンドで正常にHello, Worldという文字が返ってくることを確認しましょう。
$ curl localhost:8080
Hello, World!%
これで、Goサーバーの準備は完了です。
Prometheus用のエンドポイントを追加する
Goの準備が完了したので、GoのサーバーにPrometheus用のエンドポイントを準備します。
Prometheus用のEndpointを追加する
Echoの公式がPrometheus用のエンドポイントの設定方法を公開しているため、こちらに従って作成します。
main.goを以下のように変更してください。
main.go
package main

import (
	"errors"
	"github.com/labstack/echo-contrib/echoprometheus"
	"github.com/labstack/echo/v4"
	"log"
	"net/http"
)

func main() {
	e := echo.New()                              // this Echo instance will serve route on port 8080
	e.Use(echoprometheus.NewMiddleware("myapp")) // adds middleware to gather metrics

	go func() {
		metrics := echo.New()                                // this Echo will run on separate port 8081
		metrics.GET("/metrics", echoprometheus.NewHandler()) // adds route to serve gathered metrics
		if err := metrics.Start(":8081"); err != nil && !errors.Is(err, http.ErrServerClosed) {
			log.Fatal(err)
		}
	}()

  e.GET("/", func(c echo.Context) error {
    return c.String(http.StatusOK, "Hello, World!")
  })

	if err := e.Start(":8080"); err != nil && !errors.Is(err, http.ErrServerClosed) {
		log.Fatal(err)
	}
}
今回はPrometheus用のエンドポイントを8081ポートで公開します。
8081ポートをdocker-composeにも追加します。
docker-compose.yml
version: "3.9"

services:
  go-app:
    build: .
    container_name: go-app
    restart: always
    volumes:
      - .:/app
    ports:
      - "8080:8080"
      - "8081:8081"
この状態で再度、docker compose upコマンドでDockerコンテナを再起動します。
$ docker compose up
正常にmetricsが公開されいてるかどうかcurlコマンドで確認します。
$ curl localhost:8081/metrics
# HELP go_gc_duration_seconds A summary of the pause duration of garbage collection cycles.
# TYPE go_gc_duration_seconds summary
go_gc_duration_seconds{quantile="0"} 0
go_gc_duration_seconds{quantile="0.25"} 0
...
# HELP promhttp_metric_handler_requests_in_flight Current number of scrapes being served.
# TYPE promhttp_metric_handler_requests_in_flight gauge
promhttp_metric_handler_requests_in_flight 1
# HELP promhttp_metric_handler_requests_total Total number of scrapes by HTTP status code.
# TYPE promhttp_metric_handler_requests_total counter
promhttp_metric_handler_requests_total{code="200"} 1
promhttp_metric_handler_requests_total{code="500"} 0
promhttp_metric_handler_requests_total{code="503"} 0
prometheusを準備する
Echoでmetricsが公開されていることを確認できたため、Prometheusの準備に移ります。
設定ファイルの作成
Prometheusのスクレイピング設定をする設定ファイルを作成します。
prometheus.yml
global:
  scrape_interval: 15s
scrape_configs:
  - job_name: go-app
    static_configs:
      - targets:
        - go-app:8081
※Dockerネットワーク上で動作するため、localhostではなくコンテナ名であるgo-appをエンドポイントとして設定する必要があります。
PrometheusのDockerImageを設定する
PrometheusをDockerで起動します。
docker-compose.ymlファイルに以下を追加してください。
docker-compose.yml
version: "3.9"

services:
  prometheus-container:
    image: prom/prometheus
    container_name: prometheus-container
    ports:
     - '9090:9090'
    volumes:
     - './prometheus.yml:/etc/prometheus/prometheus.yml'
     - 'prometheus-data:/prometheus'
    restart: always
  go-app:
    build: .
    container_name: go-app
    restart: always
    volumes:
      - .:/app
    ports:
      - "8080:8080"
      - "8081:8081"
volumes:
  prometheus-data: {}
上記のファイルを用意できたら、再度docker compose upにて再起動を実行します。
$ docker compose up
...
すると、9090ポートでPrometheusが起動するので、http://localhost:9090/targetsにアクセスして正常にGoのmetricsがターゲットに追加されていることを確認します。
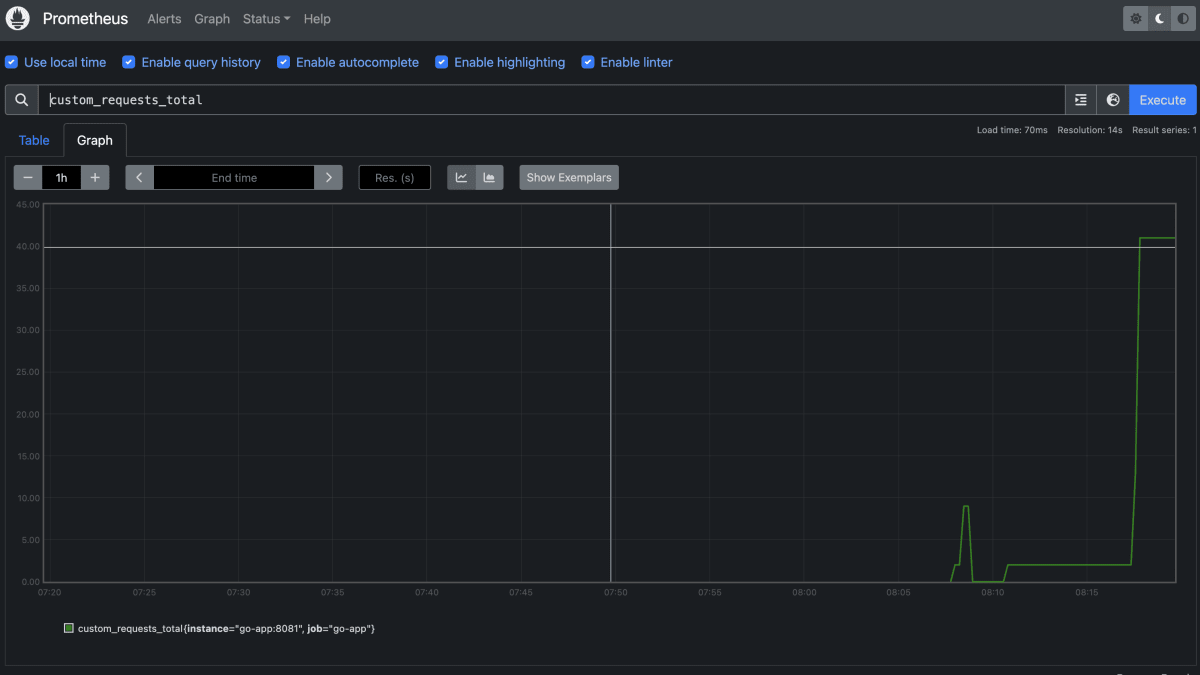
Prometheusでクエリを実行する
GoのEchoサーバーが正常にprometheusで監視されているのを確認できたので、適当にクエリを流してみます。

正常にグラフ化できていることを確認できました。
まとめ
GoのEchoサーバーをPrometheusで監視する方法を紹介しました。
Sample Source
今回作成したファイルはこちらに配置してあります。
note
勉強法やキャリア構築法など、エンジニアに役立つ記事をnoteで配信しています。
Discussion