👌
関数の特異値分解
二次元の箱
以下、コードである。
using LinearAlgebra
using Plots
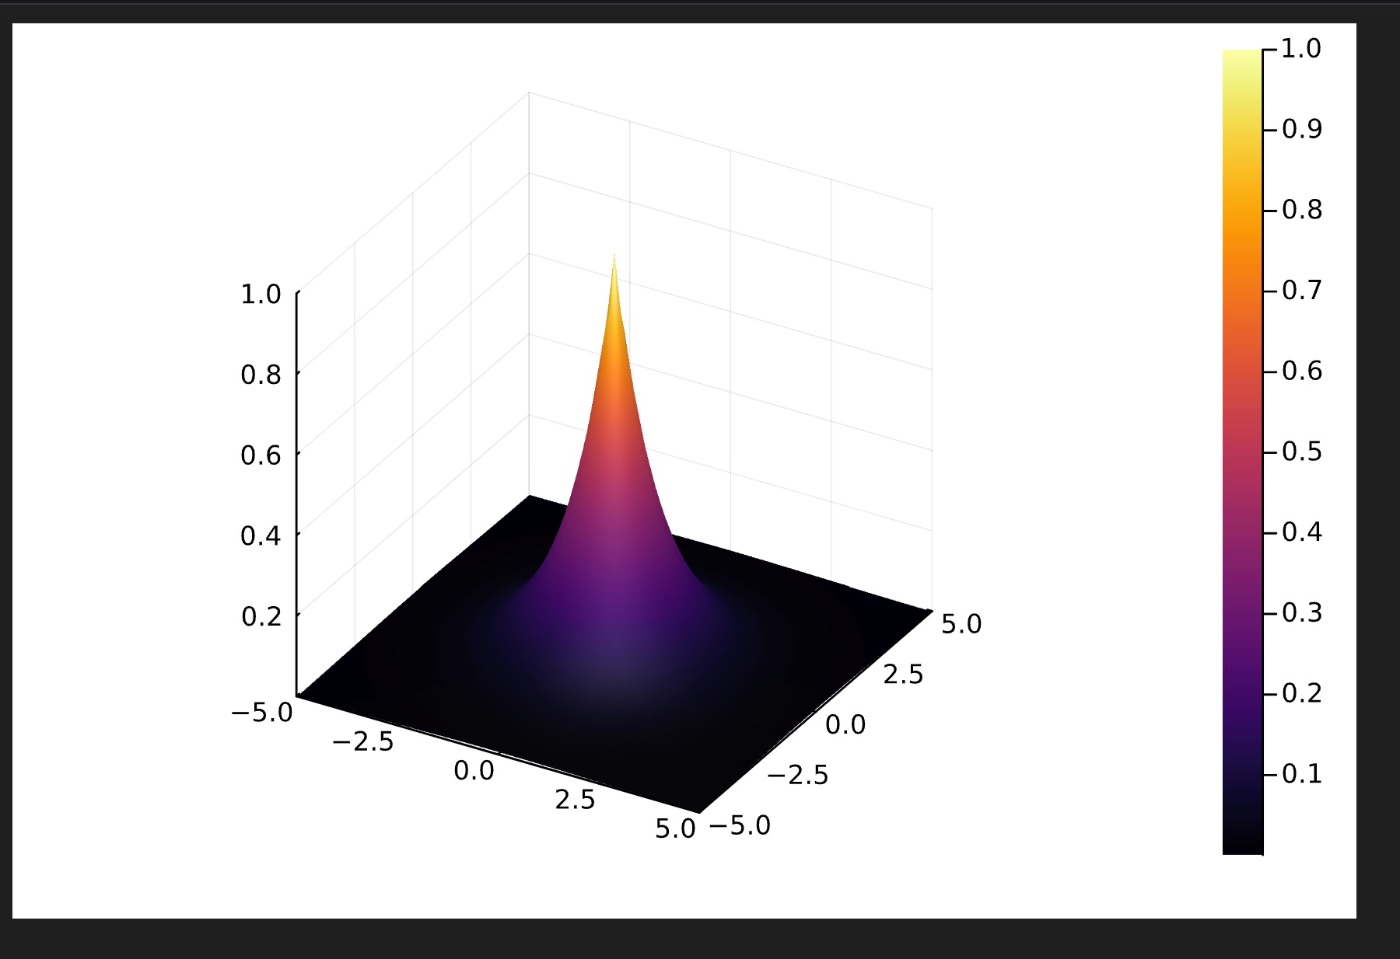
function Gener_Slat(n1, b, alpha1)
h1 = b / (n1 - 1)
x = -b/2:h1:b/2
y = -b/2:h1:b/2
Fun1 = zeros(n1, n1)
for i = 1:n1
Fun1[i, :] .= exp.(-alpha1 .* sqrt.(x[i]^2 .+ y[:].^2))
end
S1 = svd(Fun1).S
sigmas = diagm(S1)
return Fun1, sigmas, x, y
end
# Example 1
b = 10
alp = 1
Fun, sigmas, x, y = Gener_Slat(65, b, alp)
diag(sigmas)
# Second plot
p1 = surface(x, y, Fun)
# First plot
_, sigmas_257, _, _ = Gener_Slat(257, b, alp)
_, sigmas_513, _, _ = Gener_Slat(513, b, alp)
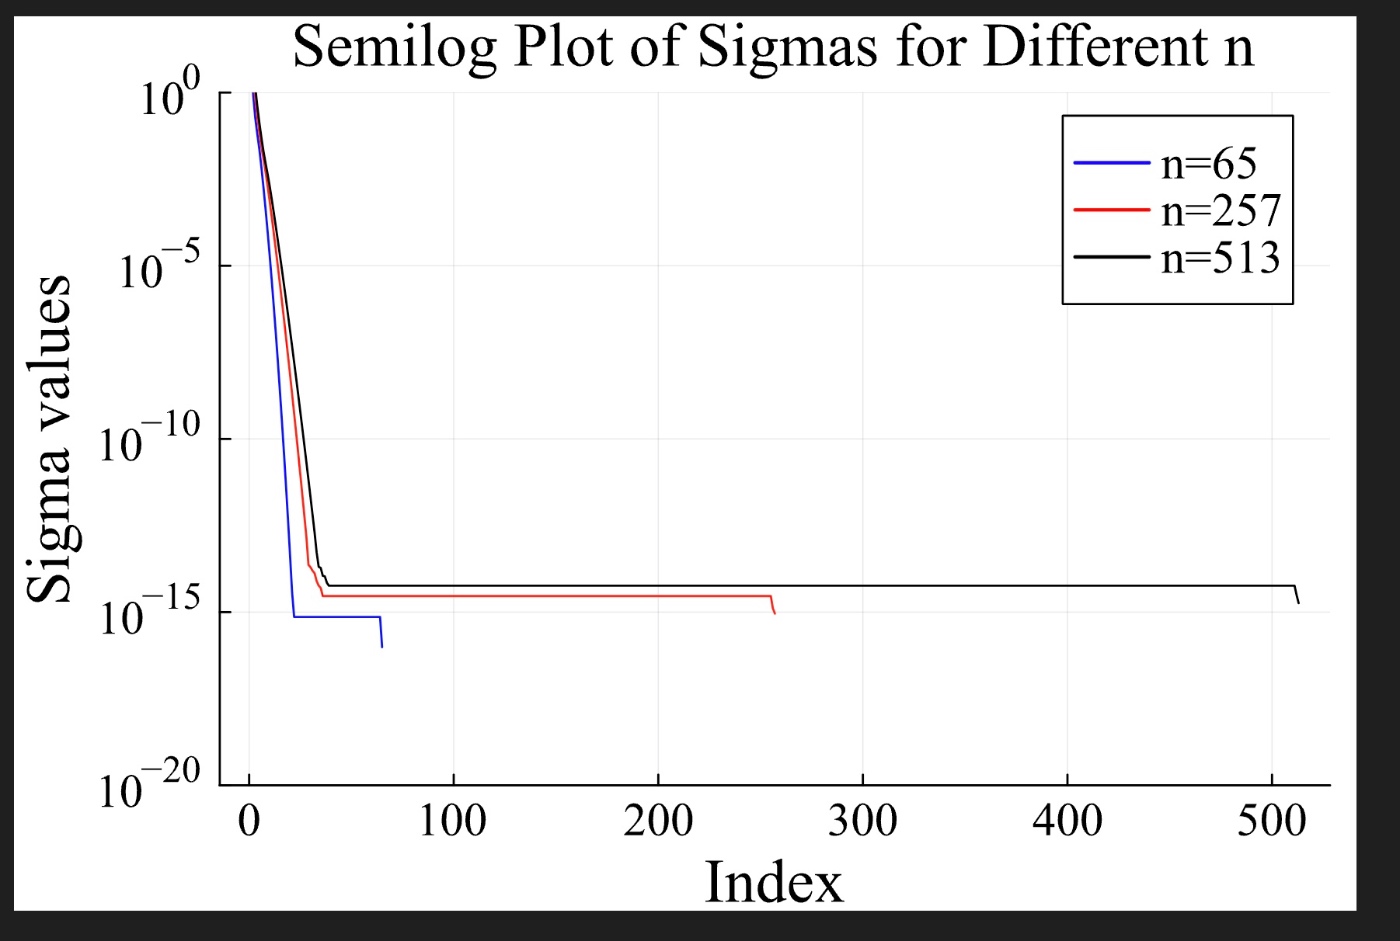
plot_dims = plot(
yaxis =:log10,
#xaxis = :log,
title ="Semilog Plot of Sigmas for Different n",
xlabel = "Index",
ylabel = "Sigma values",
#markershape = :circle,
titlefontsize = 17,
legendfontsize = 13,
tickfontsize = 13,
xguidefont = 17,
yguidefont = 17,
#xlims = (1.0, 3.1),
ylims = (10^(-20), 10^0),
#yticks =([10^0, 10^1,]),
#xticks = (collect(range(1,2*R-1, R))),
#legend = :topleft,
fontfamily = "Times New Roman",
leftmargin=Plots.Measures.Length(:mm, 2.0),
)
plot!(plot_dims, (diag(sigmas)), label="n=65", color=:blue)
plot!(plot_dims, diag(sigmas_257), label="n=257", color=:red)
plot!(plot_dims, diag(sigmas_513), label="n=513", color=:black)
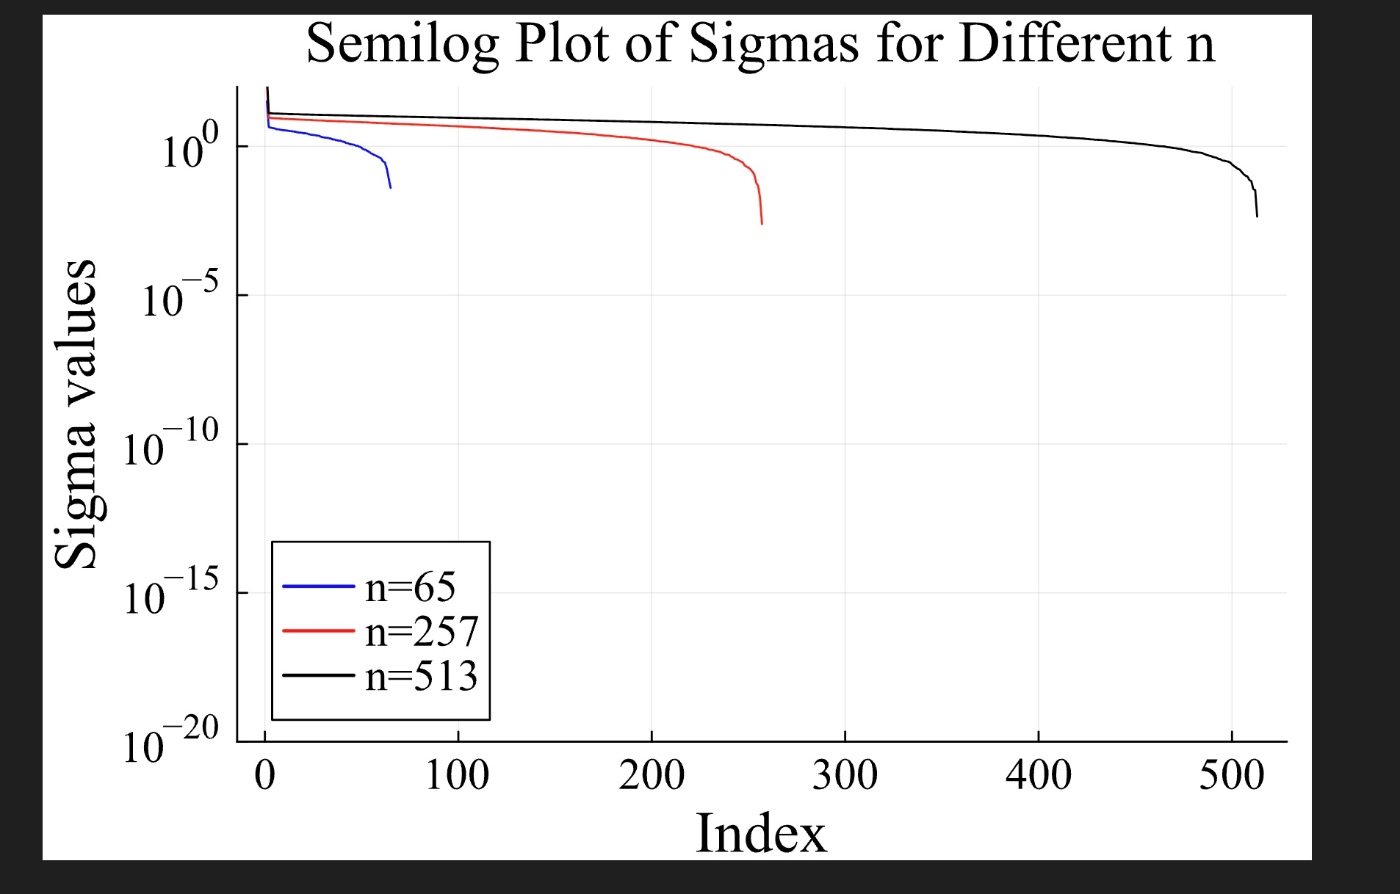
ランダムな配列は特異値が急激には下がらない。
# Third plot
A1 = rand(65, 65)
S1 = svd(A1).S
#plot(semilogy(diagm(S1)), label="n=65", legend=:topleft)
#hold(true)
A2 = rand(257, 257)
S2 = svd(A2).S
#plot!(semilogy(diagm(S1)), label="n=257", color=:red)
A3 = rand(513, 513)
S3 = svd(A3).S
#plot!(semilogy(diagm(S1)), label="n=513", color=:black)


plot_dims = plot(
    yaxis =:log10,
    #xaxis = :log,
    title ="Semilog Plot of Sigmas for Different n",
    xlabel = "Index",
    ylabel = "Sigma values",
    #markershape = :circle,
    titlefontsize = 17,
    legendfontsize = 13,
    tickfontsize = 13,
    xguidefont = 17,
    yguidefont = 17,
    #xlims = (1.0, 3.1),
    ylims = (10^(-20), 10^2),
    #yticks =([10^0, 10^1,]),
    #xticks = (collect(range(1,2*R-1, R))),
    legend = :bottomleft,
    fontfamily = "Times New Roman",
    leftmargin=Plots.Measures.Length(:mm, 2.0),
    )

plot!(plot_dims, (S1), label="n=65", color=:blue)
plot!(plot_dims, S2, label="n=257", color=:red)
plot!(plot_dims, S3, label="n=513", color=:black)
Discussion