tokadev です。 OvertureMaps が発表されて以来触ってなかったので理解のためにデモアプリを作ってみることにしました。
構成
データは 2025-08-20.1 Release 、 Parquet を利用するため DuckDB 経由で S3 を取得します。
構成はなるべくシンプルにしたいので Deno + Hono + DuckDB + Vue + MapLibre GL で実装。
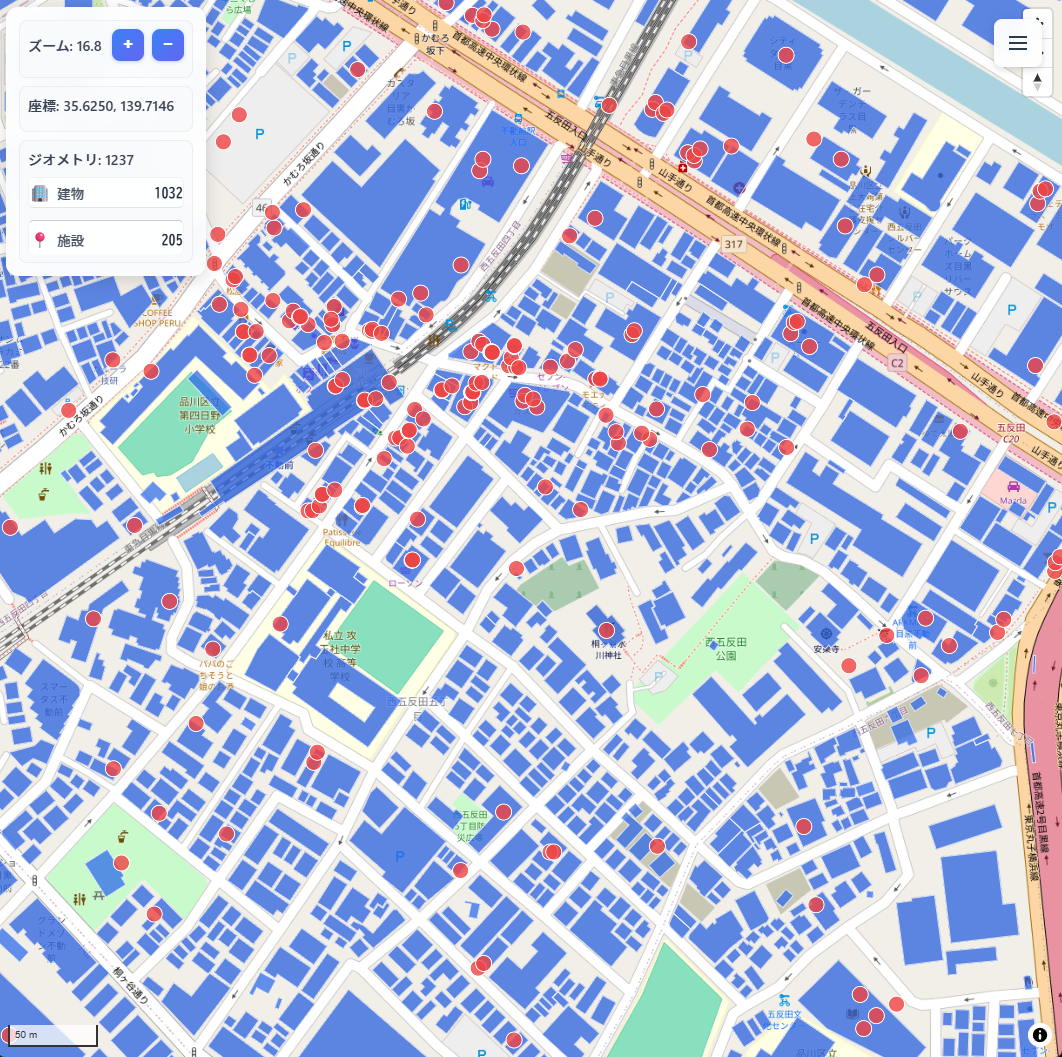
先に完成形イメージから。青い四角が Buildings のポリゴン、 赤い点が Places のポイントジオメトリです。
画像は例として不動前周辺地域を表示、表示領域中のジオメトリがそれぞれどの程度あるかを見るためコンポーネントに表示しています。
サーバー側実装
DuckDB
DuckDB を使って S3 Parquet ファイルにアクセスします。
// server/database.ts
import duckdb from "duckdb";

const { Database } = duckdb;
let db: Database | null = null;

export async function initDatabase(): Promise<void> {
  try {
    db = new Database(":memory:");

    await executeQuery(`INSTALL httpfs; LOAD httpfs;`);
    await executeQuery(`INSTALL spatial; LOAD spatial;`);

    await executeQuery("SET s3_region='us-west-2';");

  } catch (error) {
    console.error("initDatabase: init failed. :", error);
    throw error;
  }
}
ジオメトリの取得
バウンディングボックスを指定して範囲内の建物データを取得します。
export async function fetchBuildings(bbox, limit = 5000) {
  const query = `
    SELECT id, ST_AsGeoJSON(geometry) as geometry, names, height
    FROM read_parquet('s3://overturemaps-us-west-2/release/2025-08-20.1/theme=buildings/type=building/*',
                      filename=true, hive_partitioning=1)
    WHERE bbox.xmin <= ${bbox.maxLng} AND bbox.xmax >= ${bbox.minLng}
      AND bbox.ymin <= ${bbox.maxLat} AND bbox.ymax >= ${bbox.minLat}
    LIMIT ${limit};
  `;

  const results = await executeQuery(query);
  return results.map(row => ({
    type: "Feature",
    geometry: JSON.parse(row.geometry),
    properties: { names: row.names, height: row.height }
  }));
}
API エンドポイント
Hono を使って REST API を提供します。
// server/main.ts
import { Hono } from "hono";
import { cors } from "hono/cors";
import { initDatabase, fetchBuildings } from "./database.ts";

const app = new Hono();
app.use('*', cors())

app.get("/api/buildings", async (c) => {
  const { minLat, maxLat, minLng, maxLng } = c.req.query();
  const bbox = {
    minLat: +minLat,
    maxLat: +maxLat,
    minLng: +minLng,
    maxLng: +maxLng
  };

  const features = await fetchBuildings(bbox);
  return c.json({ type: "FeatureCollection", features });
});

await initDatabase();
Deno.serve({ port: 9801 }, app.fetch);
フロントエンド
地図を表示して Overture Maps のデータをオーバーレイします。
<template>
  <div class="map-container">
    <div ref="mapContainer" class="map"></div>
    <div class="control-panel">
      <div>ズーム: {{ zoom.toFixed(1) }}</div>
      <div v-if="stats.total">
        建物: {{ stats.buildings }}
        施設: {{ stats.places }}
      </div>
    </div>
  </div>
</template>

<script setup>
import { ref, onMounted } from 'vue'
import maplibregl from 'maplibre-gl'

const mapContainer = ref()
const map = ref()
const zoom = ref(14)
const stats = ref({ buildings: 0, places: 0, total: 0 })

onMounted(() => {
  map.value = new maplibregl.Map({
    container: mapContainer.value,
    style: 'https://demotiles.maplibre.org/style.json',
    center: [139.7028, 35.6586], // 東京
    zoom: 14
  })

  map.value.on('moveend', async () => {
    const bounds = map.value.getBounds()
    const bbox = {
      minLat: bounds.getSouth(),
      maxLat: bounds.getNorth(),
      minLng: bounds.getWest(),
      maxLng: bounds.getEast()
    }

    const res = await fetch(`/api/buildings?${new URLSearchParams(bbox)}`)
    const data = await res.json()

    if (map.value.getSource('buildings')) {
      map.value.getSource('buildings').setData(data)
    } else {
      map.value.addSource('buildings', { type: 'geojson', data })
      map.value.addLayer({
        id: 'buildings-layer',
        type: 'fill',
        source: 'buildings',
        paint: { 'fill-color': '#0080ff', 'fill-opacity': 0.5 }
      })
    }

    stats.value.buildings = data.features.length
    stats.value.total = data.features.length
  })
})
</script>
GERS (Global Entity Reference System)
= 地理空間エンティティの一意識別子システム。2025年6月から一般提供開始されています。
-- GERS ID で特定の建物を取得
SELECT id, ST_AsGeoJSON(geometry) as geometry, names, height
FROM read_parquet('s3://overturemaps-us-west-2/release/2025-08-20.1/theme=buildings/*')
WHERE id = '08bf2a30000007ff9c3f3d5ba6843543'
Hive Partitioning
パーティションキーに基づいてテーブルを複数のファイルに分割するパーティショニング戦略のこと。 hive_partitioning フラグを有効にすることで必要なパーティションにのみアクセス出来るようになり、転送量を削減できます。
-- Hive パーティショニングを有効にしてクエリ
FROM read_parquet(
  's3://overturemaps-us-west-2/release/2025-08-20.1/theme=buildings/type=building/*',
  filename=true,
  hive_partitioning=1
)
おわりに
- 直近のマイルストーンについて
2024年のリリースに少し触れて以来どのように更新されているのか追っていなかったので主要どころだけピックアップ。データセットも定期的にアップデートされ、道路や交通機関・水路などのインフラも強化しているようです。
2024-12-18: Transportation データセットが GA、全世界で8600万kmの道路データを提供
2025-06-25: Global Entity Reference System が GA、地理空間エンティティ (Buildings,Places,Addresses,Road Segments) に固有IDとしてUUID (v4) が付与される。
※ 最新版は v1.11.0
住所データも提供もあるのでジオコーディングに利用してみるのも良さそうです。
以前ジオコーディングAPIを比較する記事を書きましたが、いずれ OvertureMaps Addresses も交えて再比較してみても面白いかもしれませんのでまたいずれ。

Discussion