Kubernetes 上の Spring Boot を Prometheus + Grafana でモニタリングする
はじめに
この記事には、Prometheus と Grafana を活用して Kubernetes 上で動く Spring Boot アプリケーションのメトリクスの分析ができる環境を構築するために必要なことを整理しています。
ざっくり書くと以下のようなことをやっています。
- Spring Boot Actuator + Micrometer で Prometheus に Metrics を連携できるようにする
- Spring Boot アプリケーションの jar が動く Docker イメージの作成
- Kubernetes に Spring Boot アプリケーション, Prometheus, Grafana のデプロイと設定
普段は、フルマネージドな Kubenetes クラスタが提供される環境での開発に取り組んでいます。
日々業務で触れる環境により良い前向きな変化を加えるためには、自分で手を動かして理解を深めるのは最初の一歩として必要かなと思うことがあり、手元のマシンでも色々試せる環境が欲しくなったので、必要なことを整理しながら実際に手を動かした記録がここに書いてあります。
環境
- minikube: v1.32.0
- chart: kube-prometheus-stack-58.1.1
デモ用のアプリケーションの作成
デモ用に簡単な Spring Boot アプリケーションを用意します。
Spring Boot Actuator で metrics を取得できるようにする
Spring Boot Actuator から metrics を取得できるようにします。
まず、以下の dependencies を build.gradle に追加します。
implementation 'org.springframework.boot:spring-boot-starter-actuator'
application.yml にも明示的な指定を加えます。
management:
  endpoints:
    web:
      exposure:
        include: health, metrics
これで actuator を介して取得することができる metrics のリストが確認できるようになりました。
curl -s http://localhost:8080/actuator/metrics
output
$ curl -s http://localhost:8080/actuator/metrics | jq
{
  "names": [
    "application.ready.time",
    "application.started.time",
    "disk.free",
    "disk.total",
    "executor.active",
    "executor.completed",
    "executor.pool.core",
    "executor.pool.max",
    "executor.pool.size",
    "executor.queue.remaining",
    "executor.queued",
    "http.server.requests",
    "http.server.requests.active",
    "jvm.buffer.count",
    "jvm.buffer.memory.used",
    "jvm.buffer.total.capacity",
    "jvm.classes.loaded",
    "jvm.classes.unloaded",
    "jvm.compilation.time",
    "jvm.gc.live.data.size",
    "jvm.gc.max.data.size",
    "jvm.gc.memory.allocated",
    "jvm.gc.memory.promoted",
    "jvm.gc.overhead",
    "jvm.gc.pause",
    "jvm.info",
    "jvm.memory.committed",
    "jvm.memory.max",
    "jvm.memory.usage.after.gc",
    "jvm.memory.used",
    "jvm.threads.daemon",
    "jvm.threads.live",
    "jvm.threads.peak",
    "jvm.threads.started",
    "jvm.threads.states",
    "logback.events",
    "process.cpu.usage",
    "process.files.max",
    "process.files.open",
    "process.start.time",
    "process.uptime",
    "system.cpu.count",
    "system.cpu.usage",
    "system.load.average.1m",
    "tomcat.sessions.active.current",
    "tomcat.sessions.active.max",
    "tomcat.sessions.alive.max",
    "tomcat.sessions.created",
    "tomcat.sessions.expired",
    "tomcat.sessions.rejected"
  ]
}
以下のように URL に値を追加することで、メトリクスを個別に取得できます。
curl -s http://localhost:8080/actuator/metrics/jvm.buffer.memory.used
output
$ curl -s http://localhost:8080/actuator/metrics/jvm.buffer.memory.used | jq
{
  "name": "jvm.buffer.memory.used",
  "description": "An estimate of the memory that the Java virtual machine is using for this buffer pool",
  "baseUnit": "bytes",
  "measurements": [
    {
      "statistic": "VALUE",
      "value": 57344
    }
  ],
  "availableTags": [
    {
      "tag": "application",
      "values": [
        "demo-spring-boot-k8s"
      ]
    },
    {
      "tag": "id",
      "values": [
        "mapped",
        "mapped - 'non-volatile memory'",
        "direct"
      ]
    }
  ]
}
Spring Boot Actuator Metrics を Prometheus に渡せるようにする
Spring Boot Actuator で取得した metrics を Prometheus に連携できるようにします。
以下の dependencies を build.gradle に追加します。
implementation 'io.micrometer:micrometer-registry-prometheus'
application.yml にも明示的な指定を加えます。
spring:
  application:
    name: demo-spring-boot-k8s
management:
  endpoints:
    web:
      exposure:
        include: health, metrics, prometheus
  metrics:
    tags:
      application: ${spring.application.name}
これで Spring Boot Actuator のエンドポイントから Prometheus に渡す値を確認できるようになります。
curl http://localhost:8080/actuator/prometheus
console
$ curl http://localhost:8080/actuator/prometheus
# HELP system_cpu_usage The "recent cpu usage" of the system the application is running in
# TYPE system_cpu_usage gauge
system_cpu_usage{application="demo-spring-boot-k8s",} 0.23583208217698462
# HELP executor_active_threads The approximate number of threads that are actively executing tasks
# TYPE executor_active_threads gauge
executor_active_threads{application="demo-spring-boot-k8s",name="applicationTaskExecutor",} 0.0
# HELP jvm_gc_overhead_percent An approximation of the percent of CPU time used by GC activities over the last lookback period or since monitoring began, whichever is shorter, in the range [0..1]
# TYPE jvm_gc_overhead_percent gauge
jvm_gc_overhead_percent{application="demo-spring-boot-k8s",} 0.0
# HELP jvm_memory_usage_after_gc_percent The percentage of long-lived heap pool used after the last GC event, in the range [0..1]
# TYPE jvm_memory_usage_after_gc_percent gauge
jvm_memory_usage_after_gc_percent{application="demo-spring-boot-k8s",area="heap",pool="long-lived",} 0.0022848844528198242
# HELP tomcat_sessions_alive_max_seconds
# TYPE tomcat_sessions_alive_max_seconds gauge
tomcat_sessions_alive_max_seconds{application="demo-spring-boot-k8s",} 0.0
# HELP jvm_memory_used_bytes The amount of used memory
# TYPE jvm_memory_used_bytes gauge
jvm_memory_used_bytes{application="demo-spring-boot-k8s",area="heap",id="G1 Survivor Space",} 2827024.0
jvm_memory_used_bytes{application="demo-spring-boot-k8s",area="heap",id="G1 Old Gen",} 1.9627008E7
jvm_memory_used_bytes{application="demo-spring-boot-k8s",area="nonheap",id="Metaspace",} 3.6186808E7
jvm_memory_used_bytes{application="demo-spring-boot-k8s",area="nonheap",id="CodeCache",} 9017344.0
jvm_memory_used_bytes{application="demo-spring-boot-k8s",area="nonheap",id="Compressed Class Space",} 5115568.0
jvm_memory_used_bytes{application="demo-spring-boot-k8s",area="heap",id="G1 Eden Space",} 1.6777216E7
# HELP jvm_gc_max_data_size_bytes Max size of long-lived heap memory pool
# TYPE jvm_gc_max_data_size_bytes gauge
jvm_gc_max_data_size_bytes{application="demo-spring-boot-k8s",} 8.589934592E9
# HELP executor_queue_remaining_tasks The number of additional elements that this queue can ideally accept without blocking
# TYPE executor_queue_remaining_tasks gauge
executor_queue_remaining_tasks{application="demo-spring-boot-k8s",name="applicationTaskExecutor",} 2.147483647E9
# HELP jvm_gc_memory_allocated_bytes_total Incremented for an increase in the size of the (young) heap memory pool after one GC to before the next
# TYPE jvm_gc_memory_allocated_bytes_total counter
jvm_gc_memory_allocated_bytes_total{application="demo-spring-boot-k8s",} 4.194304E7
# HELP jvm_gc_memory_promoted_bytes_total Count of positive increases in the size of the old generation memory pool before GC to after GC
# TYPE jvm_gc_memory_promoted_bytes_total counter
jvm_gc_memory_promoted_bytes_total{application="demo-spring-boot-k8s",} 0.0
# HELP jvm_gc_live_data_size_bytes Size of long-lived heap memory pool after reclamation
# TYPE jvm_gc_live_data_size_bytes gauge
jvm_gc_live_data_size_bytes{application="demo-spring-boot-k8s",} 0.0
# HELP jvm_threads_states_threads The current number of threads
# TYPE jvm_threads_states_threads gauge
jvm_threads_states_threads{application="demo-spring-boot-k8s",state="new",} 0.0
jvm_threads_states_threads{application="demo-spring-boot-k8s",state="blocked",} 0.0
jvm_threads_states_threads{application="demo-spring-boot-k8s",state="waiting",} 12.0
jvm_threads_states_threads{application="demo-spring-boot-k8s",state="timed-waiting",} 3.0
jvm_threads_states_threads{application="demo-spring-boot-k8s",state="runnable",} 9.0
jvm_threads_states_threads{application="demo-spring-boot-k8s",state="terminated",} 0.0
# HELP jvm_gc_pause_seconds Time spent in GC pause
# TYPE jvm_gc_pause_seconds summary
jvm_gc_pause_seconds_count{action="end of minor GC",application="demo-spring-boot-k8s",cause="G1 Evacuation Pause",gc="G1 Young Generation",} 1.0
jvm_gc_pause_seconds_sum{action="end of minor GC",application="demo-spring-boot-k8s",cause="G1 Evacuation Pause",gc="G1 Young Generation",} 0.003
# HELP jvm_gc_pause_seconds_max Time spent in GC pause
# TYPE jvm_gc_pause_seconds_max gauge
jvm_gc_pause_seconds_max{action="end of minor GC",application="demo-spring-boot-k8s",cause="G1 Evacuation Pause",gc="G1 Young Generation",} 0.0
# HELP http_server_requests_seconds
# TYPE http_server_requests_seconds summary
http_server_requests_seconds_count{application="demo-spring-boot-k8s",error="none",exception="none",method="GET",outcome="SUCCESS",status="200",uri="/actuator/metrics",} 2.0
http_server_requests_seconds_sum{application="demo-spring-boot-k8s",error="none",exception="none",method="GET",outcome="SUCCESS",status="200",uri="/actuator/metrics",} 0.021006291
http_server_requests_seconds_count{application="demo-spring-boot-k8s",error="none",exception="none",method="GET",outcome="SUCCESS",status="200",uri="/actuator/metrics/{requiredMetricName}",} 1.0
http_server_requests_seconds_sum{application="demo-spring-boot-k8s",error="none",exception="none",method="GET",outcome="SUCCESS",status="200",uri="/actuator/metrics/{requiredMetricName}",} 0.032347084
http_server_requests_seconds_count{application="demo-spring-boot-k8s",error="none",exception="none",method="GET",outcome="SUCCESS",status="200",uri="/actuator/prometheus",} 1.0
http_server_requests_seconds_sum{application="demo-spring-boot-k8s",error="none",exception="none",method="GET",outcome="SUCCESS",status="200",uri="/actuator/prometheus",} 0.034888709
# HELP http_server_requests_seconds_max
# TYPE http_server_requests_seconds_max gauge
http_server_requests_seconds_max{application="demo-spring-boot-k8s",error="none",exception="none",method="GET",outcome="SUCCESS",status="200",uri="/actuator/metrics",} 0.0
http_server_requests_seconds_max{application="demo-spring-boot-k8s",error="none",exception="none",method="GET",outcome="SUCCESS",status="200",uri="/actuator/metrics/{requiredMetricName}",} 0.0
http_server_requests_seconds_max{application="demo-spring-boot-k8s",error="none",exception="none",method="GET",outcome="SUCCESS",status="200",uri="/actuator/prometheus",} 0.0
# HELP tomcat_sessions_created_sessions_total
# TYPE tomcat_sessions_created_sessions_total counter
tomcat_sessions_created_sessions_total{application="demo-spring-boot-k8s",} 0.0
# HELP jvm_classes_unloaded_classes_total The total number of classes unloaded since the Java virtual machine has started execution
# TYPE jvm_classes_unloaded_classes_total counter
jvm_classes_unloaded_classes_total{application="demo-spring-boot-k8s",} 0.0
# HELP disk_free_bytes Usable space for path
# TYPE disk_free_bytes gauge
disk_free_bytes{application="demo-spring-boot-k8s",path="/Users/jp23557/dev_private/demo-spring-boot-k8s/.",} 3.33317595136E11
# HELP disk_total_bytes Total space for path
# TYPE disk_total_bytes gauge
disk_total_bytes{application="demo-spring-boot-k8s",path="/Users/jp23557/dev_private/demo-spring-boot-k8s/.",} 4.94384795648E11
# HELP jvm_info JVM version info
# TYPE jvm_info gauge
jvm_info{application="demo-spring-boot-k8s",runtime="OpenJDK Runtime Environment",vendor="Amazon.com Inc.",version="17.0.9+8-LTS",} 1.0
# HELP process_uptime_seconds The uptime of the Java virtual machine
# TYPE process_uptime_seconds gauge
process_uptime_seconds{application="demo-spring-boot-k8s",} 1117.608
# HELP jvm_buffer_memory_used_bytes An estimate of the memory that the Java virtual machine is using for this buffer pool
# TYPE jvm_buffer_memory_used_bytes gauge
jvm_buffer_memory_used_bytes{application="demo-spring-boot-k8s",id="mapped - 'non-volatile memory'",} 0.0
jvm_buffer_memory_used_bytes{application="demo-spring-boot-k8s",id="direct",} 73728.0
jvm_buffer_memory_used_bytes{application="demo-spring-boot-k8s",id="mapped",} 0.0
# HELP executor_queued_tasks The approximate number of tasks that are queued for execution
# TYPE executor_queued_tasks gauge
executor_queued_tasks{application="demo-spring-boot-k8s",name="applicationTaskExecutor",} 0.0
# HELP executor_pool_size_threads The current number of threads in the pool
# TYPE executor_pool_size_threads gauge
executor_pool_size_threads{application="demo-spring-boot-k8s",name="applicationTaskExecutor",} 0.0
# HELP jvm_compilation_time_ms_total The approximate accumulated elapsed time spent in compilation
# TYPE jvm_compilation_time_ms_total counter
jvm_compilation_time_ms_total{application="demo-spring-boot-k8s",compiler="HotSpot 64-Bit Tiered Compilers",} 601.0
# HELP tomcat_sessions_active_current_sessions
# TYPE tomcat_sessions_active_current_sessions gauge
tomcat_sessions_active_current_sessions{application="demo-spring-boot-k8s",} 0.0
# HELP system_cpu_count The number of processors available to the Java virtual machine
# TYPE system_cpu_count gauge
system_cpu_count{application="demo-spring-boot-k8s",} 10.0
# HELP executor_completed_tasks_total The approximate total number of tasks that have completed execution
# TYPE executor_completed_tasks_total counter
executor_completed_tasks_total{application="demo-spring-boot-k8s",name="applicationTaskExecutor",} 0.0
# HELP jvm_threads_started_threads_total The total number of application threads started in the JVM
# TYPE jvm_threads_started_threads_total counter
jvm_threads_started_threads_total{application="demo-spring-boot-k8s",} 39.0
# HELP jvm_threads_live_threads The current number of live threads including both daemon and non-daemon threads
# TYPE jvm_threads_live_threads gauge
jvm_threads_live_threads{application="demo-spring-boot-k8s",} 24.0
# HELP jvm_buffer_count_buffers An estimate of the number of buffers in the pool
# TYPE jvm_buffer_count_buffers gauge
jvm_buffer_count_buffers{application="demo-spring-boot-k8s",id="mapped - 'non-volatile memory'",} 0.0
jvm_buffer_count_buffers{application="demo-spring-boot-k8s",id="direct",} 9.0
jvm_buffer_count_buffers{application="demo-spring-boot-k8s",id="mapped",} 0.0
# HELP jvm_threads_daemon_threads The current number of live daemon threads
# TYPE jvm_threads_daemon_threads gauge
jvm_threads_daemon_threads{application="demo-spring-boot-k8s",} 20.0
# HELP jvm_classes_loaded_classes The number of classes that are currently loaded in the Java virtual machine
# TYPE jvm_classes_loaded_classes gauge
jvm_classes_loaded_classes{application="demo-spring-boot-k8s",} 8732.0
# HELP executor_pool_max_threads The maximum allowed number of threads in the pool
# TYPE executor_pool_max_threads gauge
executor_pool_max_threads{application="demo-spring-boot-k8s",name="applicationTaskExecutor",} 2.147483647E9
# HELP tomcat_sessions_active_max_sessions
# TYPE tomcat_sessions_active_max_sessions gauge
tomcat_sessions_active_max_sessions{application="demo-spring-boot-k8s",} 0.0
# HELP tomcat_sessions_expired_sessions_total
# TYPE tomcat_sessions_expired_sessions_total counter
tomcat_sessions_expired_sessions_total{application="demo-spring-boot-k8s",} 0.0
# HELP jvm_buffer_total_capacity_bytes An estimate of the total capacity of the buffers in this pool
# TYPE jvm_buffer_total_capacity_bytes gauge
jvm_buffer_total_capacity_bytes{application="demo-spring-boot-k8s",id="mapped - 'non-volatile memory'",} 0.0
jvm_buffer_total_capacity_bytes{application="demo-spring-boot-k8s",id="direct",} 73728.0
jvm_buffer_total_capacity_bytes{application="demo-spring-boot-k8s",id="mapped",} 0.0
# HELP system_load_average_1m The sum of the number of runnable entities queued to available processors and the number of runnable entities running on the available processors averaged over a period of time
# TYPE system_load_average_1m gauge
system_load_average_1m{application="demo-spring-boot-k8s",} 6.1943359375
# HELP process_files_max_files The maximum file descriptor count
# TYPE process_files_max_files gauge
process_files_max_files{application="demo-spring-boot-k8s",} 10240.0
# HELP process_start_time_seconds Start time of the process since unix epoch.
# TYPE process_start_time_seconds gauge
process_start_time_seconds{application="demo-spring-boot-k8s",} 1.713199482383E9
# HELP process_files_open_files The open file descriptor count
# TYPE process_files_open_files gauge
process_files_open_files{application="demo-spring-boot-k8s",} 68.0
# HELP jvm_threads_peak_threads The peak live thread count since the Java virtual machine started or peak was reset
# TYPE jvm_threads_peak_threads gauge
jvm_threads_peak_threads{application="demo-spring-boot-k8s",} 29.0
# HELP logback_events_total Number of log events that were enabled by the effective log level
# TYPE logback_events_total counter
logback_events_total{application="demo-spring-boot-k8s",level="debug",} 0.0
logback_events_total{application="demo-spring-boot-k8s",level="info",} 5.0
logback_events_total{application="demo-spring-boot-k8s",level="trace",} 0.0
logback_events_total{application="demo-spring-boot-k8s",level="error",} 0.0
logback_events_total{application="demo-spring-boot-k8s",level="warn",} 0.0
# HELP tomcat_sessions_rejected_sessions_total
# TYPE tomcat_sessions_rejected_sessions_total counter
tomcat_sessions_rejected_sessions_total{application="demo-spring-boot-k8s",} 0.0
# HELP executor_pool_core_threads The core number of threads for the pool
# TYPE executor_pool_core_threads gauge
executor_pool_core_threads{application="demo-spring-boot-k8s",name="applicationTaskExecutor",} 8.0
# HELP application_ready_time_seconds Time taken for the application to be ready to service requests
# TYPE application_ready_time_seconds gauge
application_ready_time_seconds{application="demo-spring-boot-k8s",main_application_class="org.example.demospringbootk8s.DemoSpringBootK8sApplication",} 1.011
# HELP jvm_memory_committed_bytes The amount of memory in bytes that is committed for the Java virtual machine to use
# TYPE jvm_memory_committed_bytes gauge
jvm_memory_committed_bytes{application="demo-spring-boot-k8s",area="heap",id="G1 Survivor Space",} 4194304.0
jvm_memory_committed_bytes{application="demo-spring-boot-k8s",area="heap",id="G1 Old Gen",} 1.17440512E8
jvm_memory_committed_bytes{application="demo-spring-boot-k8s",area="nonheap",id="Metaspace",} 3.6765696E7
jvm_memory_committed_bytes{application="demo-spring-boot-k8s",area="nonheap",id="CodeCache",} 9043968.0
jvm_memory_committed_bytes{application="demo-spring-boot-k8s",area="nonheap",id="Compressed Class Space",} 5373952.0
jvm_memory_committed_bytes{application="demo-spring-boot-k8s",area="heap",id="G1 Eden Space",} 1.97132288E8
# HELP jvm_memory_max_bytes The maximum amount of memory in bytes that can be used for memory management
# TYPE jvm_memory_max_bytes gauge
jvm_memory_max_bytes{application="demo-spring-boot-k8s",area="heap",id="G1 Survivor Space",} -1.0
jvm_memory_max_bytes{application="demo-spring-boot-k8s",area="heap",id="G1 Old Gen",} 8.589934592E9
jvm_memory_max_bytes{application="demo-spring-boot-k8s",area="nonheap",id="Metaspace",} -1.0
jvm_memory_max_bytes{application="demo-spring-boot-k8s",area="nonheap",id="CodeCache",} 5.0331648E7
jvm_memory_max_bytes{application="demo-spring-boot-k8s",area="nonheap",id="Compressed Class Space",} 1.073741824E9
jvm_memory_max_bytes{application="demo-spring-boot-k8s",area="heap",id="G1 Eden Space",} -1.0
# HELP process_cpu_usage The "recent cpu usage" for the Java Virtual Machine process
# TYPE process_cpu_usage gauge
process_cpu_usage{application="demo-spring-boot-k8s",} 1.316351043391939E-4
# HELP http_server_requests_active_seconds_max
# TYPE http_server_requests_active_seconds_max gauge
http_server_requests_active_seconds_max{application="demo-spring-boot-k8s",exception="none",method="GET",outcome="SUCCESS",status="200",uri="UNKNOWN",} 0.012881458
# HELP http_server_requests_active_seconds
# TYPE http_server_requests_active_seconds summary
http_server_requests_active_seconds_active_count{application="demo-spring-boot-k8s",exception="none",method="GET",outcome="SUCCESS",status="200",uri="UNKNOWN",} 1.0
http_server_requests_active_seconds_duration_sum{application="demo-spring-boot-k8s",exception="none",method="GET",outcome="SUCCESS",status="200",uri="UNKNOWN",} 0.012856917
# HELP application_started_time_seconds Time taken to start the application
# TYPE application_started_time_seconds gauge
application_started_time_seconds{application="demo-spring-boot-k8s",main_application_class="org.example.demospringbootk8s.DemoSpringBootK8sApplication",} 1.006
実行可能な jar をビルドして動作確認
アプリケーションをビルドします。
./gradlew build
ビルドが成功すると、以下のような jar ファイルが作成されます。
$ ls -lh build/libs
total 43520
-rw-r--r--@ 1 user  staff   1.4K  4 14 16:35 demo-spring-boot-k8s-0.0.1-SNAPSHOT-plain.jar
-rw-r--r--@ 1 user  staff    21M  4 14 16:35 demo-spring-boot-k8s-0.0.1-SNAPSHOT.jar
jar が実行可能であることを確認しておきます。
java -jar build/libs/demo-spring-boot-k8s-0.0.1-SNAPSHOT.jar
デモ用のアプリケーションの Docker コンテナイメージを作成する
デモ用のアプリケーションを Kubernetes 上で動かすために、 Docker コンテナイメージを作っておきます。
Dockerfile を書く
docker image をビルド
docker build . -t demo-spring-boot-k8s:0.0.1-SNAPSHOT
docker image からコンテナを作成して実行する
docker run -p 8080:8080 demo-spring-boot-k8s:0.0.1-SNAPSHOT
Spring Boot アプリケーションが動いていることを確認する
$ curl localhost:8080/actuator/health
{"status":"UP"}
docker image を Dockerhub に push
docker tag demo-spring-boot-k8s:0.0.1-SNAPSHOT rea9r/demo-spring-boot-k8s
docker push rea9r/demo-spring-boot-k8s
Kubernetes に環境構築
Minikube を使用してローカルマシンで Kubernetes を動かす
Minikube のインストール
minikube の公式ドキュメント を参考にインストールします。
Minikube を起動してクラスターを作成する
minikube start -p minikube-dev1
output
$ minikube start -p minikube-dev1
😄  Darwin 14.3 (arm64) 上の [minikube-dev1] minikube v1.32.0
✨  docker ドライバーが自動的に選択されました
📌  root 権限を持つ Docker Desktop ドライバーを使用
👍  minikube-dev1 クラスター中のコントロールプレーンの minikube-dev1 ノードを起動しています
🚜  ベースイメージを取得しています...
🔥  Creating docker container (CPUs=2, Memory=7798MB) ...
❗  「docker ps -a --format {{.Names}}」の実行が異常に長い時間かかりました: 3.118041666s
💡  docker サービス再起動で性能が改善するかもしれません。
🐳  Docker 24.0.7 で Kubernetes v1.28.3 を準備しています...
    ▪ 証明書と鍵を作成しています...
    ▪ コントロールプレーンを起動しています...
    ▪ RBAC のルールを設定中です...
🔗  bridge CNI (コンテナーネットワークインターフェース) を設定中です...
🔎  Kubernetes コンポーネントを検証しています...
    ▪ gcr.io/k8s-minikube/storage-provisioner:v5 イメージを使用しています
🌟  有効なアドオン: storage-provisioner, default-storageclass
🏄  終了しました!kubectl がデフォルトで「minikube-dev1」クラスターと「default」ネームスペースを使用するよう設定されました
kubectl のインストール
kubectl も使えるようにしておきます。
# Print the address of the control plane and cluster services
kubectl cluster-info

# List all service
kubectl get service
output
# Print the address of the control plane and cluster services
$ kubectl cluster-info
Kubernetes control plane is running at https://127.0.0.1:53578
CoreDNS is running at https://127.0.0.1:53578/api/v1/namespaces/kube-system/services/kube-dns:dns/proxy

To further debug and diagnose cluster problems, use 'kubectl cluster-info dump'.

# List all service
$ kubectl get service
NAME         TYPE        CLUSTER-IP   EXTERNAL-IP   PORT(S)   AGE
kubernetes   ClusterIP   10.96.0.1    <none>        443/TCP   19m
Kubernetes にアプリケーションをデプロイする
デモアプリケーション用の helm を作成
Kubernetes にアプリケーションをデプロイする
kubectl create namespace demo
output
$ kubectl create namespace demo
namespace/demo created
kubectl apply -f k8s/demo-spring-boot-k8s.yaml -n demo
output
$ kubectl apply -f k8s/demo-spring-boot-k8s.yaml -n demo
deployment.apps/demo-spring-boot-k8s-deployment created
service/demo-spring-boot-k8s-service created
Kubernetes クラスターに作成されたリソースの確認
$ kubectl get all -n demo
NAME                                                   READY   STATUS    RESTARTS   AGE
pod/demo-spring-boot-k8s-deployment-7dd4db6b59-rz5fr   1/1     Running   0          53s
pod/demo-spring-boot-k8s-deployment-7dd4db6b59-v45pg   1/1     Running   0          53s

NAME                                   TYPE       CLUSTER-IP       EXTERNAL-IP   PORT(S)          AGE
service/demo-spring-boot-k8s-service   NodePort   10.102.145.181   <none>        8080:32665/TCP   53s

NAME                                              READY   UP-TO-DATE   AVAILABLE   AGE
deployment.apps/demo-spring-boot-k8s-deployment   2/2     2            2           53s

NAME                                                         DESIRED   CURRENT   READY   AGE
replicaset.apps/demo-spring-boot-k8s-deployment-7dd4db6b59   2         2         2       53s
Kubernetes クラスタの外からアプリケーションの動作確認
NodePort 経由で Service にアクセスできるようにする。
minikube service demo-spring-boot-k8s-service --url \
  -n demo \
  -p minikube-dev1
output
$ minikube service demo-spring-boot-k8s-service --url \
  -n demo \
  -p minikube-dev1
http://127.0.0.1:51685
❗  Docker ドライバーを darwin 上で使用しているため、実行するにはターミナルを開く必要があります。
別のターミナルを起動して、アプリケーションが期待する結果を返すことを確認します。
$ curl http://127.0.0.1:51685/actuator/health
{"status":"UP","groups":["liveness","readiness"]}
Kubernetes へ Prometheus と Grafana のデプロイと設定
Kubernetes に Prometheus と Grafana をデプロイ
新しい Helm チャートリポジトリを追加します
helm repo add prometheus-community https://prometheus-community.github.io/helm-charts
helm repo update
output
$ helm repo add prometheus-community https://prometheus-community.github.io/helm-charts
"prometheus-community" has been added to your repositories

$ helm repo update
Hang tight while we grab the latest from your chart repositories...
...Successfully got an update from the "prometheus-community" chart repository
Update Complete. ⎈Happy Helming!⎈
Note: chart から編集可能な parameter を取得したい場合
以下コマンドで取得できます。
$ helm inspect values prometheus-community/kube-prometheus-stack > k8s/kube-prometheus-stack-values.yaml
Prometheus を立ち上げます。
helm install --create-namespace --namespace monitoring \
  prometheus prometheus-community/kube-prometheus-stack
output
$ helm install --create-namespace --namespace monitoring \
  prometheus prometheus-community/kube-prometheus-stack
NAME: prometheus
LAST DEPLOYED: Tue Apr 16 17:57:31 2024
NAMESPACE: monitoring
STATUS: deployed
REVISION: 1
NOTES:
kube-prometheus-stack has been installed. Check its status by running:
  kubectl --namespace monitoring get pods -l "release=prometheus"

Visit https://github.com/prometheus-operator/kube-prometheus for instructions on how to create & configure Alertmanager and Prometheus instances using the Operator.
kube-prometheus-stack のリソースが作成されたことを確認。
$ kubectl get all --namespace monitoring
NAME                                                         READY   STATUS    RESTARTS   AGE
pod/alertmanager-prometheus-kube-prometheus-alertmanager-0   2/2     Running   0          46s
pod/prometheus-grafana-d5679d5d7-8w5l5                       3/3     Running   0          75s
pod/prometheus-kube-prometheus-operator-7757f9b56b-2v6mw     1/1     Running   0          75s
pod/prometheus-kube-state-metrics-c8f945cbb-cw7l7            1/1     Running   0          75s
pod/prometheus-prometheus-kube-prometheus-prometheus-0       2/2     Running   0          46s
pod/prometheus-prometheus-node-exporter-dqz4v                1/1     Running   0          75s

NAME                                              TYPE        CLUSTER-IP       EXTERNAL-IP   PORT(S)                      AGE
service/alertmanager-operated                     ClusterIP   None             <none>        9093/TCP,9094/TCP,9094/UDP   46s
service/prometheus-grafana                        ClusterIP   10.97.148.171    <none>        80/TCP                       75s
service/prometheus-kube-prometheus-alertmanager   ClusterIP   10.102.49.133    <none>        9093/TCP,8080/TCP            75s
service/prometheus-kube-prometheus-operator       ClusterIP   10.105.140.37    <none>        443/TCP                      75s
service/prometheus-kube-prometheus-prometheus     ClusterIP   10.109.163.24    <none>        9090/TCP,8080/TCP            75s
service/prometheus-kube-state-metrics             ClusterIP   10.110.247.239   <none>        8080/TCP                     75s
service/prometheus-operated                       ClusterIP   None             <none>        9090/TCP                     46s
service/prometheus-prometheus-node-exporter       ClusterIP   10.110.156.211   <none>        9100/TCP                     75s

NAME                                                 DESIRED   CURRENT   READY   UP-TO-DATE   AVAILABLE   NODE SELECTOR            AGE
daemonset.apps/prometheus-prometheus-node-exporter   1         1         1       1            1           kubernetes.io/os=linux   75s

NAME                                                  READY   UP-TO-DATE   AVAILABLE   AGE
deployment.apps/prometheus-grafana                    1/1     1            1           75s
deployment.apps/prometheus-kube-prometheus-operator   1/1     1            1           75s
deployment.apps/prometheus-kube-state-metrics         1/1     1            1           75s

NAME                                                             DESIRED   CURRENT   READY   AGE
replicaset.apps/prometheus-grafana-d5679d5d7                     1         1         1       75s
replicaset.apps/prometheus-kube-prometheus-operator-7757f9b56b   1         1         1       75s
replicaset.apps/prometheus-kube-state-metrics-c8f945cbb          1         1         1       75s

NAME                                                                    READY   AGE
statefulset.apps/alertmanager-prometheus-kube-prometheus-alertmanager   1/1     46s
statefulset.apps/prometheus-prometheus-kube-prometheus-prometheus       1/1     46s
Prometheus の ui にアクセス
まず、prometheus-server service を公開します。
kubectl expose service prometheus-kube-prometheus-prometheus --type=NodePort --target-port=9090 --name=prometheus-server-ext -n monitoring
output
$ kubectl expose service prometheus-kube-prometheus-prometheus --type=NodePort --target-port=9090 --name=prometheus-server-ext -n monitoring
service/prometheus-server-ext exposed
次に prometheus-server-ext service にアクセスするための URL とポートを取得します。
minikube service prometheus-server-ext -p minikube-dev1 -n monitoring
output
$ minikube service prometheus-server-ext -p minikube-dev1 -n monitoring
|------------|-----------------------|-------------|---------------------------|
| NAMESPACE  |         NAME          | TARGET PORT |            URL            |
|------------|-----------------------|-------------|---------------------------|
| monitoring | prometheus-server-ext | port-1/9090 | http://192.168.49.2:30163 |
|            |                       | port-2/8080 | http://192.168.49.2:30836 |
|------------|-----------------------|-------------|---------------------------|
🏃  prometheus-server-ext サービス用のトンネルを起動しています。
|------------|-----------------------|-------------|------------------------|
| NAMESPACE  |         NAME          | TARGET PORT |          URL           |
|------------|-----------------------|-------------|------------------------|
| monitoring | prometheus-server-ext |             | http://127.0.0.1:65131 |
|            |                       |             | http://127.0.0.1:65132 |
|------------|-----------------------|-------------|------------------------|
[monitoring prometheus-server-ext  http://127.0.0.1:65131
http://127.0.0.1:65132]
❗  Docker ドライバーを darwin 上で使用しているため、実行するにはターミナルを開く必要があります。
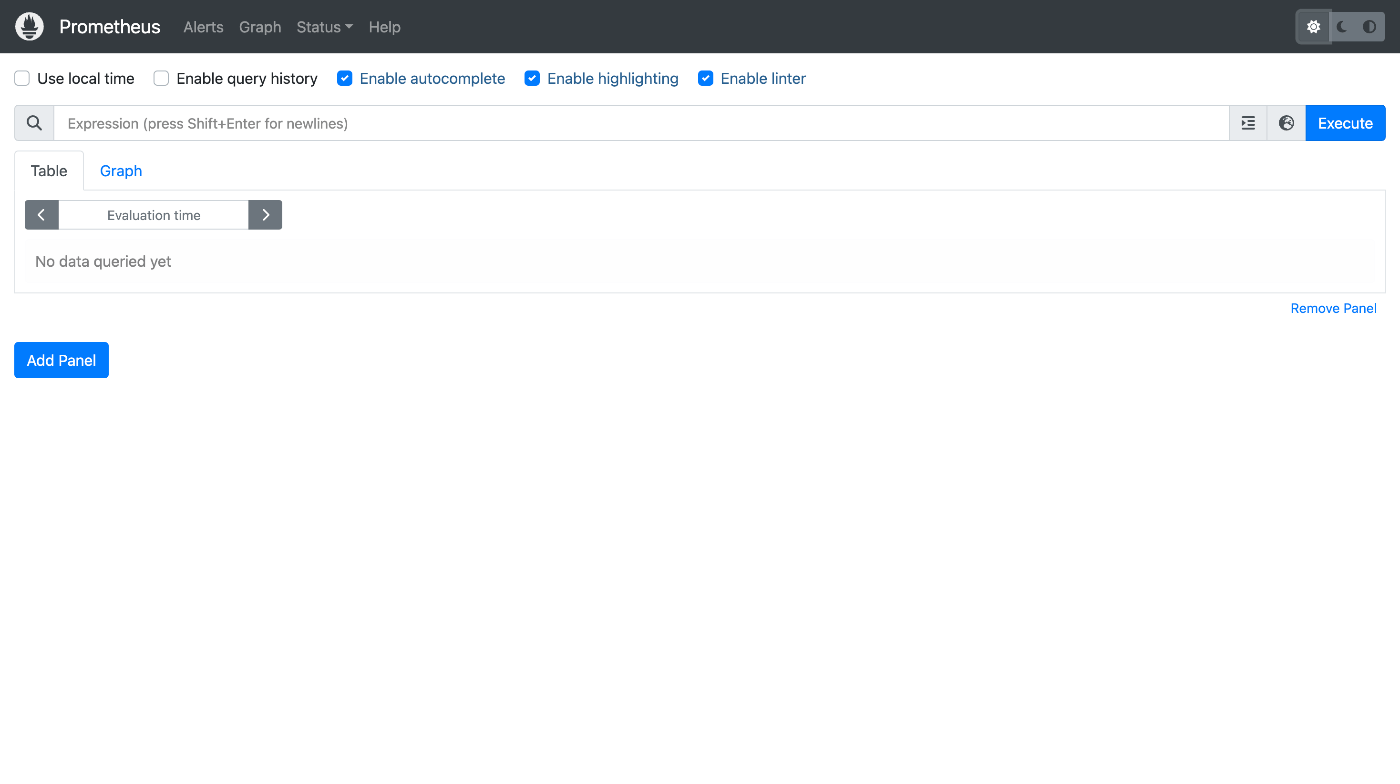
コマンドを実行すると、ブラウザで Prometheus の dashbord 画面を見れるようになります。
Grafana の ui にアクセス
まず、grafana service を公開します。
kubectl expose service prometheus-grafana --type=NodePort --target-port=3000 --name=grafana-ext -n monitoring
output
$ kubectl expose service prometheus-grafana --type=NodePort --target-port=3000 --name=grafana-ext -n monitoring service/grafana-ext exposed
次に grafana-ext service にアクセスするための URL とポートを取得します。
minikube service grafana-ext -p minikube-dev1 -n monitoring
output
$ minikube service grafana-ext -p minikube-dev1 -n monitoring
|------------|-------------|-------------|---------------------------|
| NAMESPACE  |    NAME     | TARGET PORT |            URL            |
|------------|-------------|-------------|---------------------------|
| monitoring | grafana-ext |          80 | http://192.168.49.2:31686 |
|------------|-------------|-------------|---------------------------|
🏃  grafana-ext サービス用のトンネルを起動しています。
|------------|-------------|-------------|------------------------|
| NAMESPACE  |    NAME     | TARGET PORT |          URL           |
|------------|-------------|-------------|------------------------|
| monitoring | grafana-ext |             | http://127.0.0.1:61952 |
|------------|-------------|-------------|------------------------|
🎉  デフォルトブラウザーで monitoring/grafana-ext サービスを開いています...
❗  Docker ドライバーを darwin 上で使用しているため、実行するにはターミナルを開く必要があります。
コマンドを実行すると、ブラウザで Grafana のログイン画面が開かれます。
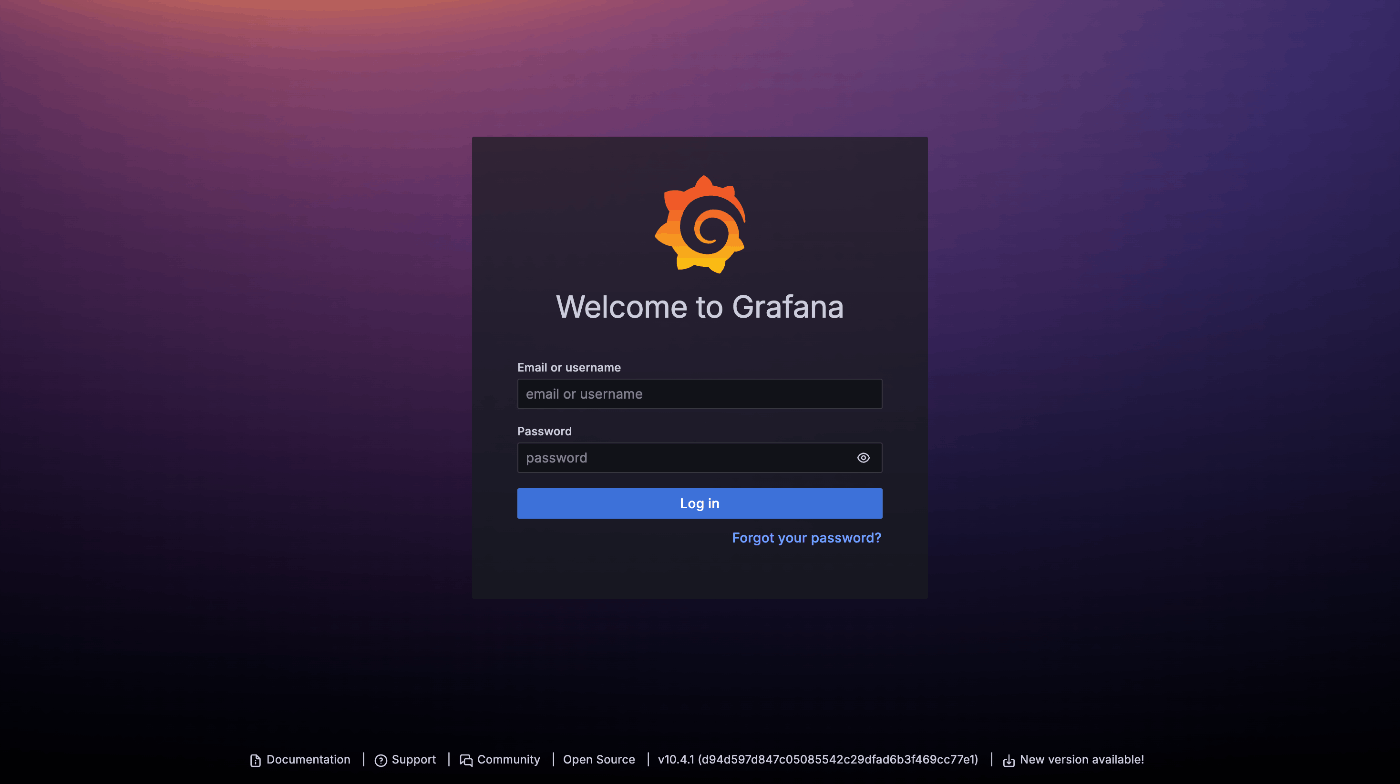
admin ユーザーのパスワードは以下で取得できます。
kubectl get secret --namespace monitor prometheus-grafana -o jsonpath="{.data.admin-password}" | base64 --decode; echo
output
$ kubectl get secret --namespace monitor prometheus-grafana -o jsonpath="{.data.admin-password}" | base64 --decode; echo
prom-operator
ServiceMonitor をデプロイする
Prometheus Operator の ServiceMonitor を使って、デモ用のアプリケーションを監視対象に指定し、監視対象からメトリクスを収集できるようにします。
kubectl apply -f k8s/demo-spring-boot-k8s-service-monitor.yaml -n monitoring
output
$ kubectl apply -f k8s/demo-spring-boot-k8s-service-monitor.yaml -n monitoring
servicemonitor.monitoring.coreos.com/demo-spring-boot-k8s-service-monitor created
Prometheus の ui を開いて、Status ドロップダウンメニューから Targets を選択すると、Prometheus が指定された endpoint に対してスクレイピングしていることを確認できます。

Grafana でメトリクスを可視化する
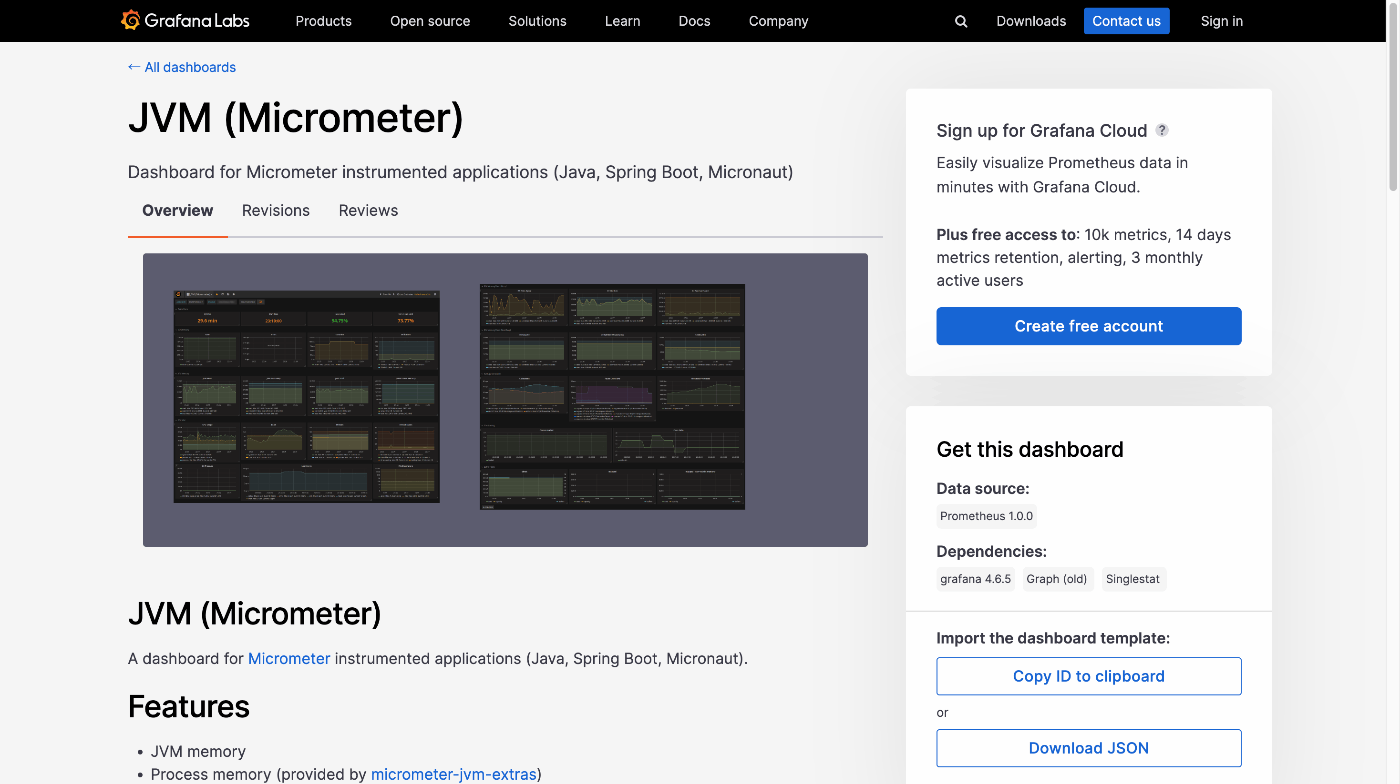
Grafana のコミュニティが用意してくれているダッシュボードは有用なものが多く、Grafana Labs にて自分のニーズに合うものを探すことができます。
今回は JVM (Micrometer) を使います。
JVM (Micrometer) のインポート
JVM (Micrometer) のページでダッシュボードの ID をコピーします。
Grafana のダッシュボードページからインポートします。
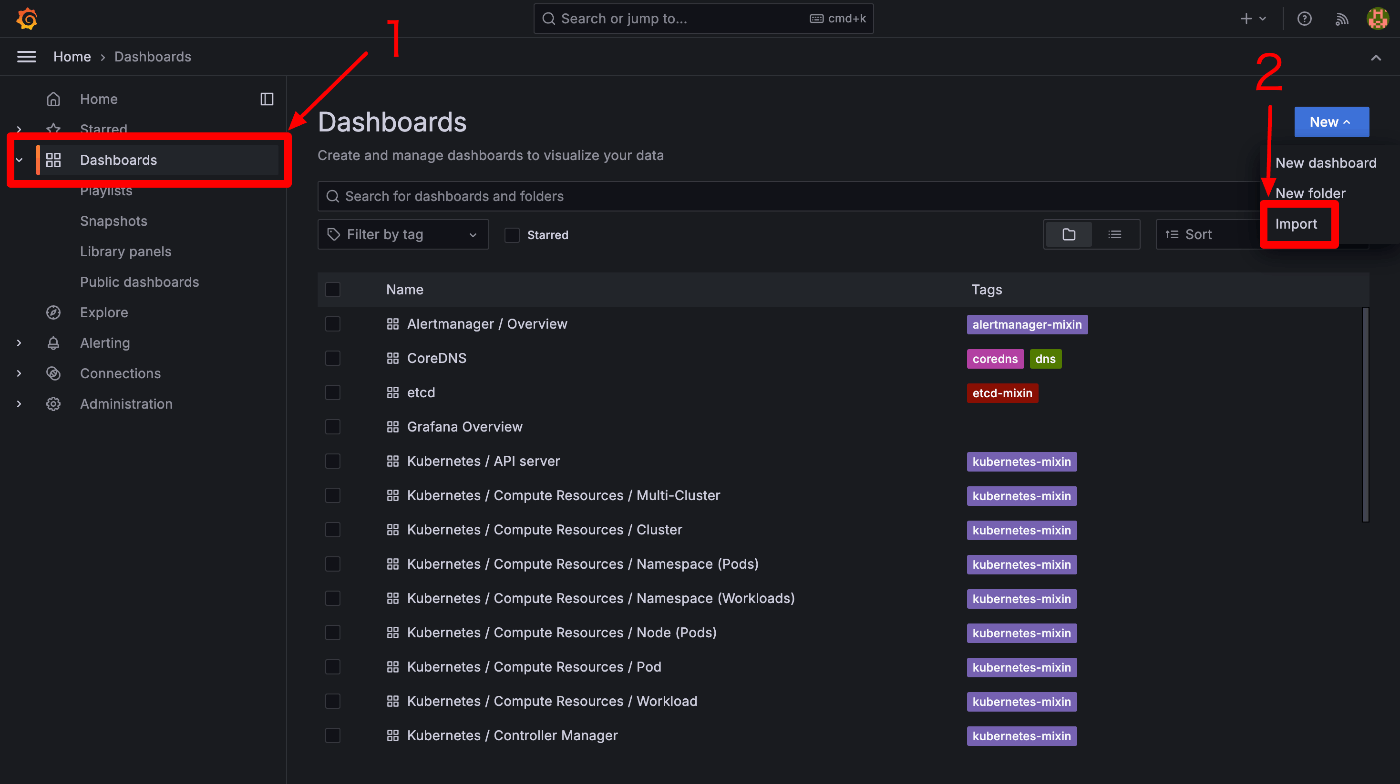
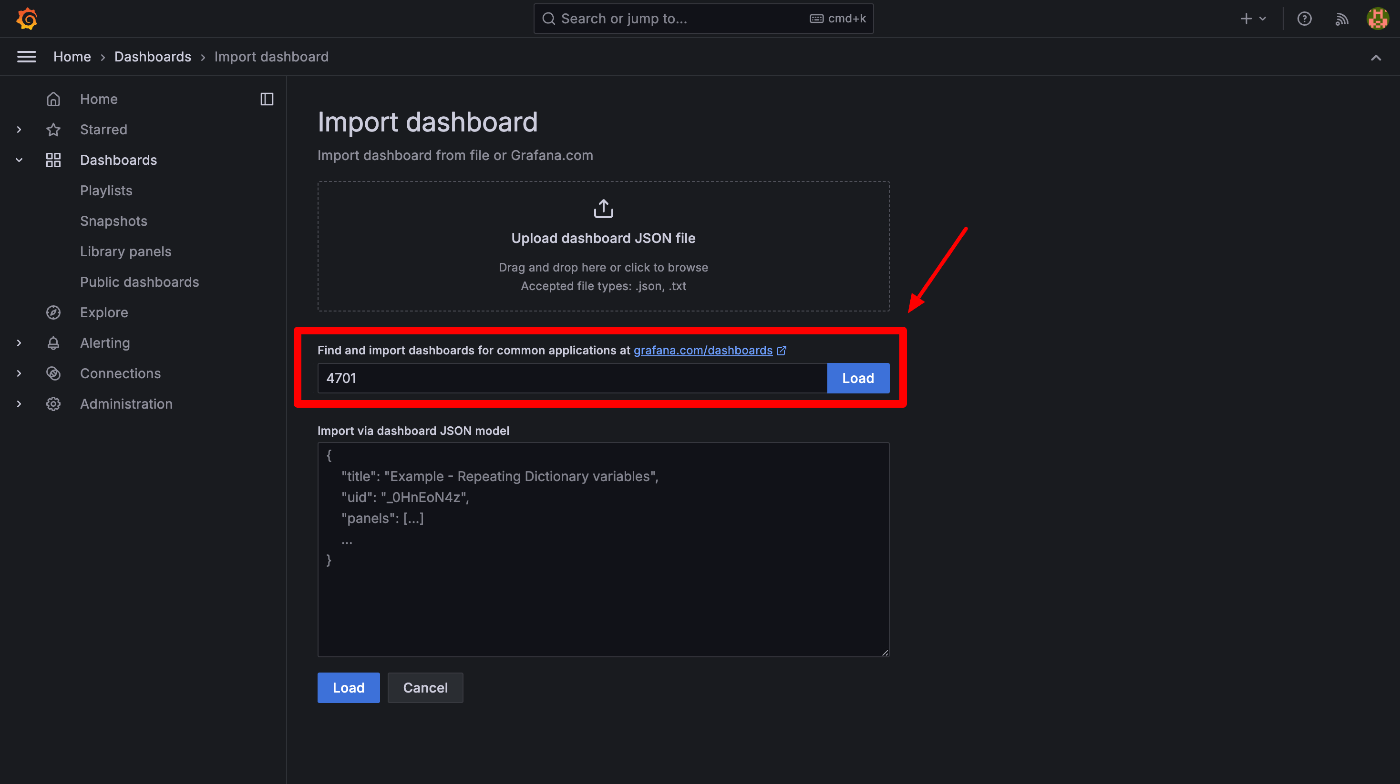
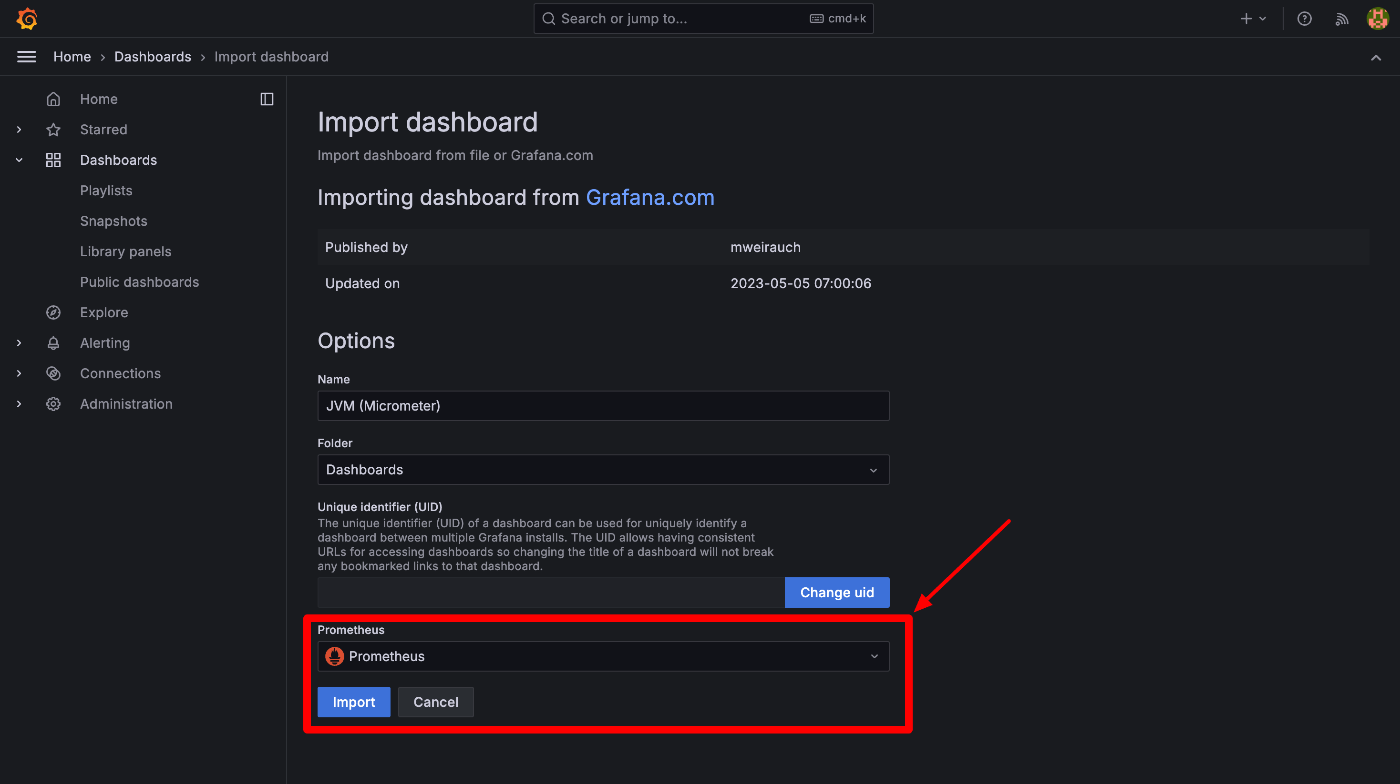
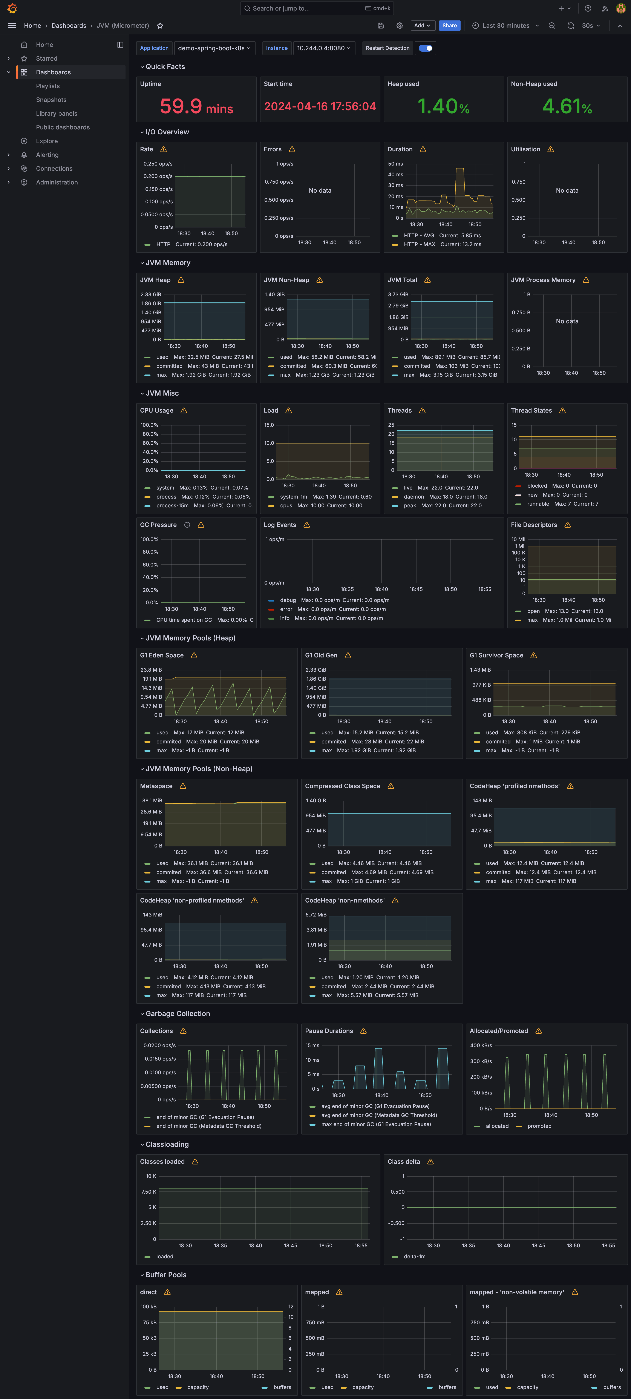
これで Grafana のダッシュボードから JVM のメトリクスを可視化することができました。
掃除
minikube クラスタの停止
minikube stop -p minikube-dev1
output
$ minikube stop -p minikube-dev1
✋  「minikube-dev1」ノードを停止しています...
🛑  SSH 経由で「minikube-dev1」の電源をオフにしています...
🛑  1 台のノードが停止しました。
minikube クラスタの削除
minikube delete -p minikube-dev1
output
$ minikube delete -p minikube-dev1
🔥  docker の「minikube-dev1」を削除しています...
🔥  コンテナー「minikube-dev1」を削除しています...
🔥  /Users/jp23557/.minikube/machines/minikube-dev1 を削除しています...
💀  クラスター「minikube-dev1」の全てのトレースを削除しました。
さいごに
今回は Prometheus + Grafana を試しました。
他のソリューションも使ってみたいので、近いうちにまた手を動かしたい(意気込み)。
Discussion