【R】ggplot2
ggplotでaes_string()が使えなくなる件
現状はwarningを出しながら使える状況。
ggplot(data = reshape2::melt(iris), mapping = aes_string(x = "Species", y = "value")) +
  geom_col(mapping = aes_string(fill = "Species"))
aes_string()was deprecated in ggplot2 3.0.0.
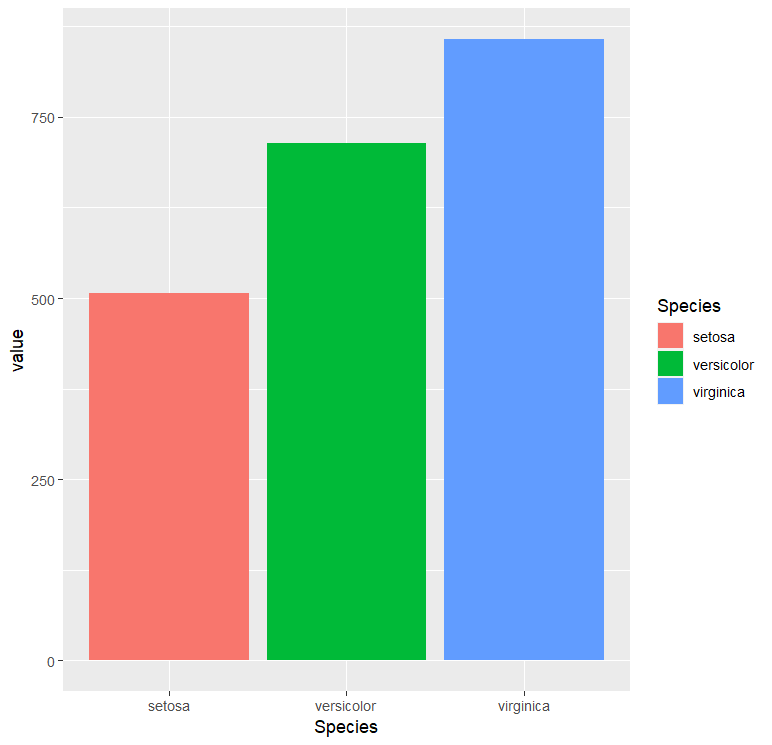
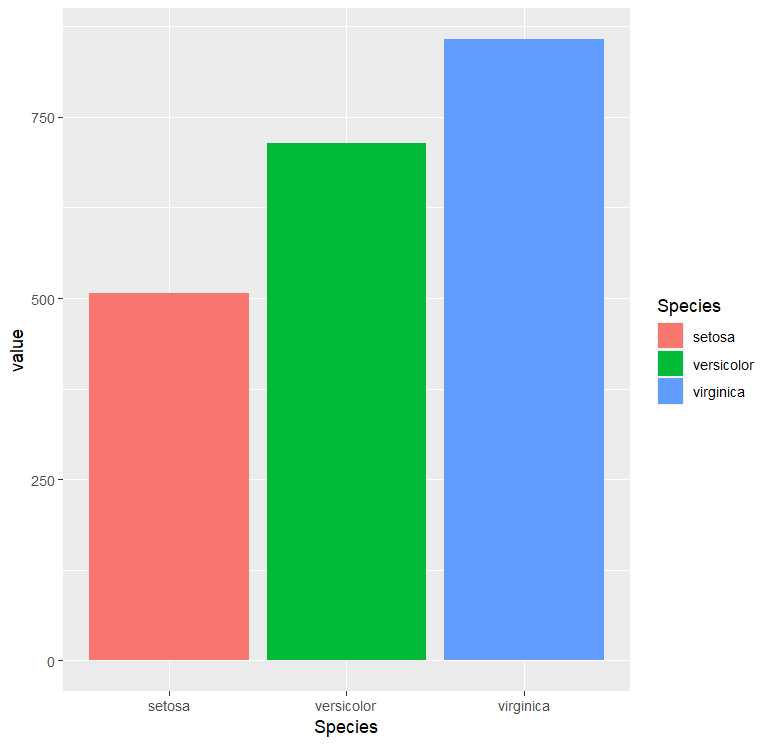
aes_string()は今後無くなるが、代替の関数が提供されるわけではない。代わりにaes()での指定時に.data[["列名"]]を使う。これなら列名指定と文字列指定がaes()内で併用できる。
ggplot(data = reshape2::melt(iris), mapping = aes(x = Species, y = .data[["value"]])) +
  geom_col(mapping = aes(fill = .data[["Species"]]))
ggnewscaleパッケージのnew_scale_fill()/new_scale_color()
同じgeom_〇〇を2回使う時に、間に入れるとlegendがわかれる。
デモデータ
library(ggplot2)
library(ggnewscale)

df <- data.frame(
  num_hit = c("1 Pos", "1 Pos", "1 Pos", "2 Pos",
               "2 Pos", "2 Pos", "3 Neg", "3 Pos"),
  antibodies = c("TIM3", "LAG3",
                "PD1", "PD1/TIM3", "PD1/LAG3", "TIM3/LAG3", "PD1-/LAG3-/TIM3-",
                "PD1/LAG3/TIM3"),
  percent = c(2, 2, 18, 8, 8, 10, 40, 12)
)
df$ymax <- cumsum(df$percent)
df$ymin <- df$ymax - df$percent
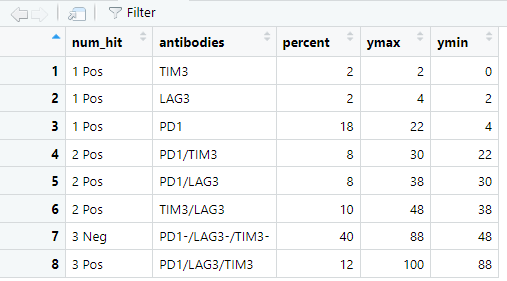
num_hit列、antibodies列の百分率をgeom_rect()を2回使って積み上げ棒グラフのようにplotする。
new_scale_fill()を使わない場合
ggplot(df, aes(ymin = ymin, ymax = ymax)) +
  geom_rect(
    aes(xmin = 0, xmax = 0.5, fill = num_hit),
  ) +
  geom_rect(
    aes(xmin = 0.6, xmax = 1.1, fill = antibodies),
  )

new_scale_fill()を使う場合
ggplot(df, aes(ymin = ymin, ymax = ymax)) +
  geom_rect(
    aes(xmin = 0, xmax = 0.5, fill = num_hit),
  ) +
  ggnewscale::new_scale_fill() +
  geom_rect(
    aes(xmin = 0.6, xmax = 1.1, fill = antibodies),
  )

凡例を無くすときは、legendをオフするコマンドをどこに入れるかも大事
ggplot(df, aes(ymin = ymin, ymax = ymax)) +
  geom_rect(
    aes(xmin = 0, xmax = 0.5, fill = num_hit),
  ) +
  ggnewscale::new_scale_fill() +
  geom_rect(
    aes(xmin = 0.6, xmax = 1.1, fill = antibodies),
  ) +
  guides( fill = "none")
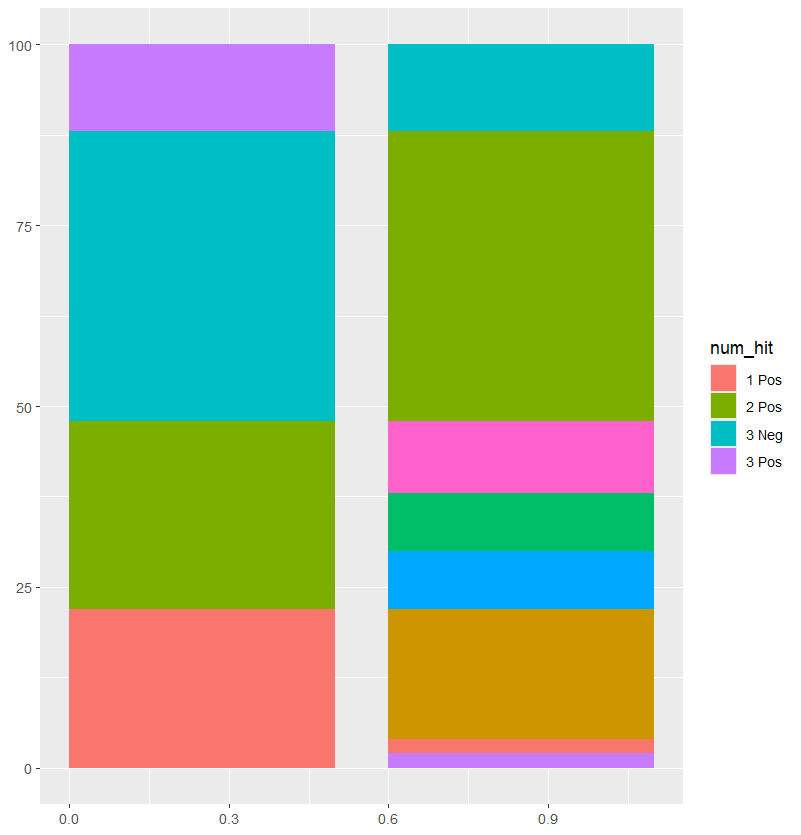
ggplot(df, aes(ymin = ymin, ymax = ymax)) +
  geom_rect(
    aes(xmin = 0, xmax = 0.5, fill = num_hit),
  ) +
  guides( fill = "none") +
  ggnewscale::new_scale_fill() +
  geom_rect(
    aes(xmin = 0.6, xmax = 1.1, fill = antibodies),
  )

ヒストグラムと密度曲線の高さを揃える
密度曲線の面積は1であり、度数のヒストグラムとはy軸のscaleが異なる。
ggplot(data = iris, aes(x = Sepal.Width)) +
  geom_histogram(col = "white") +
  geom_density(col="red")

ヒストグラムのy軸scaleを密度曲線の方に合わせるには
geom_histogram()軸を再設定するのだが、..density..かafter_stat(density)と書く。
ggplot(data = iris, aes(x = Sepal.Width)) +
  geom_histogram(aes(y =..density..), col = "white") +
  geom_density(col="red")

..density..は今後無くなるとのことなのでafter_stat(density)を今後使用するとよい。
ggplot(data = iris, aes(x = Sepal.Width)) +
  geom_histogram(aes(y =after_stat(density)), col = "white") +
  geom_density(col="red")

scale_fill_identity()
カラーコードのように色情報列をdata.frame内に用意していれば、そのカラーコードを採用させる。
plotのラスタライズ
ggrastrパッケージのgeom_〇〇シリーズが使える。
ggrastr::geom_point_rast()
scattermoreパッケージのgeom_scattermoreでもラスタライズしたdot plotが書ける。pixels =オプションでdotの解像度が変わる。デフォルトはc(512,512)
scattermore::geom_scattermore()
plot margin
上、右、下、左の順で余白を指定する。
ggplot(....) +
    geom_〇〇(....) +
    theme(plot.margin = unit(c(2,0,0,0),"cm"))
塗りつぶしにグラジエントやパターンを作る

library(ggplot2)
library(grid)

colours <- scales::viridis_pal()(10)

patterns <- list(
  linearGradient(colours, group = FALSE),
  "limegreen",
  radialGradient(colours, group = FALSE),
  pattern(
    rectGrob(x = c(0.25, 0.75), y = c(0.25, 0.75), width = 0.5, height = 0.5),
    width = unit(5, "mm"), height = unit(5, "mm"), extend = "repeat",
    gp = gpar(fill = "limegreen")
  )
)

ggplot(mpg, aes(factor(cyl), fill = factor(cyl))) +
  geom_bar() +
  scale_fill_manual(values = patterns)
やってみたけど次のエラー
fill_alpha(coords
alpha) で: fill, coords
Unable to check the capabilities of the png device.
coord_radial()
coord_polar()よりも指定できるオプションが多いみたい。
coord_polar()の例
ggplot(diamonds, aes(x = cut, fill = color)) +
  geom_bar() +
  coord_polar()

coord_radical()のdefault
ラベル位置や背景が変わる。
ggplot(diamonds, aes(x = cut, fill = color)) +
  geom_bar() +
  coord_radial()

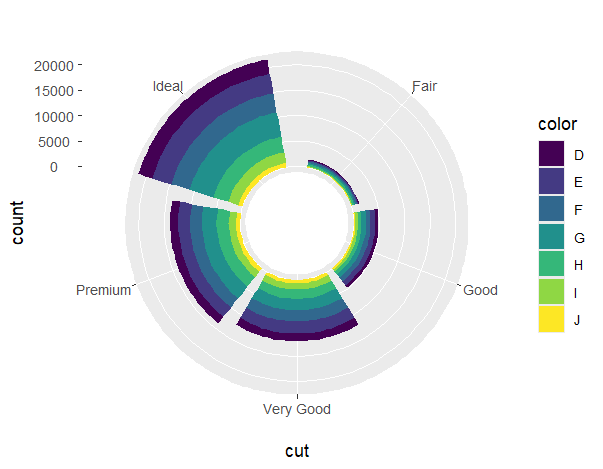
inner.radius=を使ってdonut plotに
ggplot(diamonds, aes(x = cut, fill = color)) +
  geom_bar() +
  coord_radial(inner.radius = 0.3)
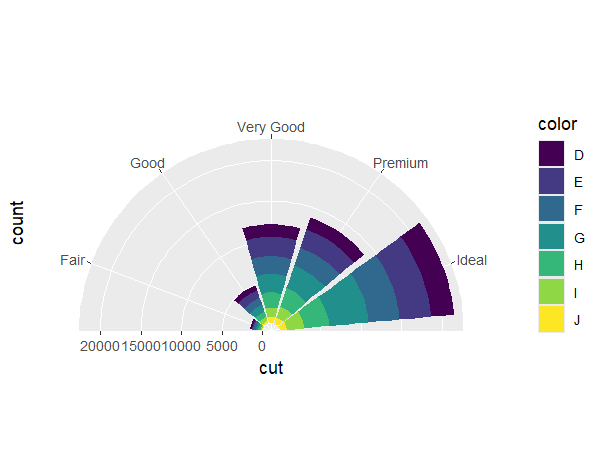
start=/end=を指定して半円に
ggplot(diamonds, aes(x = cut, fill = color)) +
  geom_bar() +
  coord_radial(start = -0.5 * pi, end = 0.5 * pi)
ggplotをPDF書き出しするときにギリシャ文字が変換できない場合
pdf()じゃなくてcairo_pdf()を使うとうまくいった。
plotスペース内の余白を調整
【参考】
https://stackoverflow.com/questions/22951477/how-do-you-get-rid-of-empty-spaces-between-y-axis-and-first-bar-in-ggplot2
https://stackoverflow.com/questions/49764357/expand-argument-in-scale-x-discrete-with-geom-jitter
デモデータ
library(ggplot2)

data(diamonds)

ggplot(data = diamonds, mapping = aes(x = clarity, fill = cut)) +
  geom_bar()

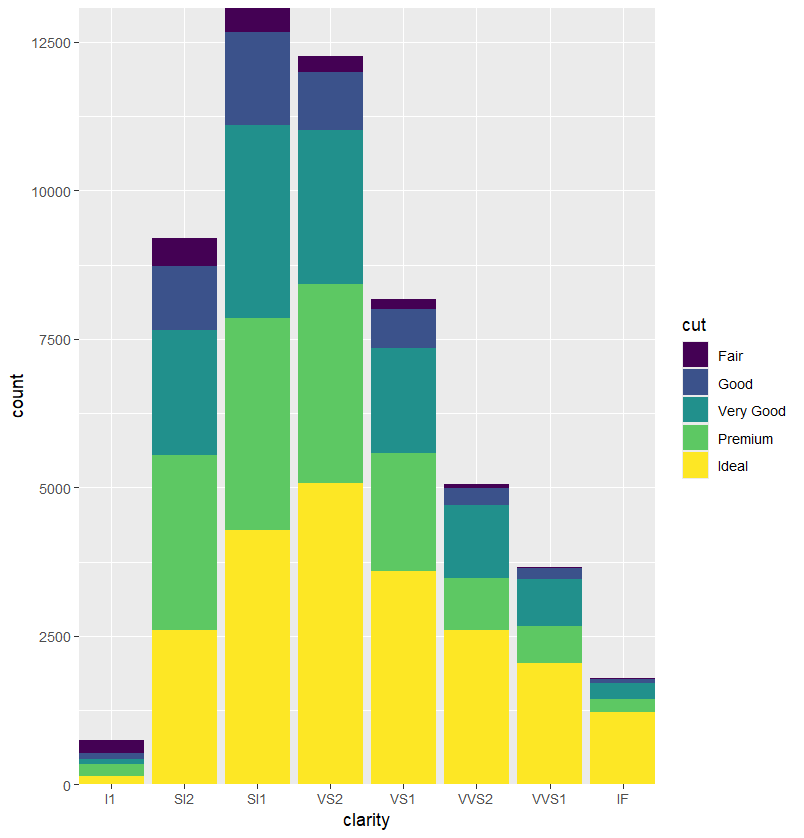
余白をゼロに
scale_x_discrete()/scale_y_discrete()のexpand=引数
ggplot(data = diamonds, mapping = aes(x = clarity, fill = cut)) +
  geom_bar() +
  scale_y_continuous(expand = c(0,0)) +
  scale_x_discrete(expand = c(0,0))
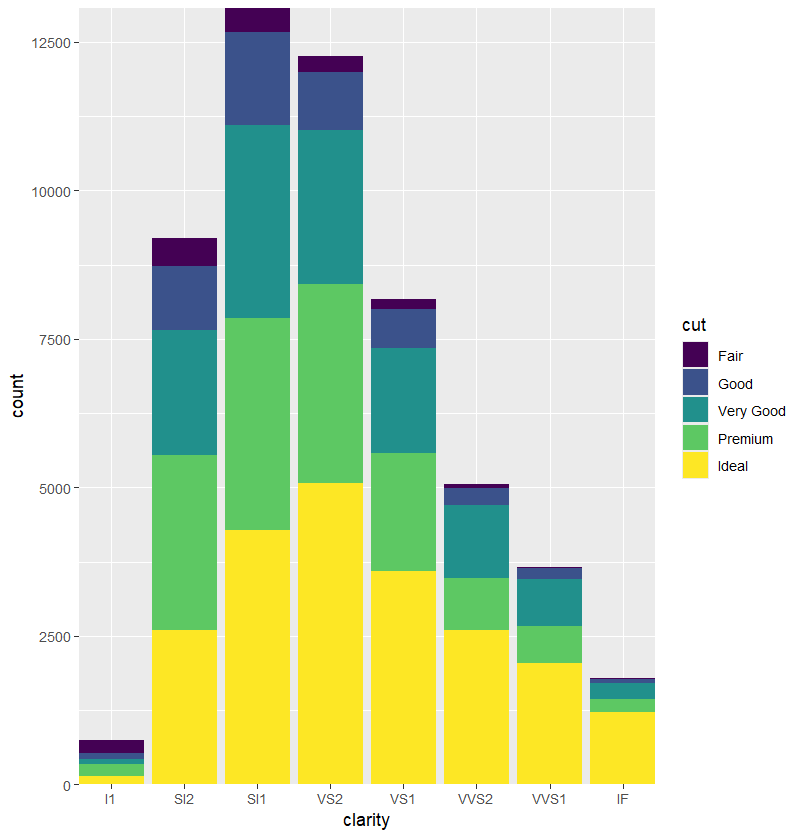
coord_cartesian(expand = FALSE)
ggplot(data = diamonds, mapping = aes(x = clarity, fill = cut)) +
  geom_bar() +
  coord_cartesian(expand = FALSE)
Legendをgrouping
https://stackoverflow.com/questions/68606964/changing-the-legends-in-ggplot2-to-have-groups-of-similar-labels
https://stackoverflow.com/questions/27803710/ggplot2-divide-legend-into-two-columns-each-with-its-own-title/27804153#27804153
1つのdata.frameでgeom_bar()を1度で終わらずに、data.frameの一部に色を割り当ててgeom_bar() ➔ new_scale_fill() ➔ geom_bar() ➔➔ を繰り返す。
library(ggplot2)
library(ggnewscale)

diamonds$cut = factor(diamonds$cut, levels=c("Fair","Good", "Very Good",
                                             "Premium","Ideal"))

labels <- levels(diamonds$cut)
labels <- setNames(labels, labels)
labels["Fair"] <- "Very Good"
labels["Good"] <- "Premium"

colors <- hcl(seq(15, 325, length.out = 5), 100, 65)
colors <- setNames(colors, levels(diamonds$cut))

ggplot() +
  geom_bar(data = diamonds, aes(color, fill = cut)) +
  scale_fill_manual(aesthetics = "fill", values = colors, labels = labels[1:2],
                    breaks = names(colors)[1:2], name = "First Group:",
                    guide = guide_legend(title.position = "left", order = 1)) +
  new_scale_fill() +
  geom_bar(data = diamonds, aes(color, fill = cut)) +
  scale_fill_manual(aesthetics = "fill", values = colors, labels = labels[3:5],
                    breaks = names(colors)[3:5], name = "Second Group:",
                    guide = guide_legend(title.position = "left", order = 0)) +
  theme(legend.position = "bottom",
        legend.direction = "horizontal",
        legend.key = element_rect(fill = "white"))
facet_gridの余白やplot scaleの設定
デモ用にmtcarsに車の生産国の情報を入れておく。
df <- mtcars

df$country <- ifelse(grepl("Mazda|Toyota|Honda|Datsun", rownames(df)),
                     yes = "Japan", no =
              ifelse(grepl("Hornet|Valiant|Duster|Cadillac|Camaro|Chrysler", rownames(df)),
                     yes = "America", no =
              ifelse(grepl("Merc|Porsche|Volvo|Fiat", rownames(df)),
                     yes = "Europe", no = "Other")))
ggplot(df, aes(x = rownames(df), y = mpg)) +
  geom_col() +
  theme(axis.text.x = element_text(angle = 45, hjust=1))

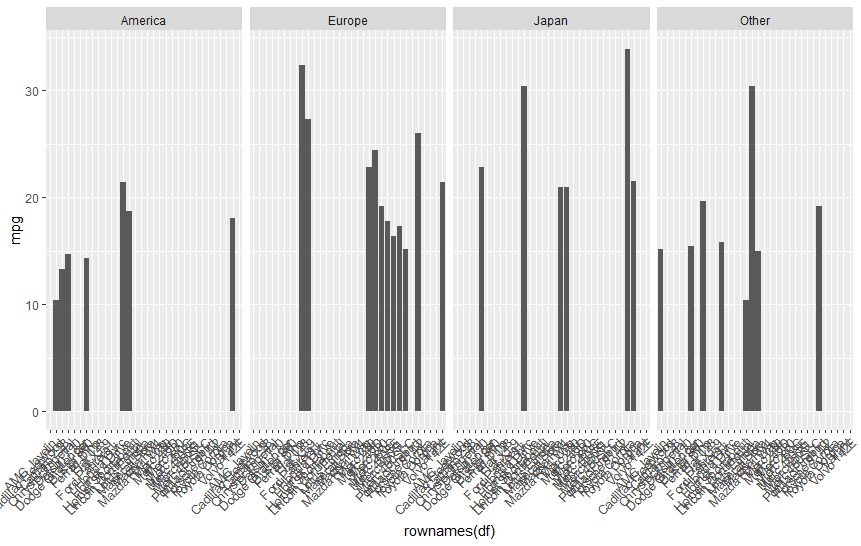
この棒グラフを生産国ごとにまとめたい。そんな時はfacet_grid()機能が有用。
facet_grid(.~分割に使用する列名)という風にggplotに加える。
ggplot(df, aes(x = rownames(df), y = mpg)) +
  geom_col() +
  theme(axis.text.x = element_text(angle = 45, hjust=1)) +
  facet_grid(.~country)
しかしデフォルトだと、分割されたplotのx軸に不要な情報が残ってしまう。
scales = "free_x"
scales = "free_x"オプションを入れると、不要なX軸は削除してくれる。
ggplot(df, aes(x = rownames(df), y = mpg)) +
  geom_col() +
  theme(axis.text.x = element_text(angle = 45, hjust=1)) +
  facet_grid(.~country, scales = "free_x")

space = "free_x"
小分割した時に、各郡でX軸の数が異なっていてもplotエリアは均一なサイズになっている。space = "free_x"も追加でつけるとX軸サンプル数に応じてplotエリアを調整してくれる。
ggplot(df, aes(x = rownames(df), y = mpg)) +
  geom_col() +
  theme(axis.text.x = element_text(angle = 45, hjust=1)) +
  facet_grid(.~country, scales = "free_x", space = "free_x")

geom_jitterとggrepel::geom_text_labelを併用するときにtext位置が合わなくなる問題
df <- data.frame(x=0, y= sqrt(1:26), label = LETTERS)
df

ggplot(df, aes(x=x,y=y)) +
  geom_jitter(height = 0) +
  ggrepel::geom_text_repel(mapping = aes(label=label))
X軸をjitterしてるのにラベルは元のX座標のものが使われている。
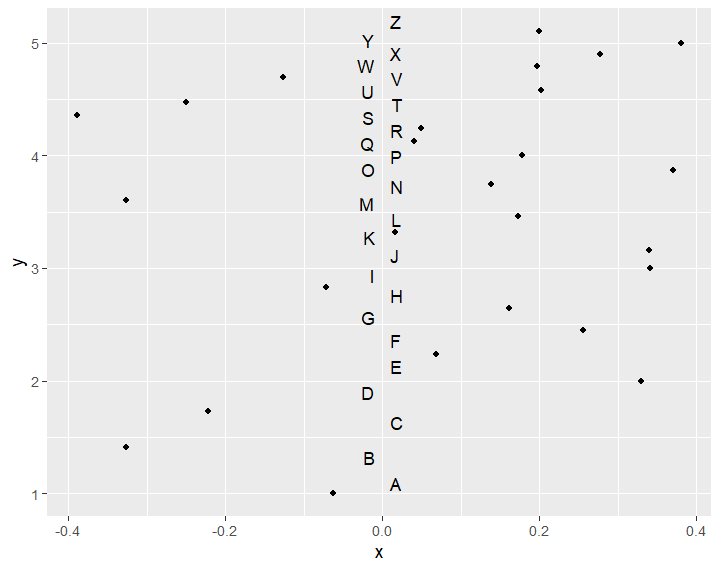
事前にpositionの情報を作っておいて、geom_jitter()とggrepel::geom_text_repel()のposition=引数にそれぞれ渡す。
pos <- position_jitter(height = 0,width = 1)

ggplot(df, aes(x=x,y=y)) +
  geom_jitter(position = pos) +
  ggrepel::geom_text_repel(mapping = aes(label=label),
                           position = pos)

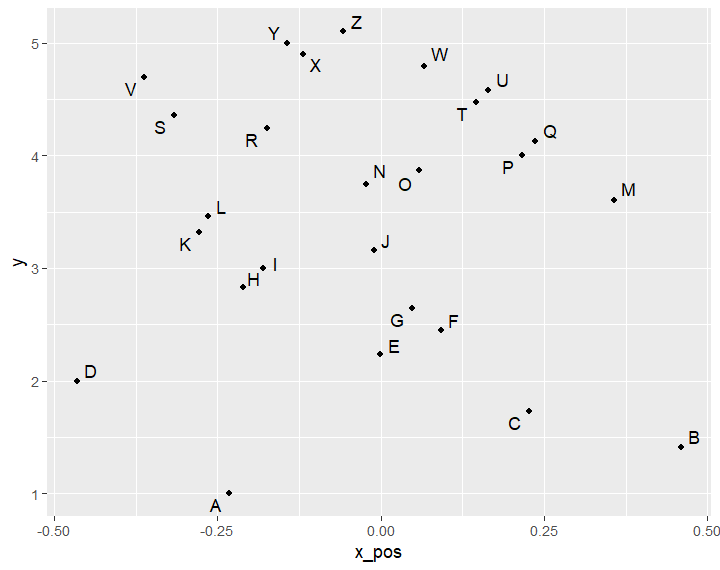
geom_jitter()を使わず、事前にjitterしたXY座標を用意してgeom_point()を使う
ggrepel::geom_text_repel()のposition=を使うとnudge_x=とnudge_y=が使えない。

df$x_pos <- df$x + runif(nrow(df), min = -0.5, max = 0.5)

ggplot(df, aes(x=x_pos,y=y)) +
  geom_point() +
  ggrepel::geom_text_repel(mapping = aes(label=label))
ggplot(df, aes(x=x_pos,y=y)) +
  geom_point() +
  ggrepel::geom_text_repel(mapping = aes(label=label),
                           nudge_y = 0.1, nudge_x = 0.1)

【 色コード列を事前に作る 】
変数列に応じて色を変えて、scale_〇〇_〇〇()で後から与える色を調整することが多いが、事前にdata.frameに色情報を列を作っておいて、その列の色コードをplotに反映できる。
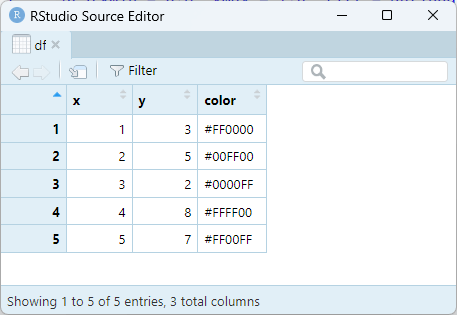
このように色コードの列を用意しておく。
# データフレームを作成し、色コード列を追加
df <- data.frame(
  x = 1:5,
  y = c(3, 5, 2, 8, 7),
  color = c("#FF0000", "#00FF00", "#0000FF", "#FFFF00", "#FF00FF") # 色コード
)
aes()の中のcolor=やfill=引数で色コード列を指定するだけであれば、値に応じてggplotのデフォルト色が与えられる。
library(ggplot2)

ggplot(df, aes(x = x, y = y, color = color)) +
  geom_point(size = 5) +
  theme_minimal()

aes()の中のcolor=やfill=引数で色コード列名を指定しつつ、scale_color_identity()やscale_fill_identity()を併用すると、色コード列の内容が採用される。
ggplot(df, aes(x = x, y = y, color = color)) +
  geom_point(size = 5) +
  scale_color_identity() + # 色コードをそのまま使う
  theme_minimal()

ちなみにguide="legend"を入れると凡例が表示される。
ggplot(df, aes(x = x, y = y, color = color)) +
  geom_point(size = 5) +
  scale_color_identity(guide = "legend") +
  theme_minimal()
