【Plot】セルサイズを値によって変えるヒートマップ
最近ちょくちょく見かけるこのようなヒートマップ。単純に色だけで変数を表現するヒートマップより、色とセルサイズの2変数を表現できてわかりやすい。

引用論文: https://www.sciencedirect.com/science/article/pii/S1535610823004403?via%3Dihub
【 Python Matplotlib版 】
上記論文内のヒートマップのPythonコードがこちらで公開されていた。heatmap用のコマンドではなく、plt.Rectangle()でセルの数だけ長方形を作ってヒートマップ様に配置する。
https://github.com/KnottLab/pembroRT-CancerCell2023/blob/master/functions/generalfunctions.py#L365
一部修正を加えたものを共有する。(コードが長いのでちゃんと読んでません。)
heatmap2のソースコード
一部matplotlibのversion更新に伴うコードの修正や、凡例表示に関して凡例の座標を修正している。
import pandas as pd
import numpy as np
import matplotlib
import matplotlib.pyplot as plt
from seaborn.utils import despine, axis_ticklabels_overlap, relative_luminance
import matplotlib.patheffects as patheffects


def _index_to_label(index):
    """Convert a pandas index or multiindex to an axis label."""
    if isinstance(index, pd.MultiIndex):
        return "-".join(map(to_utf8, index.names))
    else:
        return index.name

def _index_to_ticklabels(index):
    """Convert a pandas index or multiindex into ticklabels."""
    if isinstance(index, pd.MultiIndex):
        return ["-".join(map(to_utf8, i)) for i in index.values]
    else:
        return index.values

def _matrix_mask(data, mask):
    """Ensure that data and mask are compatabile and add missing values.

    Values will be plotted for cells where ``mask`` is ``False``.

    ``data`` is expected to be a DataFrame; ``mask`` can be an array or
    a DataFrame.

    """
    if mask is None:
        mask = np.zeros(data.shape, bool)

    if isinstance(mask, np.ndarray):
        # For array masks, ensure that shape matches data then convert
        if mask.shape != data.shape:
            raise ValueError("Mask must have the same shape as data.")

        mask = pd.DataFrame(mask,
                            index=data.index,
                            columns=data.columns,
                            dtype=bool)

    elif isinstance(mask, pd.DataFrame):
        # For DataFrame masks, ensure that semantic labels match data
        if not mask.index.equals(data.index) \
           and mask.columns.equals(data.columns):
            err = "Mask must have the same index and columns as data."
            raise ValueError(err)

    # Add any cells with missing data to the mask
    # This works around an issue where `plt.pcolormesh` doesn't represent
    # missing data properly
    mask = mask | pd.isnull(data)

    return mask

class _HeatMapper2(object):
    """Draw a heatmap plot of a matrix with nice labels and colormaps."""

    def __init__(self, data, vmin, vmax, cmap, center, robust, annot, fmt,
                 annot_kws, cellsize, cellsize_vmax,
                 cbar, cbar_kws,
                 xticklabels=True, yticklabels=True, mask=None, ax_kws=None, rect_kws=None, fontsize=4):
        """Initialize the plotting object."""
        # We always want to have a DataFrame with semantic information
        # and an ndarray to pass to matplotlib
        if isinstance(data, pd.DataFrame):
            plot_data = data.values
        else:
            plot_data = np.asarray(data)
            data = pd.DataFrame(plot_data)

        # Validate the mask and convet to DataFrame
        mask = _matrix_mask(data, mask)

        plot_data = np.ma.masked_where(np.asarray(mask), plot_data)

        # Get good names for the rows and columns
        xtickevery = 1
        if isinstance(xticklabels, int):
            xtickevery = xticklabels
            xticklabels = _index_to_ticklabels(data.columns)
        elif xticklabels is True:
            xticklabels = _index_to_ticklabels(data.columns)
        elif xticklabels is False:
            xticklabels = []

        ytickevery = 1
        if isinstance(yticklabels, int):
            ytickevery = yticklabels
            yticklabels = _index_to_ticklabels(data.index)
        elif yticklabels is True:
            yticklabels = _index_to_ticklabels(data.index)
        elif yticklabels is False:
            yticklabels = []

        # Get the positions and used label for the ticks
        nx, ny = data.T.shape

        if not len(xticklabels):
            self.xticks = []
            self.xticklabels = []
        elif isinstance(xticklabels, str) and xticklabels == "auto":
            self.xticks = "auto"
            self.xticklabels = _index_to_ticklabels(data.columns)
        else:
            self.xticks, self.xticklabels = self._skip_ticks(xticklabels,
                                                             xtickevery)

        if not len(yticklabels):
            self.yticks = []
            self.yticklabels = []
        elif isinstance(yticklabels, str) and yticklabels == "auto":
            self.yticks = "auto"
            self.yticklabels = _index_to_ticklabels(data.index)
        else:
            self.yticks, self.yticklabels = self._skip_ticks(yticklabels,
                                                             ytickevery)

        # Get good names for the axis labels
        xlabel = _index_to_label(data.columns)
        ylabel = _index_to_label(data.index)
        self.xlabel = xlabel if xlabel is not None else ""
        self.ylabel = ylabel if ylabel is not None else ""

        # Determine good default values for the colormapping
        self._determine_cmap_params(plot_data, vmin, vmax,
                                    cmap, center, robust)

        # Determine good default values for cell size
        self._determine_cellsize_params(plot_data, cellsize, cellsize_vmax, mask)

        # Sort out the annotations
        if annot is None:
            annot = False
            annot_data = None
        elif isinstance(annot, bool):
            if annot:
                annot_data = plot_data
            else:
                annot_data = None
        else:
            try:
                annot_data = annot.values
            except AttributeError:
                annot_data = annot
            if annot.shape != plot_data.shape:
                raise ValueError('Data supplied to "annot" must be the same '
                                 'shape as the data to plot.')
            annot = True

        # Save other attributes to the object
        self.data = data
        self.plot_data = plot_data

        self.annot = annot
        self.annot_data = annot_data

        self.fmt = fmt
        self.annot_kws = {} if annot_kws is None else annot_kws
        self.annot_kws.setdefault('color', "black")
        self.annot_kws.setdefault('ha', "center")
        self.annot_kws.setdefault('va', "center")
        self.annot_kws.setdefault('fontsize', fontsize)
        self.cbar = cbar
        self.cbar_kws = {} if cbar_kws is None else cbar_kws
        self.cbar_kws.setdefault('ticks', matplotlib.ticker.MaxNLocator(6))
        self.ax_kws = {} if ax_kws is None else ax_kws
        self.rect_kws = {} if rect_kws is None else rect_kws
        # self.rect_kws.setdefault('edgecolor', "black")

    def _determine_cmap_params(self, plot_data, vmin, vmax,
                               cmap, center, robust):
        """Use some heuristics to set good defaults for colorbar and range."""
        calc_data = plot_data.data[~np.isnan(plot_data.data)]
        if vmin is None:
            vmin = np.percentile(calc_data, 2) if robust else calc_data.min()
        if vmax is None:
            vmax = np.percentile(calc_data, 98) if robust else calc_data.max()
        self.vmin, self.vmax = vmin, vmax

        # Choose default colormaps if not provided
        if cmap is None:
            if center is None:
                self.cmap = cm.rocket
            else:
                self.cmap = cm.icefire
        elif isinstance(cmap, str):
            self.cmap = plt.get_cmap(cmap)
        elif isinstance(cmap, list):
            self.cmap = matplotlib.colors.ListedColormap(cmap)
        else:
            self.cmap = cmap

        # Recenter a divergent colormap
        if center is not None:
            vrange = max(vmax - center, center - vmin)
            normlize = matplotlib.colors.Normalize(center - vrange, center + vrange)
            cmin, cmax = normlize([vmin, vmax])
            cc = np.linspace(cmin, cmax, 256)
            self.cmap = matplotlib.colors.ListedColormap(self.cmap(cc))

    def _determine_cellsize_params(self, plot_data, cellsize, cellsize_vmax, mask=None):

        if cellsize is None:
            self.cellsize = np.ones(plot_data.shape)
            self.cellsize_vmax = 1.0
        else:
            if isinstance(cellsize, pd.DataFrame):
                cellsize = cellsize.values
            self.cellsize = cellsize
            if cellsize_vmax is None:
                ## maskがあるときはマスクされた値以外で最大値を自動決定するように改変
                if mask is None:
                    cellsize_vmax = cellsize.max()
                else:
                    cellsize_vmax = np.max(cellsize * ~mask)
            self.cellsize_vmax = cellsize_vmax

    def _skip_ticks(self, labels, tickevery):
        """Return ticks and labels at evenly spaced intervals."""
        n = len(labels)
        if tickevery == 0:
            ticks, labels = [], []
        elif tickevery == 1:
            ticks, labels = np.arange(n) + .5, labels
        else:
            start, end, step = 0, n, tickevery
            ticks = np.arange(start, end, step) + .5
            labels = labels[start:end:step]
        return ticks, labels

    def _auto_ticks(self, ax, labels, axis, fontsize):
        """Determine ticks and ticklabels that minimize overlap."""
        transform = ax.figure.dpi_scale_trans.inverted()
        bbox = ax.get_window_extent().transformed(transform)
        size = [bbox.width, bbox.height][axis]
        axis = [ax.xaxis, ax.yaxis][axis]
        tick, = axis.set_ticks([0])
        max_ticks = int(size // (fontsize / 72))
        if max_ticks < 1:
            return [], []
        tick_every = len(labels) // max_ticks + 1
        tick_every = 1 if tick_every == 0 else tick_every
        ticks, labels = self._skip_ticks(labels, tick_every)
        return ticks, labels

    def plot(self, ax, cax, fontsize, rowcolors=None, colcolors=None, ref_sizes=None, ref_labels=None, ref_position="right", ref_gap=0.1):
        """Draw the heatmap on the provided Axes."""

        # Remove all the Axes spines
        despine(ax=ax, left=True, bottom=True)

        # Draw the heatmap and annotate
        height, width = self.plot_data.shape
        xpos, ypos = np.meshgrid(np.arange(width) + .5, np.arange(height) + .5)

        data = self.plot_data.data
        cellsize = self.cellsize

        mask = self.plot_data.mask
        if not isinstance(mask, np.ndarray) and not mask:
            mask = np.zeros(self.plot_data.shape, bool)

        annot_data = self.annot_data
        if not self.annot:
            annot_data = np.zeros(self.plot_data.shape)

        # Draw rectangles instead of using pcolormesh
        # Might be slower than original heatmap
        for x, y, m, val, s, an_val in zip(xpos.flat, ypos.flat, mask.flat, data.flat, cellsize.flat, annot_data.flat):
            if not m:
                vv = (val - self.vmin) / (self.vmax - self.vmin)
                size = np.clip(s / self.cellsize_vmax, 0.1, 1.0)
                color = self.cmap(vv)
                rect = plt.Rectangle([x - size / 2, y - size / 2], size, size, facecolor=color, label=None, **self.rect_kws)
                ax.add_patch(rect)

                if self.annot:
                    annotation = ("{:" + self.fmt + "}").format(an_val)
                    text = ax.text(x, y, annotation, **self.annot_kws)
                    # add edge to text
                    text_luminance = relative_luminance(text.get_color())
                    text_edge_color = ".15" if text_luminance > .408 else "w"
                    text.set_path_effects([matplotlib.patheffects.withStroke(linewidth=1, foreground=text_edge_color)])


        ## セルサイズの凡例
        ## Draw rectangles for size scale using specific reference sizes
        if ref_sizes is not None:

            # ref_s = [1.30,2.00,3.00,5.00,10.00,self.cellsize_vmax]
            # ref_l = ['0.05','0.01','1e-3','1e-5','1e-10','maxsize: '+'{:.1e}'.format(10**(-1*self.cellsize_vmax))]
            x_shift = np.max(xpos) + 2 # <- 凡例用セルの表示位置を右にずらす
            ref_s = ref_sizes + [self.cellsize_vmax]
            ref_l = ref_labels + ['maxsize']
            ref_x = x_shift*np.ones(len(ref_s))
            ref_y = np.arange(len(ref_s))

            for i, (x, y, s, l) in enumerate(zip(ref_x, ref_y, ref_s, ref_l)):
                # 凡例用のセルサイズ計算(ヒートマップのセルサイズ計算と同じ処理を行う)
                size = np.clip(s / self.cellsize_vmax, 0.1, 1.0)
                # print(f"{x}-{y}-{size}-{l}")

                if ref_gap > 0:
                    if i == 0:
                        y2 = y + 1
                        last_size = size
                    # 最後の要素 最後の位置からcellsize_maxは少しずらす
                    elif i == len(ref_x) - 1:
                        y2 = y2 + size + ref_gap*2
                    # それ以外の時は、最後の位置から 0.1ずらす
                    else:
                        y2 = y2 + size + ref_gap
                        last_size = size
                else:
                    y2 = y + 1 # 開始位置を補正


                rect = plt.Rectangle(xy=[x - size / 2, y2 - size / 2], width=size, height=size, facecolor='k', label=l, **self.rect_kws)
                ax.add_patch(rect)
                ax.text(x + 1, y2, l, **self.annot_kws) # <--- 表示ラベル位置を右にずらした


        ## Draw rectangles to provide a row color annotation
        if rowcolors is not None:
            for i,r in enumerate(rowcolors):
                for x,y,c in zip(xpos[:,0]-(15+i),ypos[:,0],r):
                    size = 1
                    rect = plt.Rectangle([x - size / 2, y - size / 2], size, size, facecolor=c, label=None, linewidth=0, edgecolor=None, **self.rect_kws)
                    ax.add_patch(rect)

        ## Draw rectangles to provide a column color annotation
        if colcolors is not None:
            for i,c in enumerate(colcolors):
                for x,y,c in zip(xpos[0,:],ypos[0,:]-(10+i),c):
                    size = 1
                    rect = plt.Rectangle([x - size / 2, y - size / 2], size, size, facecolor=c, label=None, linewidth=0, edgecolor=None, **self.rect_kws)
                    ax.add_patch(rect)

        # plotの表示範囲を制限 セルサイズの凡例がある時は右に範囲を広げている。
        # Set the axis limits
        if ref_sizes is not None:
            ax.set(xlim=(0, self.data.shape[1] + 2), ylim=(0, self.data.shape[0]))
        else:
            ax.set(xlim=(0, self.data.shape[1]), ylim=(0, self.data.shape[0]))

        # Set other attributes
        ax.set(**self.ax_kws)

        if self.cbar:
            norm = matplotlib.colors.Normalize(vmin=self.vmin, vmax=self.vmax)
            scalar_mappable = matplotlib.cm.ScalarMappable(cmap=self.cmap, norm=norm)
            scalar_mappable.set_array(self.plot_data.data)
            cb = ax.figure.colorbar(scalar_mappable, cax, ax, **self.cbar_kws)
            cb.outline.set_linewidth(0)
            cb.ax.tick_params(labelsize=fontsize)

        # Add row and column labels
        if isinstance(self.xticks, str) and self.xticks == "auto":
            xticks, xticklabels = self._auto_ticks(ax, self.xticklabels, axis=0, fontsize=fontsize)
        else:
            xticks, xticklabels = self.xticks, self.xticklabels

        if isinstance(self.yticks, str) and self.yticks == "auto":
            yticks, yticklabels = self._auto_ticks(ax, self.yticklabels, axis=1, fontsize=fontsize)
        else:
            yticks, yticklabels = self.yticks, self.yticklabels

        ax.set(xticks=xticks, yticks=yticks)
        xtl = ax.set_xticklabels(xticklabels, fontsize=fontsize)
        ytl = ax.set_yticklabels(yticklabels, rotation="vertical", fontsize=fontsize)

        # Possibly rotate them if they overlap
        ax.figure.draw(ax.figure.canvas.get_renderer())
        if axis_ticklabels_overlap(xtl):
            plt.setp(xtl, rotation="vertical")
        if axis_ticklabels_overlap(ytl):
            plt.setp(ytl, rotation="horizontal")

        # Add the axis labels
        ax.set(xlabel=self.xlabel, ylabel=self.ylabel)

        # Invert the y axis to show the plot in matrix form
        ax.invert_yaxis()

def heatmap2(data, vmin=None, vmax=None, cmap=None, center=None, robust=False,
            annot=None, fmt=".2g", annot_kws=None,
            cellsize=None, cellsize_vmax=None,
            ref_sizes=None, ref_labels=None, ref_position="right",ref_gap=0.1,
            cbar=True, cbar_kws=None, cbar_ax=None,
            square=True, xticklabels="auto", yticklabels="auto",rowcolors=None,colcolors=None,
            mask=None, ax=None, ax_kws=None, rect_kws=None, fontsize=4, figsize=(2,2)):

    # Initialize the plotter object
    plotter = _HeatMapper2(data, vmin, vmax, cmap, center, robust,
                          annot, fmt, annot_kws,
                          cellsize, cellsize_vmax,
                          cbar, cbar_kws, xticklabels,
                          yticklabels, mask, ax_kws, rect_kws, fontsize)

    # Draw the plot and return the Axes
    if ax is None:
        fig,ax = plt.subplots(figsize=figsize, facecolor=(0,0,0,0), alpha=0, ) # facecolor=(0,0,0,0)はRGBAの値を指定
    if square:
        ax.set_aspect("equal")

    # delete grid
    ax.grid(False)

    plotter.plot(ax, cbar_ax, fontsize=fontsize, rowcolors=rowcolors, colcolors=colcolors, ref_sizes=ref_sizes, ref_labels=ref_labels, ref_position=ref_position, ref_gap=ref_gap)

    return ax
引数
-
data: メインのデータ。この値の違いを色で表現する。 -
cellsize: セルサイズを規定する値を持つデータを指定する。data=で指定したものと同じ形状。 -
cellsize_vmax: 最大セルサイズを割り当てる値。指定値が大きいほど、セルサイズの大小の差が大きくなる。
コード内部では各値をcellsize_vmaxで割ってから下限0.1、上限1にclipしている。size = np.clip(s / self.cellsize_vmax, 0.1, 1.0) -
mask: ヒートマップをマスクして非表示にするセルを指定する。data=で指定したものと同じ形状でbool値のものを用意する。Trueの箇所がマスクされる。 -
vmin/vmax/center: 色を割り当てる最小値/最大値/中央値を指定する場合に使用。 -
cmap: Matplotlibで指定可能なcolormapを指定。 -
square: セルが正方形になるように強制。Falseだとfigure sizeに合わせてセルが長方形になったりする。 -
fontsize: ヒートマップに表示する文字のサイズ -
figsize: ヒートマップ全体のfigure size。 -
annot: セルにmetricsの値を表示するかどうか。bool値。
Matplotlibのplotコマンドを使用しており、heatmap2()で用意されていない引数でも〇〇_kws=引数で指定できるものもある。辞書で指定する。
-
cbar_kws: colorbarに関するオプションを渡す。
例)colorbarを小さくする。cbar_kws={"shrink":0.5} -
rect_kws:plt.Rectangle()に渡される。セルの枠線などはここで指定できる。
例) セルに黒枠を付ける。rect_kws={"edgecolor": "black", "linewidth": 1}
※ これ以外にも引数がある。知りたければソースコードを見るべし。
plot例
デモデータ mtcars
mtcarsデータセットで変数間の相関解析を総当たりで行ったものをデモに使用する。
import pandas as pd

# Import CSV mtcars
data = pd.read_csv('https://gist.githubusercontent.com/ZeccaLehn/4e06d2575eb9589dbe8c365d61cb056c/raw/64f1660f38ef523b2a1a13be77b002b98665cdfe/mtcars.csv', index_col=0)

# Edit element of column header
data.rename(columns={'Unnamed: 0':'brand'}, inplace=True)
変数間の相関解析を行う。
import scipy

corr,pval = scipy.stats.spearmanr(data,axis=0)
corr = pd.DataFrame(corr, index=data.columns, columns=data.columns)
pval = pd.DataFrame(pval, index=data.columns, columns=data.columns)

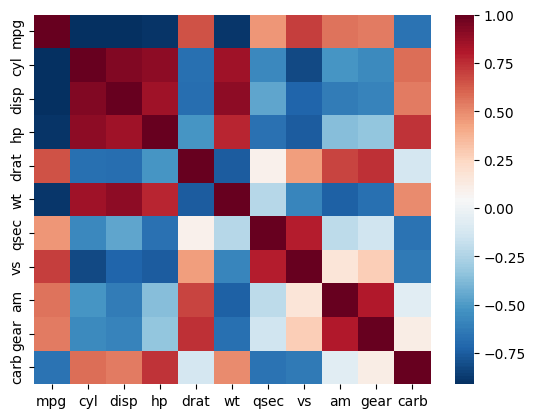
この時点で相関係数をシンプルなヒートマップで描画するとこんな感じ。
import seaborn as sns

sns.heatmap(corr, cmap="RdBu_r")

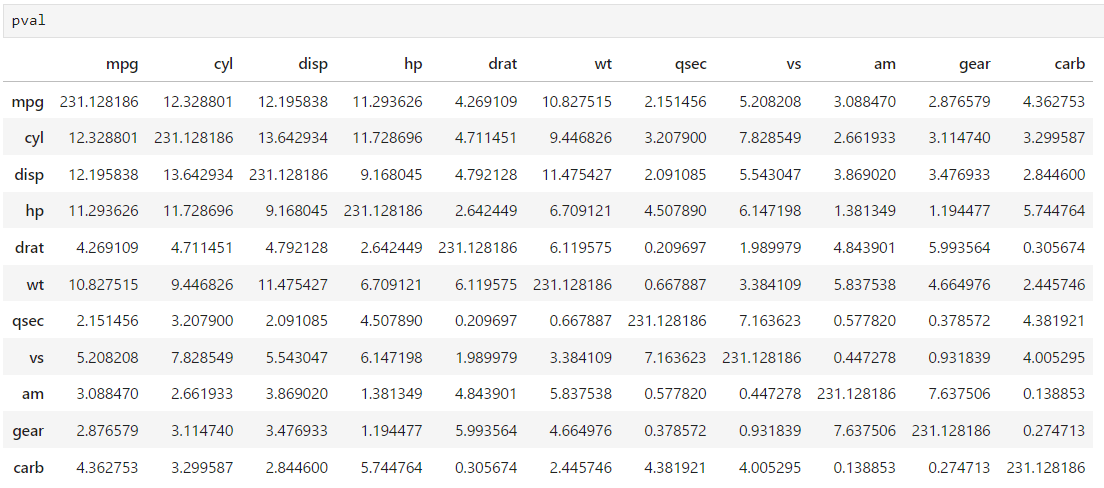
p値の変換
セルサイズは値が大きいものほどセルサイズが大きくなる。p値が小さいほど大きな値になるようにlog10して正負を逆転しておく。
pval = -1*np.log10(pval)

# p値が0の箇所はInfになる。データ無いの最大値を入れておく。
pval[np.isinf(pval)] = np.max(pval[~np.isinf(pval)])

-log10変換後のp値
それでは相関係数で色が変わり、p値でセルサイズが変わるヒートマップを描いてみる。
ヒートマップ例1)
cellsize_vmax=10にして、p値が1e-10が最もセルサイズが大きくなるように設定した。
heatmap2(data=corr,cmap='RdBu_r',vmin=-1,vmax=1,cbar_kws={"shrink":0.5},
         cellsize=pval,square=True, cellsize_vmax=10,fontsize=10, figsize=(10,10))
※ 同じ変数同士の対角成分の値が高くなってしまう。

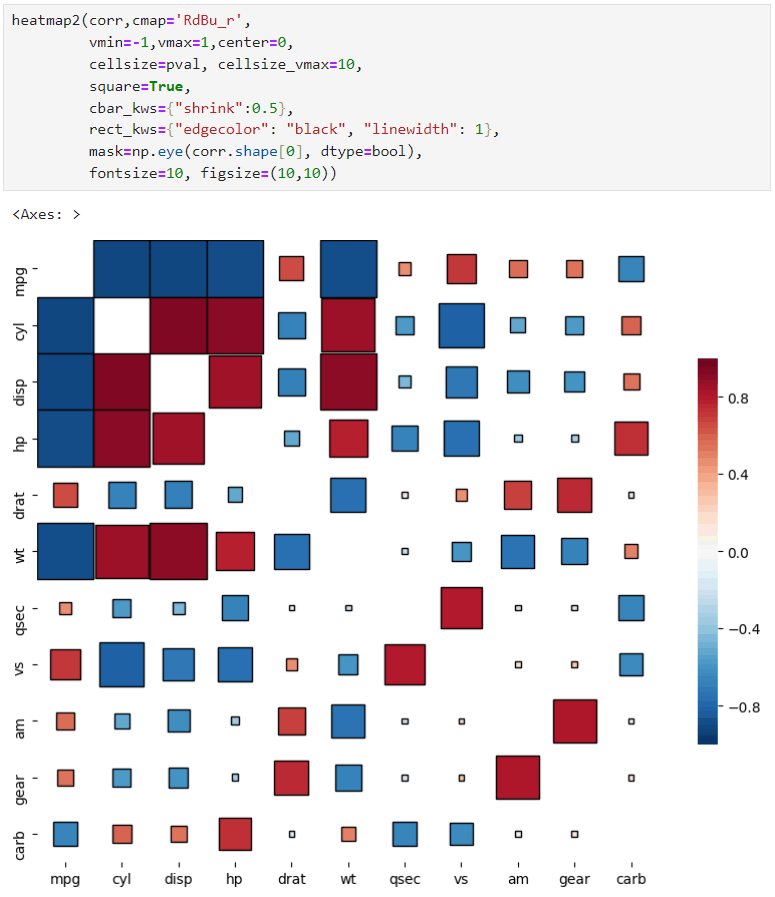
ヒートマップ例2) mask
このデモデータでは対角成分は同じ変数間の相関解析であまり意味は無いので、対角成分をマスクして非表示にする。
(さらに枠線も付けてみた。)
heatmap2(data=corr,cmap='RdBu_r',
         vmin=-1,vmax=1,center=0,
         cellsize=pval, cellsize_vmax=10,
         square=True,
         cbar_kws={"shrink":0.5},
         rect_kws={"edgecolor": "black", "linewidth": 1},
         mask=np.eye(corr.shape[0], dtype=bool),
         fontsize=10, figsize=(10,10))

ヒートマップ例3) セルサイズの凡例を追加する
セルサイズとセルサイズが意味する値を凡例に表示する。ソースコードを改変して、plotの右側に配置されるようにした。ref_gap=オプションを追加し、凡例間の間隔が調整可能。デフォルトは0.1。
このデモではp値を-log10した値を基にセルサイズを変更しているので、代表的なp値の変換後の値を確認しておく。

この値を、ref_sizes=、ref_labels=に指定する。
heatmap2(corr,cmap='RdBu_r',
         vmin=-1,vmax=1,center=0,
         cellsize=pval, cellsize_vmax=10,
         square=True,annot=True,
         cbar_kws={"shrink":0.5},
         rect_kws={"edgecolor": "black", "linewidth": 1},
         mask=np.eye(corr.shape[0], dtype=bool),
         fontsize=10, figsize=(20,10),
         ref_sizes=[1.30,2.00,3.00,5.00,10.00],
         ref_labels=['0.05','0.01','1e-3','1e-5','1e-10'],
        )
maxsizeと付いたものが表示されるが、cellsize_vmax=で指定した最大値の場合のセルサイズである。

【 R ggplot2版】
library(ggplot2)
library(RColorBrewer)
デモデータ
mtcarsの変数間の相関解析データを使用する。data.frameの相関はpsychパッケージのcorr.test()を使用した。
data(mtcars)

library(psych)
res <- corr.test(mtcars)

# 相関係数を取り出し
r <- res$r

# 調整済みp値の取り出し
p <- t(res$p)
p[upper.tri(p)] <- res$p[upper.tri(res$p)]
# 対角成分の値が0になっているのでNAにしておく
diag(p) <- NA

# ロング型に成型
df <- reshape2::melt(r)
tmp <- reshape2::melt(p)
df$p.adj <- tmp$value
ggplotではロング型でデータを扱う。

p値を対数変換して正負を逆転しておく。p値が低い方が値が大きくなる。
df$p.adj_log10 <- -log10( df$p.adj)
# 必要に応じて値をclip
df$p.adj_log10_clipped <- pmin(df$p.adj_log10, 10)
geom_point版
geom_point()はdot plotを描く際によく使用されるが、shape=22の形状であれば塗りつぶし可能な四角い点となる。fill=に相関係数の列名、size=にp値の列名を指定すればよい。
scale_size_continuous()のrange=引数でbox sizeのサイズの範囲を指定できる。
値が小さい方に意味があるなら、1要素目の値を大きく、2要素目の値を小さくするとよい。
ggplot(df, aes(x = Var1, y = Var2)) +
  geom_point(aes(fill=value, size=p.adj), shape=22) +
  scale_fill_gradientn(colours = rev(brewer.pal(n = 11, name = "RdBu")),
                       limits = c(-1,1)) +
  scale_size_continuous(range = c(10,1), limits = c(0,1)) +
  labs(fill = "Pearson R", size = "p.adj") +
  ylab("") +
  xlab("")

-log10(adj.pval)の例も記しておく。
ggplot(df, aes(x = Var1, y = Var2)) +
  geom_point(aes(fill=value, size=p.adj_log10_clipped), shape=22) +
  scale_fill_gradientn(colours = rev(brewer.pal(n = 11, name = "RdBu")),
                       limits = c(-1,1)) +
  scale_size_continuous(range = c(1,10), # <- 最小サイズ、最大サイズを指定
                        breaks = c(1.3,2,3,5,10),
                        labels = c("0.05","0.01","1e-3","1e-5","1e-10")) +
  labs(fill = "Pearson R", size = "p.adj") +
  ylab("") +
  xlab("")

geom_rect版
Rectangleを描くコマンドで、aes()には長方形の範囲を示すxmin=/xmax=/ymin=/ymax=の指定が必須となる。geom_rect()でヒートマップっぽく描くには事前にRectangleを配置する座標を用意しなければならない。
デモデータは11行11列のヒートマップとなる。単純に1つのセルが高さ1、幅1を最大値として考えると計算しやすい。
level <- unique(df$Var1)
# 水準に基づき整数の値を割り振り。長方形の中心座標となる。
df$xcenter <- as.numeric(factor(df$Var1,levels = level))
df$ycenter <- as.numeric(factor(df$Var2,levels = level))

# 最大値で割って、0.1-1のサイズにclip
cellsize_vmax <- 10
df$cellsize <- pmax(pmin(df$p.adj_log10 / cellsize_vmax, 1),0.1)

# 長方形の座標
df$xmin <- df$xcenter - df$cellsize/2
df$ymin <- df$ycenter - df$cellsize/2
df$xmax <- df$xmin + df$cellsize
df$ymax <- df$ymin + df$cellsize
ggplot(df, aes(x = Var1, y = Var2)) +
  geom_rect(aes(xmin=xmin,ymin=ymin,xmax = xmax,ymax = ymax,
                fill=value),
            color="black" # 枠線
            ) +
  scale_fill_gradientn(colours = rev(brewer.pal(n = 11, name = "RdBu")),
                       limits = c(-1,1)) +
  labs(fill = "Pearson R") +
  ylab("") +
  xlab("") +
  theme(aspect.ratio = 1)

geom_rect()だけだとセルサイズの凡例が作れない。。。
次のコードではダミーでgeom_point()を入れて何とか凡例を作っている。
ggplot(df, aes(x = Var1, y = Var2)) +
  geom_rect(aes(xmin=xmin,ymin=ymin,xmax = xmax,ymax = ymax,
                fill=value),
            color = "black") +
  scale_fill_gradientn(colours = rev(brewer.pal(n = 11, name = "RdBu")),
                       limits = c(-1,1)) +
  geom_point(aes(x = Inf,y = Inf, size = cellsize), shape=15, alpha=1) +
  scale_size_continuous(breaks = c(0.13,0.2,0.3,0.5,1),
                        labels = c("0.05","0.01","1e-3","1e-5","1e-10")) +
  labs(fill = "Pearson R", size = "adj.pval") +
  ylab("") +
  xlab("") +
  theme(aspect.ratio = 1)
右上にgeom_point()の固まりが残ってしまうが、、、、

Discussion