PointRend in Detectron2
人物の背景変更等に使えそうなセグメンテーションを試してみました。
Google Colab上で試したところ、処理時間は、140ms~200ms/枚ほどかかりました。
バーチャル背景に使えるかと思いましたが、リアルタイム処理には重いです。
"PointRend in Detectron2" チュートリアル
Detectron2 の PointRend プロジェクトへようこそ! このチュートリアルでは、以下のようなPointRendの基本的な使い方を説明します。
- 既存のPointRendモデルを用いて、画像や動画に対して推論を行う
- PointRendの内部表現について調べる。
このチュートリアルをコピーするか、"File -> Open in playground mode "を使って、ご自身で遊んでみてください。
detectron2 のインストール
# 依存関係をインストールします。
!pip install pyyaml==5.1
# pytorchのインストールを確認します。
import torch, torchvision
print(torch.__version__, torch.cuda.is_available())
1.11.0+cu113 True
# PointRendプロジェクトで定義された設定を取得するためにリポジトリをクローンします。
!git clone --branch v0.6 https://github.com/facebookresearch/detectron2.git detectron2_repo
# detectron2をソースからインストールします。
!pip install -e detectron2_repo
# インストールオプションについては、https://detectron2.readthedocs.io/tutorials/install.htmlを確認してください。
# インストールを有効にするために、ランタイムを再起動する必要があるかもしれません。
# 基本的なセットアップをします。
# detectron2ロガーのセットアップ
import detectron2
from detectron2.utils.logger import setup_logger
setup_logger()

# 一般的なライブラリのインポート
import numpy as np
import cv2
import torch
from google.colab.patches import cv2_imshow

# detectron2の一般的なライブラリのインポート
from detectron2 import model_zoo
from detectron2.engine import DefaultPredictor
from detectron2.config import get_cfg
from detectron2.utils.visualizer import Visualizer, ColorMode
from detectron2.data import MetadataCatalog
coco_metadata = MetadataCatalog.get("coco_2017_val")

# PointRendプロジェクトのインポート
from detectron2.projects import point_rend
学習済みPointRendモデルの実行
COCO datasetから画像をダウンロードします。
!wget http://images.cocodataset.org/val2017/000000005477.jpg -q -O input.jpg
im = cv2.imread("./input.jpg")
cv2_imshow(im)

まず、推論を実行するために,detectron2 configとdetectron2 DefaultPredictorを作成します。ここでは、標準的なMask R-CNNモデルで推論を行います。
cfg = get_cfg()
cfg.merge_from_file(model_zoo.get_config_file("COCO-InstanceSegmentation/mask_rcnn_R_50_FPN_3x.yaml"))
cfg.MODEL.ROI_HEADS.SCORE_THRESH_TEST = 0.5  # set threshold for this model
cfg.MODEL.WEIGHTS = model_zoo.get_checkpoint_url("COCO-InstanceSegmentation/mask_rcnn_R_50_FPN_3x.yaml")
mask_rcnn_predictor = DefaultPredictor(cfg)
mask_rcnn_outputs = mask_rcnn_predictor(im)
ここで、PointRendモデルを利用し、その結果を表示します。
cfg = get_cfg()
# PointRendの設定を追加
point_rend.add_pointrend_config(cfg)
# ファイルから設定を読込
cfg.merge_from_file("detectron2_repo/projects/PointRend/configs/InstanceSegmentation/pointrend_rcnn_R_50_FPN_3x_coco.yaml")
cfg.MODEL.ROI_HEADS.SCORE_THRESH_TEST = 0.5  # set threshold for this model
# PointRend model zooのモデルを利用します。 https://github.com/facebookresearch/detectron2/tree/master/projects/PointRend#pretrained-models
cfg.MODEL.WEIGHTS = "detectron2://PointRend/InstanceSegmentation/pointrend_rcnn_R_50_FPN_3x_coco/164955410/model_final_edd263.pkl"
predictor = DefaultPredictor(cfg)
outputs = predictor(im)
# 2つの推論を表示し、比較します。
v = Visualizer(im[:, :, ::-1], coco_metadata, scale=1.2, instance_mode=ColorMode.IMAGE_BW)
mask_rcnn_result = v.draw_instance_predictions(mask_rcnn_outputs["instances"].to("cpu")).get_image()
v = Visualizer(im[:, :, ::-1], coco_metadata, scale=1.2, instance_mode=ColorMode.IMAGE_BW)
point_rend_result = v.draw_instance_predictions(outputs["instances"].to("cpu")).get_image()
print("Mask R-CNN with PointRend (top)     vs.     Default Mask R-CNN (bottom)")
cv2_imshow(np.concatenate((point_rend_result, mask_rcnn_result), axis=0)[:, :, ::-1])
Mask R-CNN with PointRend (top) vs. Default Mask R-CNN (bottom)

PointRendのポイントサンプリング処理を可視化
このセクションでは、PointRendのポイントサンプリング処理がどのように行われるかを示します。そのためには、model.forward(...)関数の中間表現にアクセスする必要があります。このように、モデルの内部状態や属性を確認しながら、手動でステップを進めます。
# First we define a simple function to help us plot the intermediate representations.
import matplotlib.pyplot as plt

def plot_mask(mask, title="", point_coords=None, figsize=10, point_marker_size=5):
  '''
  Simple plotting tool to show intermediate mask predictions and points
  where PointRend is applied.

  Args:
    mask (Tensor): mask prediction of shape HxW
    title (str): title for the plot
    point_coords ((Tensor, Tensor)): x and y point coordinates
    figsize (int): size of the figure to plot
    point_marker_size (int): marker size for points
  '''

  H, W = mask.shape
  plt.figure(figsize=(figsize, figsize))
  if title:
    title += ", "
  plt.title("{}resolution {}x{}".format(title, H, W), fontsize=30)
  plt.ylabel(H, fontsize=30)
  plt.xlabel(W, fontsize=30)
  plt.xticks([], [])
  plt.yticks([], [])
  plt.imshow(mask, interpolation="nearest", cmap=plt.get_cmap('gray'))
  if point_coords is not None:
    plt.scatter(x=point_coords[0], y=point_coords[1], color="red", s=point_marker_size, clip_on=True)
  plt.xlim(-0.5, W - 0.5)
  plt.ylim(H - 0.5, - 0.5)
  plt.show()
前節でpredictorとimをロードした状態で、backbone, bounding box prediction、coarse mask segmenation headを実行します。荒いマスクのセグメンテーションを可視化します。
from detectron2.data import transforms as T
model = predictor.model
# In this image we detect several objects but show only the first one.
instance_idx = 0
# Mask predictions are class-specific, "plane" class has id 4.
category_idx = 4

with torch.no_grad():
  # Prepare input image.
  height, width = im.shape[:2]
  im_transformed = T.ResizeShortestEdge(800, 1333).get_transform(im).apply_image(im)
  batched_inputs = [{"image": torch.as_tensor(im_transformed).permute(2, 0, 1)}]

  # Get bounding box predictions first to simplify the code.
  detected_instances = [x["instances"] for x in model.inference(batched_inputs)]
  [r.remove("pred_masks") for r in detected_instances]  # remove existing mask predictions
  pred_boxes = [x.pred_boxes for x in detected_instances]

  # Run backbone.
  images = model.preprocess_image(batched_inputs)
  features = model.backbone(images.tensor)

  # Given the bounding boxes, run coarse mask prediction head.
  mask_coarse_logits = model.roi_heads.mask_head.coarse_head(model.roi_heads.mask_head._roi_pooler(features, pred_boxes))

  plot_mask(
      mask_coarse_logits[instance_idx, category_idx].to("cpu"),
      title="Coarse prediction"
  )

  # Prepare features maps to use later
mask_features_list = [
  features[k] for k in model.roi_heads.mask_head.mask_point_in_features
]
features_scales = [
  model.roi_heads.mask_head._feature_scales[k]
  for k in model.roi_heads.mask_head.mask_point_in_features
]
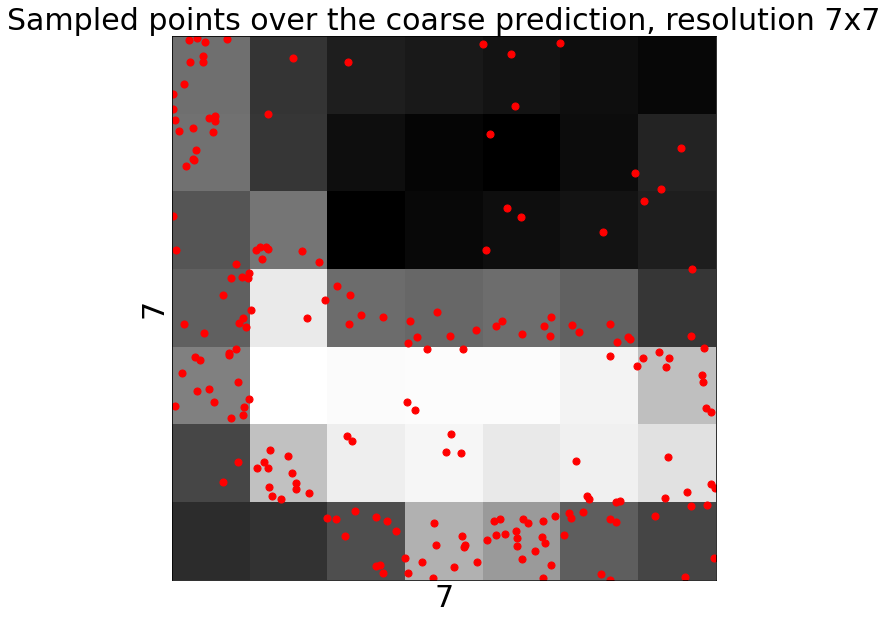
トレーニング中のポイントサンプリング
学習時には、粗い予測から不確かなポイントを選んで、PointRendを学習させます。詳しくはPointRendの論文の3.1節を参照してください。
サンプリング戦略の違いを可視化するために、以下のように oversample_ratio と importance_sample_ratio のパラメータを変更します。
from detectron2.projects.point_rend.mask_head import calculate_uncertainty
from detectron2.projects.point_rend.point_features import get_uncertain_point_coords_with_randomness

# Change number of points to select
num_points = 14 * 14
# Change randomness parameters
oversample_ratio = 3  # `k` in the paper
importance_sample_ratio = 0.75  # `\beta` in the paper

with torch.no_grad():
  # We take predicted classes, whereas during real training ground truth classes are used.
  pred_classes = torch.cat([x.pred_classes for x in detected_instances])

  # Select points given a corse prediction mask
  point_coords = get_uncertain_point_coords_with_randomness(
    mask_coarse_logits,
    lambda logits: calculate_uncertainty(logits, pred_classes),
    num_points=num_points,
    oversample_ratio=oversample_ratio,
    importance_sample_ratio=importance_sample_ratio
  )

  H, W = mask_coarse_logits.shape[-2:]
  plot_mask(
    mask_coarse_logits[instance_idx, category_idx].to("cpu"),
    title="Sampled points over the coarse prediction",
    point_coords=(
      W * point_coords[instance_idx, :, 0].to("cpu") - 0.5,
      H * point_coords[instance_idx, :, 1].to("cpu") - 0.5
    ),
    point_marker_size=50
  )
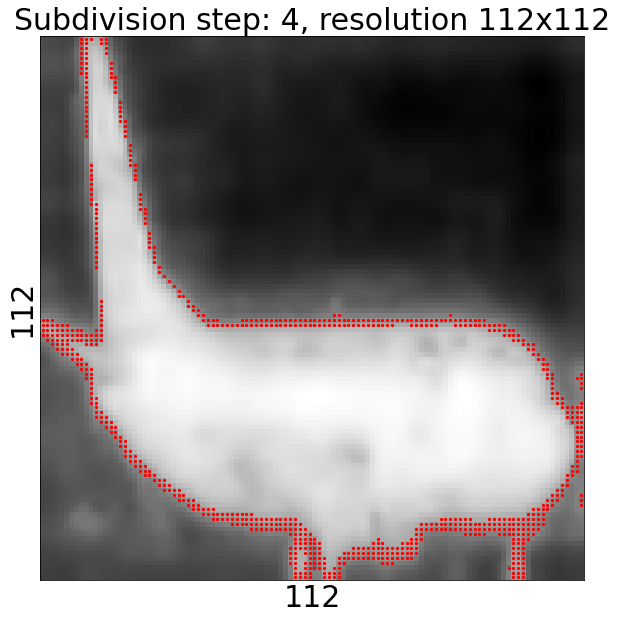
推論時のポイントサンプリング
7x7の粗い予測から始めて、それをnum_subdivision_steps回バイリニアアップサンプリングします。各ステップでnum_subdivision_pointsの最も不確実な点を見つけ、PointRendヘッドを使用してそれらの点の予測を行う。詳細は論文中の3.1節を参照。
num_subdivision_steps と num_subdivision_points パラメータを変更することで、推論の振る舞いを変更することができます。
from detectron2.layers import interpolate
from detectron2.projects.point_rend.mask_head import calculate_uncertainty
from detectron2.projects.point_rend.point_features import (
    get_uncertain_point_coords_on_grid,
    point_sample,
    point_sample_fine_grained_features,
)

num_subdivision_steps = 5
num_subdivision_points = 28 * 28


with torch.no_grad():
  plot_mask(
      mask_coarse_logits[0, category_idx].to("cpu").numpy(),
      title="Coarse prediction"
  )

  mask_logits = mask_coarse_logits
  for subdivions_step in range(num_subdivision_steps):
    # Upsample mask prediction
    mask_logits = interpolate(
        mask_logits, scale_factor=2, mode="bilinear", align_corners=False
    )
    # If `num_subdivision_points` is larger or equalt to the
    # resolution of the next step, then we can skip this step
    H, W = mask_logits.shape[-2:]
    if (
      num_subdivision_points >= 4 * H * W
      and subdivions_step < num_subdivision_steps - 1
    ):
      continue
    # Calculate uncertainty for all points on the upsampled regular grid
    uncertainty_map = calculate_uncertainty(mask_logits, pred_classes)
    # Select most `num_subdivision_points` uncertain points
    point_indices, point_coords = get_uncertain_point_coords_on_grid(
        uncertainty_map,
        num_subdivision_points
    )

    # Extract fine-grained and coarse features for the points
    fine_grained_features, _ = point_sample_fine_grained_features(
      mask_features_list, features_scales, pred_boxes, point_coords
    )
    coarse_features = point_sample(mask_coarse_logits, point_coords, align_corners=False)

    # Run PointRend head for these points
    point_logits = model.roi_heads.mask_head.point_head(fine_grained_features, coarse_features)

    # put mask point predictions to the right places on the upsampled grid.
    R, C, H, W = mask_logits.shape
    x = (point_indices[instance_idx] % W).to("cpu")
    y = (point_indices[instance_idx] // W).to("cpu")
    point_indices = point_indices.unsqueeze(1).expand(-1, C, -1)
    mask_logits = (
      mask_logits.reshape(R, C, H * W)
      .scatter_(2, point_indices, point_logits)
      .view(R, C, H, W)
    )
    plot_mask(
      mask_logits[instance_idx, category_idx].to("cpu"),
      title="Subdivision step: {}".format(subdivions_step + 1),
      point_coords=(x, y)
    )

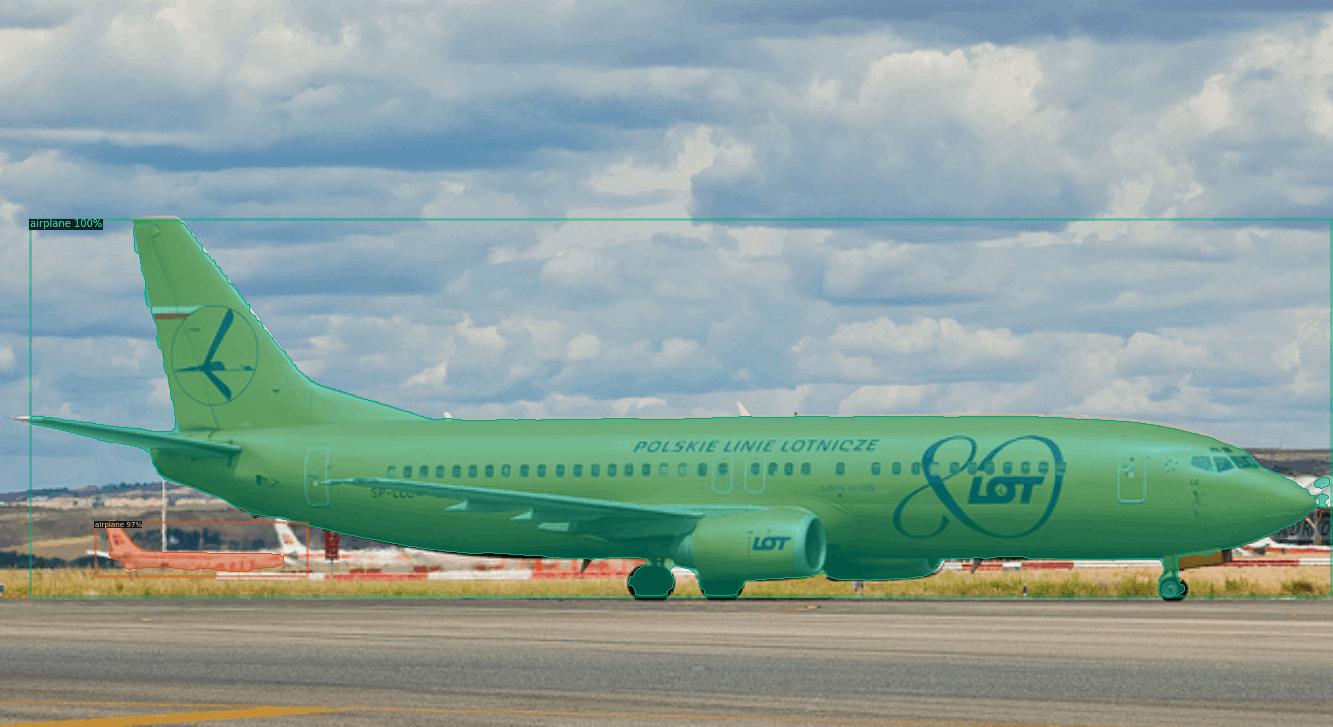
前のブロックで得られたマスク予測値を可視化することができます。
from detectron2.modeling import GeneralizedRCNN
from detectron2.modeling.roi_heads.mask_head import mask_rcnn_inference

results = detected_instances
mask_rcnn_inference(mask_logits, results)
results = GeneralizedRCNN._postprocess(results, batched_inputs, images.image_sizes)[0]

# We can use `Visualizer` to draw the predictions on the image.
v = Visualizer(im_transformed[:, :, ::-1], coco_metadata)
v = v.draw_instance_predictions(results["instances"].to("cpu"))
cv2_imshow(v.get_image()[:, :, ::-1])
Discussion