無料でBell不等式を破る
TL,DR
IBMQのOpen Planを使ってCHSH-Bell不等式を一ヶ月に36回くらい破れます。
CHSH-Bell不等式
4つの確率変数
ここで、次のような量を考える。添字してあるように、この変数を2群(
もし、古典的確率モデルであれば次のような計算ができる。
が言える。ここでの計算は、古典系だからこそ成り立つ変形が含まれていることに注意。あとで量子論でこれを破るにあたって、この計算のどこが量子論では破綻するのかを観察しよう。
ここで言えたことは、次である:どのような4変数の2値古典確率モデルであっても、それを
量子論はこれを破ることができる。すなわち、4変数の2値量子的確率モデルで、それを
EPR状態での計算
Qビットを2つ用意する。このときの合成スピン0状態はEPR状態とよばれ、次である。
ここで、
ここから、それぞれのビットで、さまざまな方向のスピンを測定することを考える。パウリ行列とその回転を考えると、先のセッティングと同様にとりえる値が
なので
したがって、4つの量子確率変数をパウリ行列を使って
とおくと、
ここで、
量子論の抜け道
まず「4つの確率変数を考える」と言ったが、ここで一つの罠がある。古典確率論で確率変数を考えるとき、それはいくつであっても「同時に観測できる」。例えば今回のセッティングでは
ところが、量子論で作ったモデルでは実は
統計的検証
CHSHが破れる可能性があることはわかったが、これは確率試行なので、統計的に判断することになる。つまり、
量子系では同時に観測できないから、EPR状態を
- 4つの群それぞれの中では独立同分布
- 有界な確率変数なので平均も分散も存在するが、未知
ここでやりたいことは、
説明のために、
としよう。また
添字
を考えよう。
となる。また、
と変形できる。 二項分布
したがって、
と正規分布に漸近する。さらに、
も言える。
さて、このふるまいは
という量を考えると、スラツキーの定理から
と正規分布に漸近する。つまり、
とすれば、十分大きな
そこで、標準正規分布の両側棄却域の境界を
と構成できる。これが
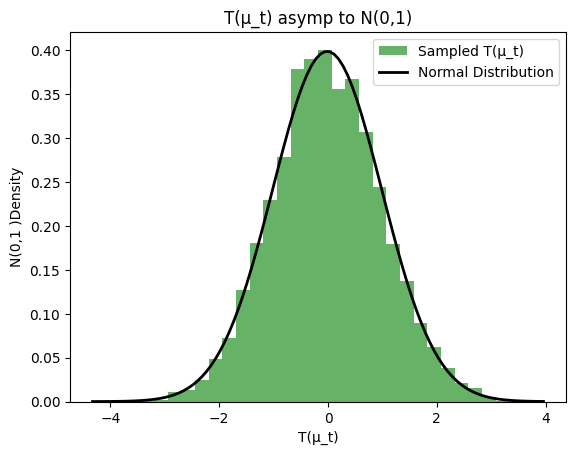
統計量の動作チェック
本当にこれが4種類の2値確率変数の平均和の信頼区間になるのか?一応チェックしてみよう。colabを開いて次をコピペする。
import numpy as np
import matplotlib.pyplot as plt
from scipy.stats import norm

# サンプル数
N = 1000
# iの範囲
i_values = range(1, 5)
# シミュレーション回数
num_simulations = 10000
# 期待値4つ
mu_values = [0.2, -0.1, 0.3, -0.2]
mu_t = sum(mu_values)

# W_iを二項分布サンプルから換算
def calculate_Wi(n_i_plus, N):
    return (n_i_plus - (N - n_i_plus)) / N

# T(μ_t)のサンプリング
def simulate_T_distribution(N, mu_values, mu_t, num_simulations):
    T_values = []
    for _ in range(num_simulations):
        nom = []
        den = []

        for mu_i in mu_values:
            p_i = (1 + mu_i) / 2
            n_i_plus = np.random.binomial(N, p_i)  # W_ijは2値なので二項分布サンプリングで代用
            W_i = calculate_Wi(n_i_plus, N)
            nom.append(W_i)
            den.append(1-W_i**2)

        T_values.append(np.sqrt(N)*(np.sum(nom) - mu_t)/np.sqrt(np.sum(den)))

    return T_values

# プロット
def plot_T_distribution(T_values):
    # T(μ_t)のヒストグラム
    plt.hist(T_values, bins=30, density=True, alpha=0.6, color='g', label="Sampled T(μ_t)")

    # 正規分布。これに近いならOK
    mu, std = norm.fit(T_values)
    xmin, xmax = plt.xlim()
    x = np.linspace(xmin, xmax, 100)
    p = norm.pdf(x, mu, std)
    plt.plot(x, p, 'k', linewidth=2, label="Normal Distribution")

    plt.legend()
    plt.title("T(μ_t) asymp to N(0,1)")
    plt.xlabel("T(μ_t)")
    plt.ylabel("N(0,1)Density")
    plt.show()

T_values = simulate_T_distribution(N, mu_values, mu_t, num_simulations)
plot_T_distribution(T_values)
これで先の

ちゃんと正規漸近してそうだ。ということ先の信頼区間はとりあえず
qiskitで書く
もともとQ# + Azure Quantumで動かしたかったのだが、なんか無限サインアップ失敗で開始出来なかったので萎えてしまった。無料枠のある量子計算機実機として他にqiskit + IBMQがあるのでこれを動かそう。
しかしqiskit + qiskit-ibm-runtimeもバージョン互換性でエラーを出しまくり厳しい気持ちになった。qiskitは1.0.0前後で挙動が変わっており、qiskit-ibm-runtimeはV1/V2が共存状態にあり、二重に厳しい。
IBMのお世話になる前に、qiskitにAERというエミュレータがあるようだ。これも一応colabで動かせる。パッケージ依存解決で辛い気持ちになったのでバージョン指定してインスコする。
!pip install --upgrade pip
!pip install qiskit==1.1.2 qiskit-ibm-runtime==0.27.0 qiskit-aer==0.14.2
うまくいったらqiskitで回路を組み、AERでシミュレーションをする。qiskitで組んだ回路はトランスパイルすればエミュレータと実機どちらでもオブジェクトレベルで使い回せるようだ。
from qiskit import QuantumCircuit,transpile
from qiskit_aer import AerSimulator
import math
from scipy.stats import norm

class Vec3:
    def __init__(self, x, y, z):
        self.x = x
        self.y = y
        self.z = z

# 測定方向に対応する逆回転
def revRotate(circuit:QuantumCircuit,bitIdx,vec:Vec3):
    len = (vec.x ** 2 + vec.y ** 2 + vec.z ** 2)**0.5
    theta = math.acos(vec.z / len)
    phi = math.atan2(vec.y , vec.x)
    circuit.rz(-phi,bitIdx)
    circuit.ry(-theta,bitIdx)
    return circuit

# EPR測定する回路をコンパイルして得る
def genEPRCircuit(n:Vec3,m:Vec3,simulator):
    # createEPR
    circuit = QuantumCircuit(2,2) # |00>
    circuit.h(0) # |10>+|01>
    circuit.cx(0, 1) # |11> + |00>
    circuit.y(1) # -|10> + |01>
    # rotate
    circuit = revRotate(circuit=circuit,bitIdx=0,vec=n)
    circuit = revRotate(circuit=circuit,bitIdx=1,vec=m)
    circuit.measure([0, 1], [0, 1])
    return transpile(circuit, simulator)

# シミュレータ取得
simulator = AerSimulator()

# 測定方向(2√2狙い設定)
n_a = Vec3(1,0,0)
m_a = Vec3(0,1,0)
n_b = Vec3(-1,-1,0)
m_b = Vec3(1,-1,0)

# 実験回数
N = 1000

# 4つのセッティング
qc_1 = genEPRCircuit(n_a,n_b,simulator)
qc_2 = genEPRCircuit(m_a,n_b,simulator)
qc_3 = genEPRCircuit(n_a,m_b,simulator)
qc_4 = genEPRCircuit(m_a,m_b,simulator)

# これはあとで流用する。
circuits = [qc_1,qc_2,qc_3,qc_4]

# 実行(AERシミュレータ)
result = simulator.run([qc_1,qc_2,qc_3,qc_4], shots=N).result()

# 各回路の結果を取得して表示
def extractData(result):
    data = []
    for i, qc in enumerate(circuits):
        counts = result.get_counts(qc)
        data.append(counts) # 格納
        print(f"Result for circuit {i+1}: {counts}")
    return data

# データが件数で来るのでX_iへ整形する
def aggregateData(data):
    x = []
    for i,datum in enumerate(data):
        same = datum.get('11',0) + datum.get('00',0)
        diff = datum.get('10',0) + datum.get('01',0)
        total = same+diff
        if i == 2: #3番目の設定はマイナスでカウントする
            x.append((diff - same)/total)
        else:
            x.append((same - diff)/total)
    return x

# 信頼区間幅計算
def confidence(xs,alpha,n):
    bound = norm.ppf(1 - alpha / 2)
    s = 0
    for x in xs:
        s = s + 1 - x**2
    return bound * math.sqrt(s/n)

alpha = 0.01
x = aggregateData(extractData(result))
print(f"S= {sum(x)}±{confidence(x,alpha,N)} with level {alpha}")
Result for circuit 1: {'01': 86, '10': 67, '00': 408, '11': 439}
Result for circuit 2: {'01': 59, '11': 435, '10': 71, '00': 435}
Result for circuit 3: {'00': 75, '10': 424, '01': 419, '11': 82}
Result for circuit 4: {'01': 82, '10': 76, '00': 410, '11': 432}
S= 2.8040000000000003±0.11612140190772166 with level 0.01
信頼区間の水準は1%にした。しっかり2を超えているが、これはシミュレータなので喜ぶのはまだ早い。
ibmqを使う
次はqiskit-ibm-runtimeを使う。こちらはSamplerとかいうやつで動かすようだ。ほかにもあるようだが、FakeAlmadenV2()をbackendに指定するとこれもまたエミュレータで動作する。
from qiskit_ibm_runtime import SamplerV1 as Sampler
from qiskit_ibm_runtime.fake_provider import FakeAlmadenV2
from qiskit_ibm_runtime import QiskitRuntimeService

def fakeSample(circuits,N):
    backend = FakeAlmadenV2()
    sampler = Sampler(backend=backend) # 警告消えないが動きはする。
    transpiled_circuits = transpile(circuits, backend=backend) # circuitはさっきの回路流用。トランスパイル
    job = sampler.run(circuits=transpiled_circuits, shots=N)
    result = job.result()
    return result

N_fake = 1000

result_fake = fakeSample(circuits,N_fake)
print(result_fake)
<ipython-input-58-1e373f292f43>:7: DeprecationWarning: The Sampler and Estimator V1 primitives have been deprecated as of qiskit-ibm-runtime 0.23.0 and will be removed no sooner than 3 months after the release date. Please use the V2 Primitives. See the `V2 migration guide <https://docs.quantum.ibm.com/migration-guides/v2-primitives>`_. for more details
  sampler = Sampler(backend=backend) # 警告消えないが動きはする。
SamplerResult(quasi_dists=[{1: 0.064, 3: 0.424, 2: 0.065, 0: 0.447}, {1: 0.064, 2: 0.069, 0: 0.42, 3: 0.447}, {1: 0.408, 3: 0.077, 0: 0.077, 2: 0.438}, {1: 0.067, 2: 0.07, 0: 0.426, 3: 0.437}], metadata=[{'shots': 1000}, {'shots': 1000}, {'shots': 1000}, {'shots': 1000}])
deprecatedだからSamplerをV2にしろ的なことを言われるが、V2の使い方がresultの互換性無い(?)上になんもわからんかったので無視する。あとなんかそのものズバリのEstimetorとかがあるらしいが何もわからない。分かる人はそっち使ったほうがライブラリがよろしくやってくれると思います。
quasi_distsに結果が生えているが、AERと違ってキーが数字に換算されてる + 数値が件数じゃなくて割合になってしまっているので集計し直す。
# AERと結果の形式が違うのでもっかい定義。X_iを取得
def aggregateData2(result):
    x = []
    for i,datum in enumerate(result):
        same = datum.get(3,0) + datum.get(0,0) # caseじゃなくて割合で入ってる。
        diff = datum.get(2,0) + datum.get(1,0)
        total = same+diff
        if i == 2: #3番目の設定はマイナスでカウントする
            x.append(diff - same) # 割合で来てるのでNで割らなくてよい。
        else:
            x.append(same - diff)
    return x
x_fake = aggregateData2(result_fake.quasi_dists)
print(f"S= {sum(x_fake)}±{confidence(x_fake,alpha,N_fake)} with level {alpha}")
S= 2.868±0.113520161073844 with level 0.01
破れているがこれもシミュレータなので喜ぶのはまだ早い。
いよいよ実機だ。IBM Quantumにサインアップ(クレジットカードなどは不要!)すると、Open Planというのが使えるようになり、一ヶ月に10分間QPUを利用できる。
まずサインアップする。それからアカウントページ に行くと、Instanceのところのibm-q/open/mainのところにすでにインスタンスがある。これがOpen Planで使える。縦ドットのメニューを押すとCopy quskit-ibm-runtime codeとご親切にスニペットが取れるのでこれを使う。
その上に API tokenの欄があるのでこれもとっておく。もちろんAPI tokenは共有しないようにする。colab上シークレットにtokenを登録してノートブックアクセス許可をしておく。シークレットの名前は適当につけて。
それ以外はFakeのときと同じようにする。
# 実機でいく
from google.colab import userdata

def actualSample(circuits,N):
    service = QiskitRuntimeService(
        channel='ibm_quantum',
        instance='ibm-q/open/main',
        token=userdata.get('IBMQOPEN') # colabのシークレット機能を使う場合。
    )
    backend = service.least_busy(min_num_qubits=2)
    sampler = Sampler(backend=backend)
    transpiled_circuits = transpile(circuits, backend=backend)
    job = sampler.run(circuits=transpiled_circuits, shots=N)
    result = job.result()
    return result

# 1000件×4
N_actual = 1000

result_actual = actualSample(circuits,N_actual)
print(result_actual)
実行は結構かかるが、大半は待機時間で、実際の実行時間は数十秒だ。怖い人は件数減らしてやってみてください。ぶっちゃけ件数はあまり実行時間について支配的でない気がする。10件でも100件でも1000件でも約16秒かかっていた。
<ipython-input-60-fccfef86b25f>:12: DeprecationWarning: The Sampler and Estimator V1 primitives have been deprecated as of qiskit-ibm-runtime 0.23.0 and will be removed no sooner than 3 months after the release date. Please use the V2 Primitives. See the `V2 migration guide <https://docs.quantum.ibm.com/migration-guides/v2-primitives>`_. for more details
  sampler = Sampler(backend=backend)
SamplerResult(quasi_dists=[{2: 0.066604178256729, 3: 0.409572700261668, 0: 0.452914698551763, 1: 0.070908422929839}, {2: 0.079532501696869, 3: 0.39868402763331, 0: 0.447477172132427, 1: 0.074306298537395}, {2: 0.433596657765075, 3: 0.058897427247571, 0: 0.078431422022615, 1: 0.42907449296474}, {2: 0.073539925194667, 3: 0.466885953894833, 0: 0.391403144747975, 1: 0.068170976162525}], metadata=[{'shots': 1000, 'circuit_metadata': {}, 'readout_mitigation_overhead': 1.2755904154859747, 'readout_mitigation_time': 0.02340060006827116}, {'shots': 1000, 'circuit_metadata': {}, 'readout_mitigation_overhead': 1.2755904154859747, 'readout_mitigation_time': 0.10359275806695223}, {'shots': 1000, 'circuit_metadata': {}, 'readout_mitigation_overhead': 1.2755904154859747, 'readout_mitigation_time': 0.10209951363503933}, {'shots': 1000, 'circuit_metadata': {}, 'readout_mitigation_overhead': 1.2755904154859747, 'readout_mitigation_time': 0.10887717548757792}])
V2にしろ警告は無視します。
実際にQPUが稼働するとアカウントページでMonthly usageのゲージが変化する。

そして信頼区間をだす。
x_actual = aggregateData2(result_actual.quasi_dists)
print(f"S= {sum(x_actual)}±{confidence(x_actual,alpha,N_actual)} with level {alpha}")
S= 2.8592176959035807±0.11390570772586445 with level 0.01
よし!
量子系はありまぁす!
Discussion