【簡単】Streamlit でデータ可視化アプを開発
はじめに
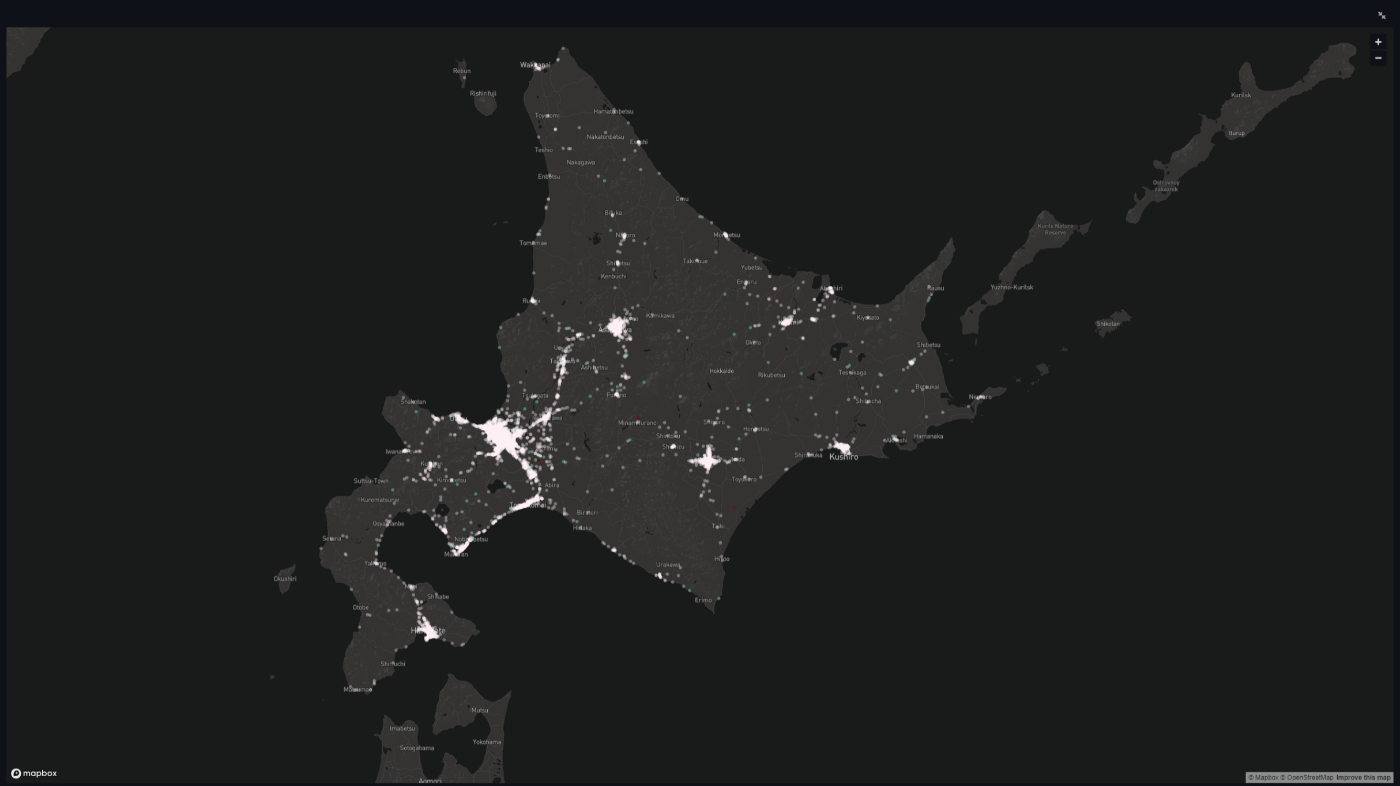
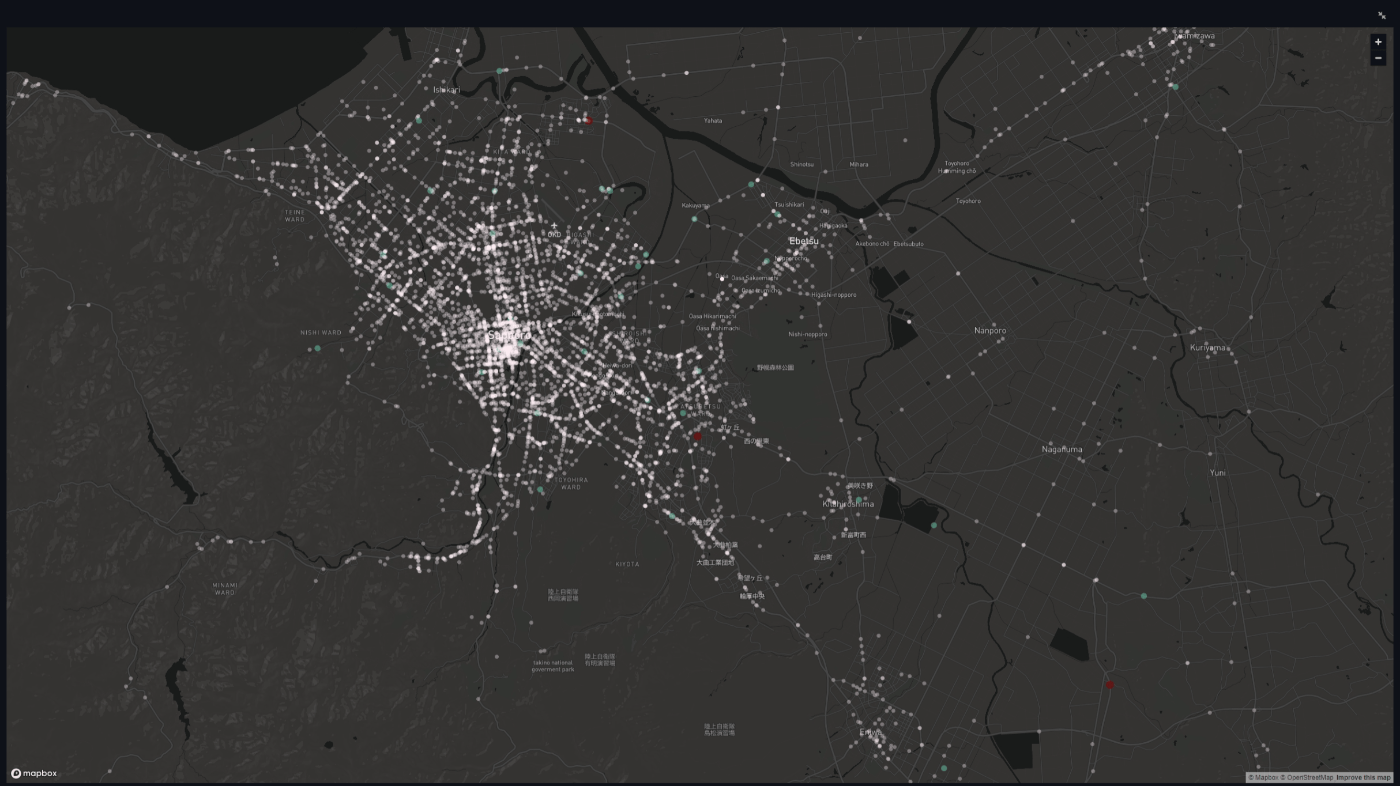
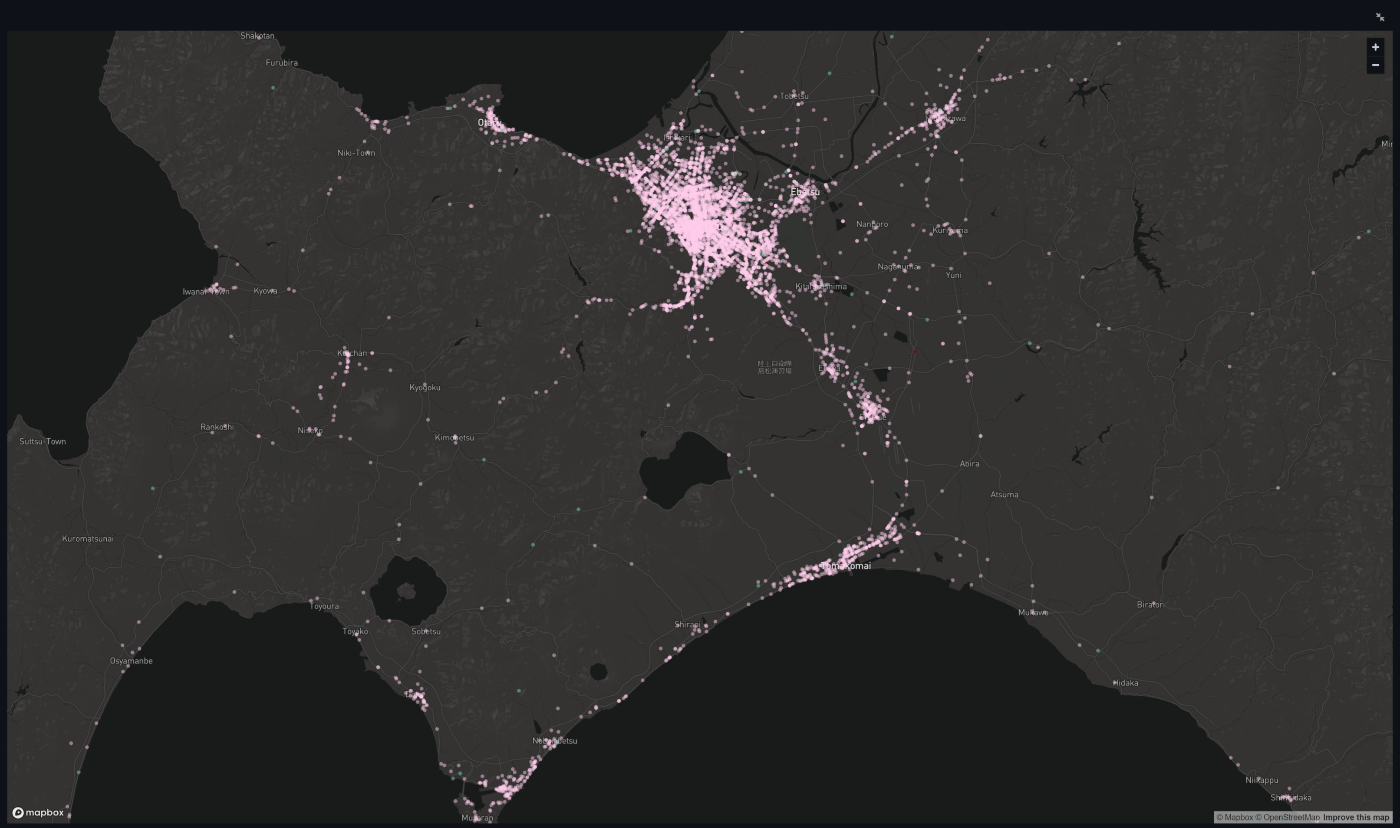
交通事故を可視化したマップです。
北海道の統計
| 年度 | 件数 | 死者数 | 負傷者数 |
|---|---|---|---|
| 2019 | 9595 | 152 | 11046 |
| 2020 | 7898 | 144 | 9043 |
| 2021 | 8304 | 120 | 9598 |
| 2022 | 8457 | 115 | 9785 |
| 2023 | 9082 | 131 | 10601 |
オープンデータとして公開されている 2019 年からのデータを簡単な表にしたのですが、多いですね……。お互い安全運転を心がけましょう…………。
というわけで、このデータと Streamlit の st.map を使って地図にプロットしたいと思います。
データは以下からダウンロードできます。
CSV ファイルを読み込む
CSV ファイルを読み込む部分は一度作ったら使いまわしできるかと思います。
import numpy as np
import pandas as pd
import streamlit as st
from streamlit.delta_generator import DeltaGenerator
from streamlit.runtime.uploaded_file_manager import UploadedFile

st.set_page_config(
    page_title="st.map",
    page_icon="🌏",
    layout="wide",
    initial_sidebar_state="expanded",
)


def get_data(csv_file: UploadedFile) -> pd.DataFrame:
    """Read CSV file

    Args:
        csv_file (UploadedFile): Up file

    Returns:
        pd.DataFrame: DataFrame
    """
    try:
        return pd.read_csv(csv_file)
    except UnicodeDecodeError:
        st.error("ファイルのエンコードは Utf-8 のみ有効です。")
        st.stop()


with st.expander("README"):
    st.info(
        """
        1. ファイルを読み込む
        1. 「データフレームの編集」を開いて、緯度・経度のあるカラム名を「lat」「lon」に変更
        1. 「Generate new points」ボタンをクリック
        1. Separate ヘッダーのパラメーターを変更
        1. 「Update map」ボタンをクリック
        """
    )

upload_file: UploadedFile | None = st.file_uploader("Choose a file")

if upload_file is not None:
    df: pd.DataFrame = get_data(upload_file)

    if not ("lat" in df.columns and "lon" in df.columns):
        with st.expander("データフレームの編集"):
            st.info(
                "緯度・経度のあるカラム名を「lat」「lon」に書き換えると、表示できます。"
            )
            st.dataframe(df)

            # カラム名の編集フィールド
            df.columns = [
                st.text_input(f"{col} の新しい名前", value=col) for col in df.columns
            ]

if st.button("Generate new points", type="primary"):
    st.session_state.df = df

if "df" not in st.session_state:
    st.stop()

if not ("lat" in st.session_state.df.columns and "lon" in st.session_state.df.columns):
    st.error("カラム名に「lat」「lon」が存在しません。")
    st.info("「データフレームの編集」を開いてカラム名を変更してください。")
    st.stop()

df = st.session_state.df
とりあえずこんな感じ。汎用性が高くなるように、読み込んだファイルのカラム名に「lat」「lon」がなかったらカラム名を編集するフィールドを表示して手動で変更できるようにしています。Shift-JIS は全く使用する気がないので考慮していません。
-
「lat」「lon」

-
「Generate new points」をクリックして
st.session_stateに割り当てます。
フォームを使用する
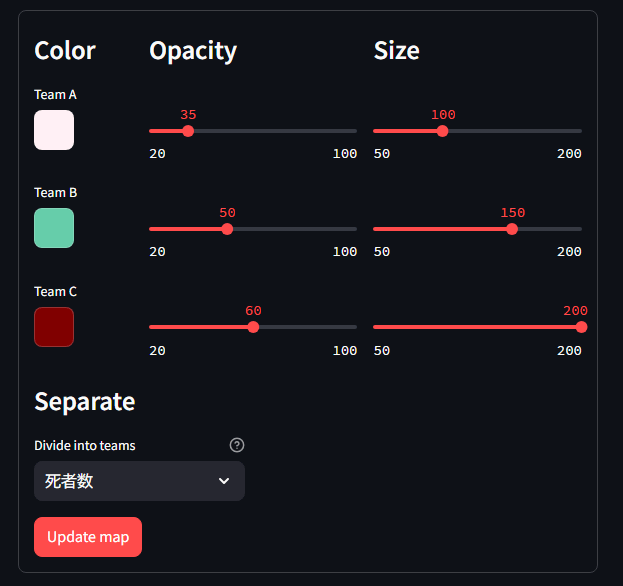
st.formを使用してマップのパラメーターを設定します。
次の例では、ユーザーは複数のパラメーターを設定してマップを更新できます。ユーザーがパラメーターを変更しても、スクリプトは再実行されず、マップは更新されません。ユーザーが [マップの更新] というラベルの付いたボタンを使用してフォームを送信すると、スクリプトが再実行され、マップが更新されます。
単純にrowを追加した。
with st.form("map_form"):
    header: list[DeltaGenerator] = st.columns([1, 2, 2])
    header[0].subheader("Color")
    header[1].subheader("Opacity")
    header[2].subheader("Size")

    row1: list[DeltaGenerator] = st.columns([1, 2, 2])
    colorA = row1[0].color_picker("Team A", "#fff0f5")
    opacityA = row1[1].slider("A opacity", 20, 100, 35, label_visibility="hidden")
    sizeA = row1[2].slider("A size", 50, 200, 100, step=10, label_visibility="hidden")

    row2: list[DeltaGenerator] = st.columns([1, 2, 2])
    colorB = row2[0].color_picker("Team B", "#66cdaa")
    opacityB = row2[1].slider("B opacity", 20, 100, 50, label_visibility="hidden")
    sizeB = row2[2].slider("B size", 50, 200, 150, step=10, label_visibility="hidden")

    row3: list[DeltaGenerator] = st.columns([1, 2, 2])
    colorC = row3[0].color_picker("Team C", "#800000")
    opacityC = row3[1].slider("C opacity", 20, 100, 60, label_visibility="hidden")
    sizeC = row3[2].slider("C size", 50, 200, 200, step=10, label_visibility="hidden")

    header: list[DeltaGenerator] = st.columns([2, 3])
    header[0].subheader("Separate")

    row4: list[DeltaGenerator] = st.columns([2, 3])
    target = row4[0].selectbox(
        "Divide into teams",
        df.columns.to_list(),
        help="数値でチームを分けます。A: 0, B: 1, C: more",
    )

    st.form_submit_button("Update map", type="primary")

alphaA = int(opacityA * 255 / 100)
alphaB = int(opacityB * 255 / 100)
alphaC = int(opacityC * 255 / 100)

df["color"] = np.where(
    df[target] == 0,
    colorA + f"{alphaA:02x}",
    np.where(df[target] == 1, colorB + f"{alphaB:02x}", colorC + f"{alphaC:02x}"),
)

df["size"] = np.where(df[target] == 0, sizeA, np.where(df[target] == 1, sizeB, sizeC))
まとめた。
def create_team_row(
    team_name: str, default_color: str, default_opacity: int, default_size: int
) -> tuple[str, int, int]:
    """
    st.map の設定アイテム

    Args:
        team_name (str): チーム名
        default_color (str): 既定色
        default_opacity (int): 透明度
        default_size (int): サイズ

    Returns:
        tuple[str, Any, Any]: カラー、透明度、サイズ
    """
    row: list[DeltaGenerator] = st.columns([1, 2, 2])
    return (
        row[0].color_picker(team_name, default_color),
        row[1].slider("Opacity", 20, 100, default_opacity, label_visibility="hidden"),
        row[2].slider(
            "Size",
            50,
            200,
            default_size,
            step=10,
            label_visibility="hidden",
        ),
    )


with st.form("map_form"):
    header: list[DeltaGenerator] = st.columns([1, 2, 2])
    header[0].subheader("Color")
    header[1].subheader("Opacity")
    header[2].subheader("Size")

    colorA, opacityA, sizeA = create_team_row("Team A", "#fff0f5", 35, 100)
    colorB, opacityB, sizeB = create_team_row("Team B", "#66cdaa", 50, 150)
    colorC, opacityC, sizeC = create_team_row("Team C", "#800000", 60, 200)

    header = st.columns([2, 3])
    header[0].subheader("Separate")

    row4: list[DeltaGenerator] = st.columns([2, 3])
    target: str | None = row4[0].selectbox(
        "Divide into teams",
        [col for col in df.columns if "数" in col],
        # 値の型で判断するなら
        # [col for col in df.columns if df[col].dtype == "int64"],
        help="数値でチームを分けます。A: 0, B: 1, C: more",
    )

    st.form_submit_button("Update map", type="primary")

alphaA = int(opacityA * 255 / 100)
alphaB = int(opacityB * 255 / 100)
alphaC = int(opacityC * 255 / 100)

df["color"] = np.where(
    df[target] == 0,
    colorA + f"{alphaA:02x}",
    np.where(df[target] == 1, colorB + f"{alphaB:02x}", colorC + f"{alphaC:02x}"),
)

df["size"] = np.where(
    df[target] == 0, sizeA, np.where(df[target] == 1, sizeB, sizeC)
)
表示
マップの表示を試して、ダメだったら何も表示しない。
try:
    st.map(df, size="size", color="color")
except Exception:
    st.stop()
ボタンをクリックしたときに表示させる場合はこんな感じかな。
if st.button("マップを表示"):
    st.map(df, size="size", color="color")

補足
デフォルトのままで何もしなくてもマップの表示はできるのですが、別途 Mapbox のトークンを作成して使用することが推奨されています。
Mapbox は、ユーザーがマップタイルをリクエストする前に、ユーザー登録とトークンの提供を要求します。現在、Streamlit がこのトークンを提供していますが、これはいつでも変更される可能性があります。私たちは、ユーザー体験の中断を避けるために、すべてのユーザーが自分自身の個人的な Mapbox トークンを作成し、使用することを強くお勧めします。これは mapbox.token config オプションで行うことができます。Mapbox の使用は Mapbox の利用規約によって管理されます。
自分用のトークンを取得するには、https://mapbox.com でアカウントを作成してください。コンフィグオプションの設定方法の詳細については、https://docs.streamlit.io/develop/api-reference/configuration/config.toml。
DeepL.com(無料版)で翻訳しました。
以下のディレクトリにconfig.tomlを作成し、Mapbox のページから新しく作成したパブリックトークンを設定する
your-project/
├─ .streamlit/
│  └─ config.toml
└─ your_app.py
[mapbox]

# Configure Streamlit to use a custom Mapbox
# token for elements like st.pydeck_chart and st.map.
# To get a token for yourself, create an account at
# https://mapbox.com. It's free (for moderate usage levels)!
# Default: ""
token = ""
Mapbox
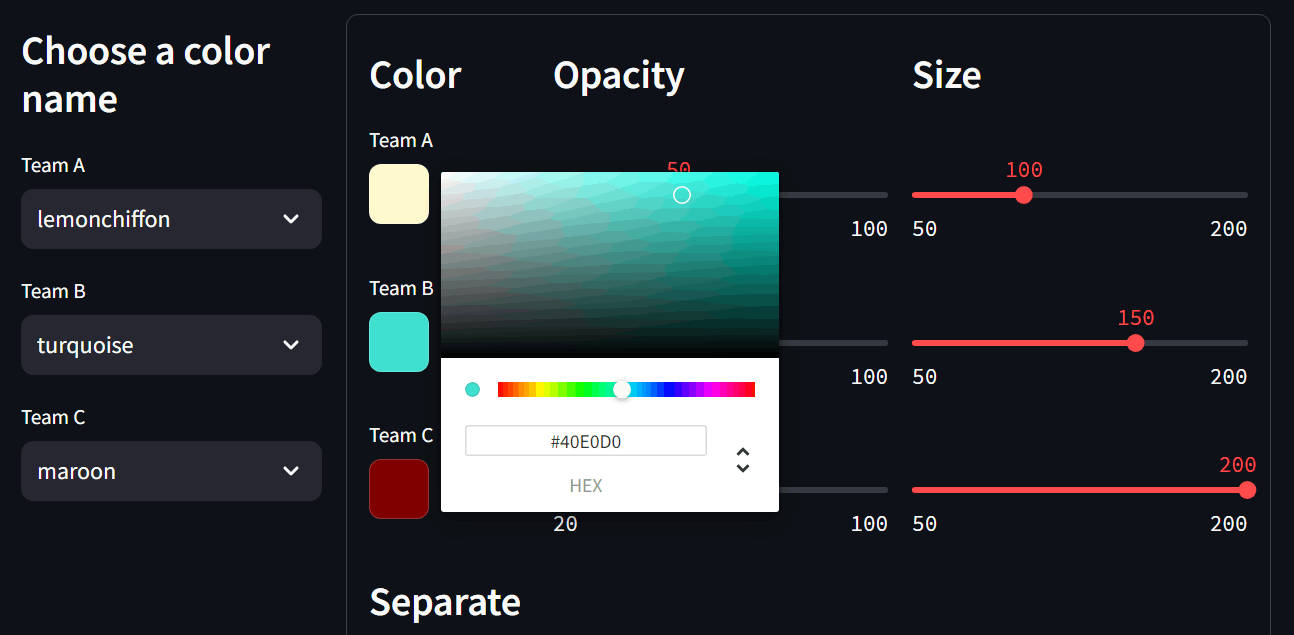
おまけ

おわりに
folium と比べるとあまり凝ったことはできないのですが、これはこれで良い感じです。



Discussion