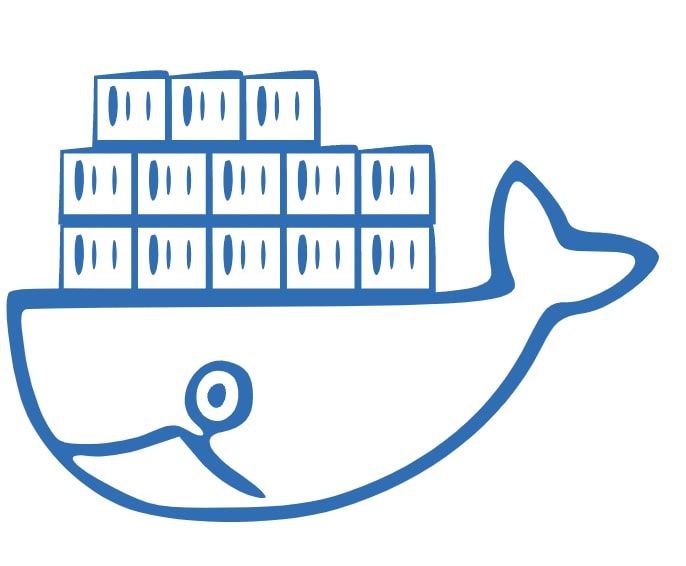
その日のコミット数に応じて増える Docker キャラクターのコンテナ
前回 Gopher くんをベースにその日のコミット数に応じて伸びる Gopher くん svgというのを書き、Docker のキャラクター Moby Dock でも作りたくなったのと、前回は雑に書いたので、Docker バージョンも作ることにしました。
手順
以下の手順で作成していきます。
- ベース画像を取得
- コンテナとクジラの部分を切り出す
- 切り出した画像を svg に変換する
- コンテナを配置する
- 色を変える
- コミット数を取得する
- コードをまとめる
- デプロイ
ベース画像を取得
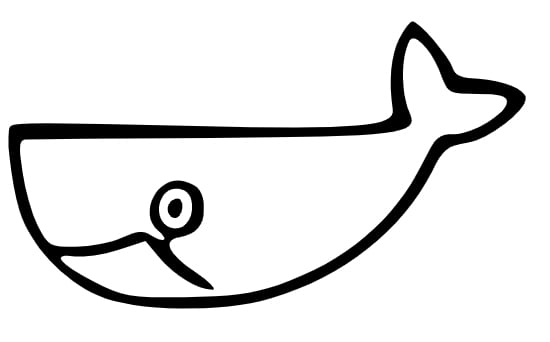
画像は「Docker とは」という AWS の公式ページにあった画像を使わせていただきます。
![]()
コンテナとクジラの部分を切り出す
先ほどの画像からクジラとコンテナを切り出していきます。
この切り出し作業には Mac の標準の画像編集機能を使い、以下の手順で行います。
- 画像をダブルクリック
- 「マークアップツールバーを表示」をクリック
- 「投げなわで選択」をクリック
- 範囲を選択
- 「選択範囲に切り取り」をクリック


切り出した画像を svg に変換する
切り取ったクジラの画像をFree SVG Converterを使い、svg データに変換してダウンロードします。
<!DOCTYPE svg PUBLIC "-//W3C//DTD SVG 20010904//EN" "http://www.w3.org/TR/2001/REC-SVG-20010904/DTD/svg10.dtd">
<svg version="1.0" xmlns="http://www.w3.org/2000/svg" width="99.000000pt" height="60.000000pt" viewBox="0 0 99.000000 60.000000" preserveAspectRatio="xMidYMid meet">
    <metadata>
        Created by potrace 1.10, written by Peter Selinger 2001-2011
    </metadata>
    <g transform="translate(0.000000,60.000000) scale(0.100000,-0.100000)" fill="#000000" stroke="none">
        <path d="M744 528 c-15 -29 -20 -80 -12 -132 5 -32 -62 -38 -367 -31 -292 7 -333 7 -345 0 -11 -7 0 -104 17 -159 20 -64 80 -128 146 -157 68 -30 230 -33 322 -5 135 40 245 127 300 236 21 42 28 48 66 54 40 6 109 59 109 83 0 16 -43 34 -88 36 -31 1 -44 6 -48 20 -7 22 -63 87 -75 87 -5 0 -16 -15 -25 -32z m50 -17 c10 -11 23 -35 29 -53 12 -32 14 -33 67 -33 42 0 55 -4 55 -15 0 -21 -63 -60 -99 -60 -29 0 -35 -6 -59 -55 -51 -105 -144 -183 -268 -226 -50 -17 -89 -22 -175 -23 -104 -1 -114 1 -169 29 -66 34 -81 54 -35 47 16 -2 53 3 80 12 l51 17 26 -31 c27 -33 72 -60 99 -60 9 0 -6 15 -32 33 -51 34 -63 59 -29 65 31 6 45 22 45 51 0 33 -9 46 -37 53 -49 13 -87 -60 -48 -92 21 -18 11 -24 -13 -9 -16 10 -26 9 -55 -4 -19 -9 -58 -17 -86 -17 -49 0 -51 1 -71 40 -11 22 -24 67 -28 100 -8 51 -6 60 7 60 9 1 165 2 346 3 347 2 386 7 369 45 -13 30 -16 71 -10 107 8 40 16 43 40 16z m-436 -292 c3 -29 -18 -52 -41 -43 -36 14 -22 78 16 72 15 -2 23 -11 25 -29z"/>
        <path d="M315 220 c-8 -13 4 -32 16 -25 12 8 12 35 0 35 -6 0 -13 -4 -16 -10z"/>
    </g>
</svg>
同様にコンテナの画像も変換します。
<!DOCTYPE svg PUBLIC "-//W3C//DTD SVG 20010904//EN" "http://www.w3.org/TR/2001/REC-SVG-20010904/DTD/svg10.dtd">
<svg version="1.0" xmlns="http://www.w3.org/2000/svg" width="13.000000pt" height="13.000000pt" viewBox="0 0 13.000000 13.000000" preserveAspectRatio="xMidYMid meet">
    <metadata>
        Created by potrace 1.10, written by Peter Selinger 2001-2011
    </metadata>
    <g transform="translate(0.000000,13.000000) scale(0.100000,-0.100000)" fill="#000000" stroke="none">
        <path d="M65 120 l-50 -5 -1 -55 -2 -55 59 0 59 0 0 57 c0 31 -3 58 -7 60 -5 2 -30 1 -58 -2z m55 -55 l0 -45 -50 0 -50 0 0 45 0 45 50 0 50 0 0 -45z"/>
        <path d="M39 98 c-5 -16 -3 -58 3 -58 4 0 8 14 8 30 0 17 -2 30 -5 30 -3 0 -5 -1 -6 -2z"/>
        <path d="M62 70 c0 -19 2 -27 5 -17 2 9 2 25 0 35 -3 9 -5 1 -5 -18z"/>
        <path d="M92 70 c0 -19 2 -27 5 -17 2 9 2 25 0 35 -3 9 -5 1 -5 -18z"/>
    </g>
</svg>
このデータを Visual Studio Code の拡張機能のLive Serverを使って表示します。
そうすると以下のように表示されます。

コンテナを配置する
切り出したコンテナとクジラを、変数を使っていい感じに配置していきます。
ここから FastAPI を使うのでfastapi, uvicorn, requestsをインストールします。
$ pip3 install fastapi uvicorn requests
コードは以下になります。
実行はuvicorn main:app --reloadです。
import requests
from fastapi import FastAPI, Response


app = FastAPI()


@app.get("/")
async def moby_dock():
    number_of_commit = 13                                                      # 仮のコミット数
    number_of_containers_in_row = 5                                            # クジラの上に乗る一行のコンテナの数
    excess_containers = number_of_commit % number_of_containers_in_row         # 余ったコンテナの数
    number_of_container_rows = number_of_commit // number_of_containers_in_row # コンテナが積み重なった高さ

    y_coordinate_of_the_first_whale = 58                                       # クジラの y 座標
    for _ in range(number_of_container_rows):                                  # コミット数に応じてクジラの y 座標を調整
        y_coordinate_of_the_first_whale += 11

    y_coordinate_of_the_first_container = y_coordinate_of_the_first_whale - 35 # 一行目のコンテナの y 座標
    x_coordinate_of_the_first_container = 8                                    # 一行目のコンテナの x 座標

    # コンテナの svg リテラル
    svg_container = """
    <g transform="translate(%d.000000,%d.000000) scale(0.100000,-0.100000)" fill="#0070b8" stroke="none">
        <path d="M65 120 l-50 -5 -1 -55 -2 -55 59 0 59 0 0 57 c0 31 -3 58 -7 60 -5 2 -30 1 -58 -2z m55 -55 l0 -45 -50 0 -50 0 0 45 0 45 50 0 50 0 0 -45z"/>
        <path d="M39 98 c-5 -16 -3 -58 3 -58 4 0 8 14 8 30 0 17 -2 30 -5 30 -3 0 -5 -1 -6 -2z"/>
        <path d="M62 70 c0 -19 2 -27 5 -17 2 9 2 25 0 35 -3 9 -5 1 -5 -18z"/>
        <path d="M92 70 c0 -19 2 -27 5 -17 2 9 2 25 0 35 -3 9 -5 1 -5 -18z"/>
    </g>
    """

    containers = [] # コンテナを格納する配列

    # コンテナが積み重なった高さの回だけ処理を繰り返す
    for _ in range(number_of_container_rows):
        # クジラの上に乗る一行のコンテナの数だけ処理を繰り返す
        for _ in range(number_of_containers_in_row):
            containers.append(svg_container % (
                x_coordinate_of_the_first_container,
                y_coordinate_of_the_first_container
            ))
            x_coordinate_of_the_first_container += 11

        # 2 行目以降のコンテナ用に座標を調整
        y_coordinate_of_the_first_container -= 11
        x_coordinate_of_the_first_container = 8

    # 余ったコンテナを並べる
    if excess_containers:
        x_coordinate_of_the_first_container = 2 # 一番上の行だけ、初期位置をずらす
        for _ in range(excess_containers):
            x_coordinate_of_the_first_container += 11
            containers.append(svg_container % (
                x_coordinate_of_the_first_container,
                y_coordinate_of_the_first_container
            ))

    # クジラとコンテナのデータ
    content = f"""
    <!DOCTYPE svg PUBLIC "-//W3C//DTD SVG 20010904//EN" "http://www.w3.org/TR/2001/REC-SVG-20010904/DTD/svg10.dtd">
    <svg version="1.0" xmlns="http://www.w3.org/2000/svg" width="99.000000pt" height="{y_coordinate_of_the_first_whale}.000000pt" viewBox="0 0 99.000000 {y_coordinate_of_the_first_whale}.000000">
        <metadata>
            Created by potrace 1.10, written by Peter Selinger 2001-2011
        </metadata>
        <g transform="translate(0.000000,{y_coordinate_of_the_first_whale}.000000) scale(0.100000,-0.100000)" fill="#0070b8" stroke="none">
            <path d="M744 528 c-15 -29 -20 -80 -12 -132 5 -32 -62 -38 -367 -31 -292 7 -333 7 -345 0 -11 -7 0 -104 17 -159 20 -64 80 -128 146 -157 68 -30 230 -33 322 -5 135 40 245 127 300 236 21 42 28 48 66 54 40 6 109 59 109 83 0 16 -43 34 -88 36 -31 1 -44 6 -48 20 -7 22 -63 87 -75 87 -5 0 -16 -15 -25 -32z m50 -17 c10 -11 23 -35 29 -53 12 -32 14 -33 67 -33 42 0 55 -4 55 -15 0 -21 -63 -60 -99 -60 -29 0 -35 -6 -59 -55 -51 -105 -144 -183 -268 -226 -50 -17 -89 -22 -175 -23 -104 -1 -114 1 -169 29 -66 34 -81 54 -35 47 16 -2 53 3 80 12 l51 17 26 -31 c27 -33 72 -60 99 -60 9 0 -6 15 -32 33 -51 34 -63 59 -29 65 31 6 45 22 45 51 0 33 -9 46 -37 53 -49 13 -87 -60 -48 -92 21 -18 11 -24 -13 -9 -16 10 -26 9 -55 -4 -19 -9 -58 -17 -86 -17 -49 0 -51 1 -71 40 -11 22 -24 67 -28 100 -8 51 -6 60 7 60 9 1 165 2 346 3 347 2 386 7 369 45 -13 30 -16 71 -10 107 8 40 16 43 40 16z m-436 -292 c3 -29 -18 -52 -41 -43 -36 14 -22 78 16 72 15 -2 23 -11 25 -29z"/>
            <path d="M315 220 c-8 -13 4 -32 16 -25 12 8 12 35 0 35 -6 0 -13 -4 -16 -10z"/>
        </g>

        {''.join(containers)}
    </svg>
    """

    return Response(content=content, media_type="image/svg+xml")
Response を使う
このサイトのタイトル「レスポンスを直接返す」にあるように、svg であれば svg を返すことができます。
通常の状態で svg を返すと、HTML にラップされたデータになります。
データを渡すにはcontent引数に対象のデータ変数を与えます。
また、svg の場合はmedia_type引数に"image/svg+xml"を与える必要があります。
これは「カスタムレスポンスを返す」を参照してください。
http://127.0.0.1:8000/にアクセスすると、以下のように表示されます。
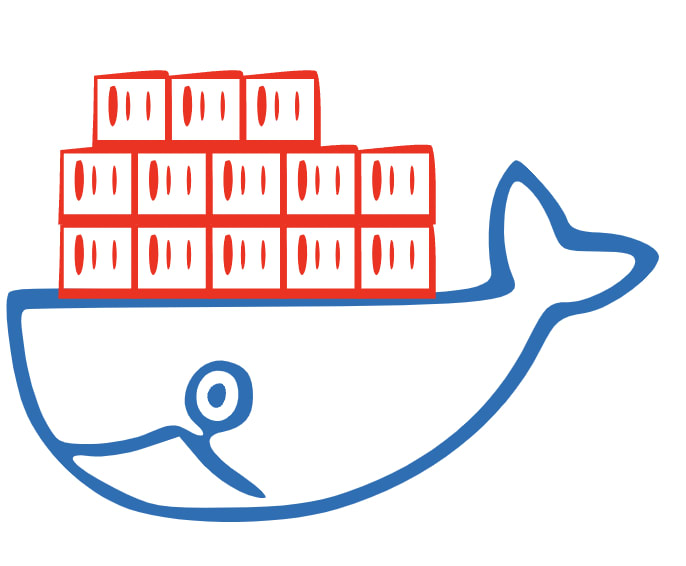
色を変える
色を変更するにはfill="#0070b8"となっているところに、好きな色に指定するだけです。
色の指定には、CSS 同様に「キーワード、カラーコード、RGB、HSL」が使用できます。
試しにコンテナの色を赤に変更してみます。
svg_containerのfillをfill="#0070b8"からfill="%s"に変更し、format の箇所にcolorを追加します。
関数の引数にcolorを追加し、URLに?color=redというクエリ文字パラメータを追加します。
- async def moby_dock():
+ async def moby_dock(color: str = "#0070b8"):

# 省略

- containers.append(svg_container % (x_coordinate_of_the_first_container, y_coordinate_of_the_first_container))
+ containers.append(svg_container % (x_coordinate_of_the_first_container, y_coordinate_of_the_first_container, color))
http://127.0.0.1:8000?color=red
他の svg を返している URL 同様に#を入力せず、111111となるような処理に変更します。
処理には、組み込みのhexdigitsを使います。
+ from string import hexdigits

import requests
from fastapi import FastAPI, Response

# 省略

+ color = "#{color}" if all(c in hexdigits for c in color) else color
ここまでのコード(クジラの色も変更しています)
from string import hexdigits

import requests
from fastapi import FastAPI, Response


app = FastAPI()


@app.get("/")
async def moby_dock(color: str = "0070b8"):
    color = "#{color}" if all(c in hexdigits for c in color) else color

    number_of_commit = 13                                                      # 仮のコミット数
    number_of_containers_in_row = 5                                            # クジラの上に乗る一行のコンテナの数
    excess_containers = number_of_commit % number_of_containers_in_row         # 余ったコンテナの数
    number_of_container_rows = number_of_commit // number_of_containers_in_row # コンテナが積み重なった高さ

    y_coordinate_of_the_first_whale = 58                                       # クジラの y 座標
    for _ in range(number_of_container_rows):                                  # コミット数に応じてクジラの y 座標を調整
        y_coordinate_of_the_first_whale += 11

    y_coordinate_of_the_first_container = y_coordinate_of_the_first_whale - 35 # 一行目のコンテナの y 座標
    x_coordinate_of_the_first_container = 8                                    # 一行目のコンテナの x 座標

    # コンテナの svg リテラル
    svg_container = """
    <g transform="translate(%d.000000,%d.000000) scale(0.100000,-0.100000)" fill="%s" stroke="none">
        <path d="M65 120 l-50 -5 -1 -55 -2 -55 59 0 59 0 0 57 c0 31 -3 58 -7 60 -5 2 -30 1 -58 -2z m55 -55 l0 -45 -50 0 -50 0 0 45 0 45 50 0 50 0 0 -45z"/>
        <path d="M39 98 c-5 -16 -3 -58 3 -58 4 0 8 14 8 30 0 17 -2 30 -5 30 -3 0 -5 -1 -6 -2z"/>
        <path d="M62 70 c0 -19 2 -27 5 -17 2 9 2 25 0 35 -3 9 -5 1 -5 -18z"/>
        <path d="M92 70 c0 -19 2 -27 5 -17 2 9 2 25 0 35 -3 9 -5 1 -5 -18z"/>
    </g>
    """

    containers = [] # コンテナを格納する配列

    # コンテナが積み重なった高さの回だけ処理を繰り返す
    for _ in range(number_of_container_rows):
        # クジラの上に乗る一行のコンテナの数だけ処理を繰り返す
        for _ in range(number_of_containers_in_row):
            containers.append(svg_container % (
                x_coordinate_of_the_first_container,
                y_coordinate_of_the_first_container,
                color
            ))
            x_coordinate_of_the_first_container += 11

        # 2 行目以降のコンテナ用に座標を調整
        y_coordinate_of_the_first_container -= 11
        x_coordinate_of_the_first_container = 8

    # 余ったコンテナを並べる
    if excess_containers:
        x_coordinate_of_the_first_container = 2 # 一番上の行だけ、初期位置をずらす
        for _ in range(excess_containers):
            x_coordinate_of_the_first_container += 11
            containers.append(svg_container % (
                x_coordinate_of_the_first_container,
                y_coordinate_of_the_first_container,
                color
            ))

    # クジラとコンテナのデータ
    content = f"""
    <!DOCTYPE svg PUBLIC "-//W3C//DTD SVG 20010904//EN" "http://www.w3.org/TR/2001/REC-SVG-20010904/DTD/svg10.dtd">
    <svg version="1.0" xmlns="http://www.w3.org/2000/svg" width="99.000000pt" height="{y_coordinate_of_the_first_whale}.000000pt" viewBox="0 0 99.000000 {y_coordinate_of_the_first_whale}.000000">
        <metadata>
            Created by potrace 1.10, written by Peter Selinger 2001-2011
        </metadata>
        <g transform="translate(0.000000,{y_coordinate_of_the_first_whale}.000000) scale(0.100000,-0.100000)" fill="{color}" stroke="none">
            <path d="M744 528 c-15 -29 -20 -80 -12 -132 5 -32 -62 -38 -367 -31 -292 7 -333 7 -345 0 -11 -7 0 -104 17 -159 20 -64 80 -128 146 -157 68 -30 230 -33 322 -5 135 40 245 127 300 236 21 42 28 48 66 54 40 6 109 59 109 83 0 16 -43 34 -88 36 -31 1 -44 6 -48 20 -7 22 -63 87 -75 87 -5 0 -16 -15 -25 -32z m50 -17 c10 -11 23 -35 29 -53 12 -32 14 -33 67 -33 42 0 55 -4 55 -15 0 -21 -63 -60 -99 -60 -29 0 -35 -6 -59 -55 -51 -105 -144 -183 -268 -226 -50 -17 -89 -22 -175 -23 -104 -1 -114 1 -169 29 -66 34 -81 54 -35 47 16 -2 53 3 80 12 l51 17 26 -31 c27 -33 72 -60 99 -60 9 0 -6 15 -32 33 -51 34 -63 59 -29 65 31 6 45 22 45 51 0 33 -9 46 -37 53 -49 13 -87 -60 -48 -92 21 -18 11 -24 -13 -9 -16 10 -26 9 -55 -4 -19 -9 -58 -17 -86 -17 -49 0 -51 1 -71 40 -11 22 -24 67 -28 100 -8 51 -6 60 7 60 9 1 165 2 346 3 347 2 386 7 369 45 -13 30 -16 71 -10 107 8 40 16 43 40 16z m-436 -292 c3 -29 -18 -52 -41 -43 -36 14 -22 78 16 72 15 -2 23 -11 25 -29z"/>
            <path d="M315 220 c-8 -13 4 -32 16 -25 12 8 12 35 0 35 -6 0 -13 -4 -16 -10z"/>
        </g>

        {''.join(containers)}
    </svg>
    """

    return Response(content=content, media_type="image/svg+xml")
コミット数を取得する
まずはトークン呼び出しのためにpython-dotenvをインストールします。
$ pip3 install python-dotenv
次に.envファイルにコミット数の取得のためのトークンを記述しておきます。
トークンの取得はSettings > Developer settings > Personal access tokens > Generate new tokenと進みuser > read:userのチェックボックスを入れて作成していください。
TOKEN_FOR_OBTAINING_CONTRIBUTIONS=***************
その日のコミット数の取得は以下のコードで取得できます。usernameは仮の変数です。
import json
import os

from dotenv import load_dotenv
import requests


load_dotenv()
TOKEN_FOR_OBTAINING_CONTRIBUTIONS = os.getenv("TOKEN_FOR_OBTAINING_CONTRIBUTIONS")
username = "ogty"

headers = {
    "Authorization": f"bearer {TOKEN_FOR_OBTAINING_CONTRIBUTIONS}",
    "Content-Type": "application/json",
}

query = """
query($userName:String!) {
    user(login: $userName){
    contributionsCollection {
        contributionCalendar {
        totalContributions
        weeks {
            contributionDays {
            color
            contributionCount
            contributionLevel
            date
            }
        }
        }
    }
    }
}
"""
variables = '{"userName": "%s"}' % username

body = {
    "query": query,
    "variables": variables
}
response = requests.post(
    "https://api.github.com/graphql",
    headers=headers,
    data=json.dumps(body)
)
json_data = json.loads(response.text)
todays_contributions = json_data["data"]["user"]["contributionsCollection"]["contributionCalendar"]["weeks"][-1]["contributionDays"][-1]["contributionCount"]

print(todays_contributions)
コードをまとめる
「色を変更する」までのコードと「コミット数を取得する」のコードをまとめます。
まとめたことによる変更点は以下です。
- コミット数の取得部分を
get_number_of_commits_todayとして関数化 -
number_of_commitを上記関数から取得 -
usernameをクエリ文字パラメータとして指定 -
Cache-Controlを追加
import json
import os
from string import hexdigits

from dotenv import load_dotenv
from fastapi import FastAPI, Response
import requests


app = FastAPI()
load_dotenv()
TOKEN_FOR_OBTAINING_CONTRIBUTIONS = os.getenv("TOKEN_FOR_OBTAINING_CONTRIBUTIONS")


def get_number_of_commits_today(username: str) -> int:
    headers = {
        "Authorization": f"bearer {TOKEN_FOR_OBTAINING_CONTRIBUTIONS}",
        "Content-Type": "application/json",
    }

    query = """
    query($userName:String!) {
        user(login: $userName){
        contributionsCollection {
            contributionCalendar {
            totalContributions
            weeks {
                contributionDays {
                color
                contributionCount
                contributionLevel
                date
                }
            }
            }
        }
        }
    }
    """
    variables = '{"userName": "%s"}' % username

    body = {
        "query": query,
        "variables": variables
    }
    response = requests.post(
        "https://api.github.com/graphql",
        headers=headers,
        data=json.dumps(body)
    )
    json_data = json.loads(response.text)
    todays_contributions = json_data["data"]["user"]["contributionsCollection"]["contributionCalendar"]["weeks"][-1]["contributionDays"][-1]["contributionCount"]

    return todays_contributions


@app.get("/")
async def moby_dock(username: str, color: str = "0070b8"):
    color = f"#{color}" if all(c in hexdigits for c in color) else color

    number_of_commit = get_number_of_commits_today(username)
    number_of_containers_in_row = 5                                            # クジラの上に乗る一行のコンテナの数
    excess_containers = number_of_commit % number_of_containers_in_row         # 余ったコンテナの数
    number_of_container_rows = number_of_commit // number_of_containers_in_row # コンテナが積み重なった高さ

    y_coordinate_of_the_first_whale = 58                                       # クジラの y 座標
    for _ in range(number_of_container_rows):                                  # コミット数に応じてクジラの y 座標を調整
        y_coordinate_of_the_first_whale += 11

    y_coordinate_of_the_first_container = y_coordinate_of_the_first_whale - 35 # 一行目のコンテナの y 座標
    x_coordinate_of_the_first_container = 8                                    # 一行目のコンテナの x 座標

    # コンテナの svg リテラル
    svg_container = """
    <g transform="translate(%d.000000,%d.000000) scale(0.100000,-0.100000)" fill="%s" stroke="none">
        <path d="M65 120 l-50 -5 -1 -55 -2 -55 59 0 59 0 0 57 c0 31 -3 58 -7 60 -5 2 -30 1 -58 -2z m55 -55 l0 -45 -50 0 -50 0 0 45 0 45 50 0 50 0 0 -45z"/>
        <path d="M39 98 c-5 -16 -3 -58 3 -58 4 0 8 14 8 30 0 17 -2 30 -5 30 -3 0 -5 -1 -6 -2z"/>
        <path d="M62 70 c0 -19 2 -27 5 -17 2 9 2 25 0 35 -3 9 -5 1 -5 -18z"/>
        <path d="M92 70 c0 -19 2 -27 5 -17 2 9 2 25 0 35 -3 9 -5 1 -5 -18z"/>
    </g>
    """

    containers = [] # コンテナを格納する配列

    # コンテナが積み重なった高さの回だけ処理を繰り返す
    for _ in range(number_of_container_rows):
        # クジラの上に乗る一行のコンテナの数だけ処理を繰り返す
        for _ in range(number_of_containers_in_row):
            containers.append(svg_container % (
                x_coordinate_of_the_first_container,
                y_coordinate_of_the_first_container,
                color
            ))
            x_coordinate_of_the_first_container += 11

        # 2 行目以降のコンテナ用に座標を調整
        y_coordinate_of_the_first_container -= 11
        x_coordinate_of_the_first_container = 8

    # 余ったコンテナを並べる
    if excess_containers:
        x_coordinate_of_the_first_container = 2 # 一番上の行だけ、初期位置をずらす
        for _ in range(excess_containers):
            x_coordinate_of_the_first_container += 11
            containers.append(svg_container % (
                x_coordinate_of_the_first_container,
                y_coordinate_of_the_first_container,
                color
            ))

    # クジラとコンテナのデータ
    content = f"""
    <!DOCTYPE svg PUBLIC "-//W3C//DTD SVG 20010904//EN" "http://www.w3.org/TR/2001/REC-SVG-20010904/DTD/svg10.dtd">
    <svg version="1.0" xmlns="http://www.w3.org/2000/svg" width="99.000000pt" height="{y_coordinate_of_the_first_whale}.000000pt" viewBox="0 0 99.000000 {y_coordinate_of_the_first_whale}.000000">
        <metadata>
            Created by potrace 1.10, written by Peter Selinger 2001-2011
        </metadata>
        <g transform="translate(0.000000,{y_coordinate_of_the_first_whale}.000000) scale(0.100000,-0.100000)" fill="{color}" stroke="none">
            <path d="M744 528 c-15 -29 -20 -80 -12 -132 5 -32 -62 -38 -367 -31 -292 7 -333 7 -345 0 -11 -7 0 -104 17 -159 20 -64 80 -128 146 -157 68 -30 230 -33 322 -5 135 40 245 127 300 236 21 42 28 48 66 54 40 6 109 59 109 83 0 16 -43 34 -88 36 -31 1 -44 6 -48 20 -7 22 -63 87 -75 87 -5 0 -16 -15 -25 -32z m50 -17 c10 -11 23 -35 29 -53 12 -32 14 -33 67 -33 42 0 55 -4 55 -15 0 -21 -63 -60 -99 -60 -29 0 -35 -6 -59 -55 -51 -105 -144 -183 -268 -226 -50 -17 -89 -22 -175 -23 -104 -1 -114 1 -169 29 -66 34 -81 54 -35 47 16 -2 53 3 80 12 l51 17 26 -31 c27 -33 72 -60 99 -60 9 0 -6 15 -32 33 -51 34 -63 59 -29 65 31 6 45 22 45 51 0 33 -9 46 -37 53 -49 13 -87 -60 -48 -92 21 -18 11 -24 -13 -9 -16 10 -26 9 -55 -4 -19 -9 -58 -17 -86 -17 -49 0 -51 1 -71 40 -11 22 -24 67 -28 100 -8 51 -6 60 7 60 9 1 165 2 346 3 347 2 386 7 369 45 -13 30 -16 71 -10 107 8 40 16 43 40 16z m-436 -292 c3 -29 -18 -52 -41 -43 -36 14 -22 78 16 72 15 -2 23 -11 25 -29z"/>
            <path d="M315 220 c-8 -13 4 -32 16 -25 12 8 12 35 0 35 -6 0 -13 -4 -16 -10z"/>
        </g>

        {''.join(containers)}
    </svg>
    """

    headers = {
        "Cache-Control": "no-cache",
        "Expires": (datetime.datetime.now() + datetime.timedelta(hours=1)).strftime("%a, %d %b %Y %H:%M:%S GMT")
    }

    return Response(content=content, media_type="image/svg+xml", headers=headers)
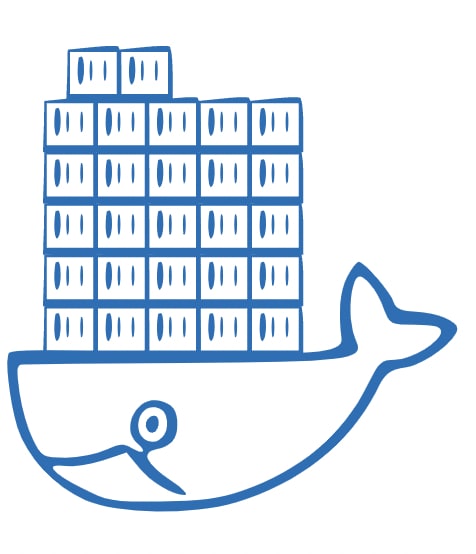
http://127.0.0.1:8000?username=ogtyにアクセスするとコンテナの数が現在のコミット数と一致しています。
デプロイ
FastAPI Heroku Templateというパブリックテンプレートリポジトリを作ったので、これを使っていきます。
「Use This Template」から、リポジトリ名を入力して「Create repository from template」をクリックして作成します。
今回は増えるコンテナということincreasing-containerとしてリポジトリを作成します。
作成したリポジトリをクローンします。
$ git clone https://github.com/ogty/increasing-container.git
$ cd increasing-container
main.pyを先ほどまとめたコードに置き換えrequirements.txtにrequests, python-dotenvを追記します。
fastapi
uvicorn
+ requests
+ python-dotenv
ここで以下のコマンドを実行して、正常に表示されていることを確認します。
$ make run
Heroku CLI をインストール
Heroku のアカウントを持っていない方は、アカウントを作成してください。
Homebrew がインストールされていない方は以下のコマンドでインストールします。
$ /bin/bash -c "$(curl -fsSL https://raw.githubusercontent.com/Homebrew/install/HEAD/install.sh)"
以下のコマンドで Heroku CLI をインストールします。
$ brew tap heroku/brew && brew install heroku
次に Heroku へログインして、アプリケーションを作成します。
$ heroku login
$ heroku create <app-name>
デプロイします(コミットには.envも含めます)
$ git add .
$ git rm --cached -r .gitignore
$ git commit -m "<commit-message>"
$ heroku git:remote -a <app-name>
$ git push heroku master
完成

最後に
単純にコンテナを重ねましたが、溢れるようなデザインも面白そうです。
Discussion