CO2 モニタリングシステム導入記録 (M5STACK, SCD41, MQTT, Prometheus, Grafana, Nginx)
はじめに
CO2濃度や温度や湿度をモニタリングしたいなーって時ありますよね。
測定器は高いし、どうせデータを自前で管理するならマイコンから触ってみよう!という感じです。
今回は、マイコン初心者が調べつつさくっと作成しました。
実際に運用しながら欠点を見つけて改善していく予定です。
*はんだ付け不要、キャリブレーション(≒感度調整)も自動なので、ハード面でのハードルは高くないはずです。
やりたいこと
最終的に以下のようなモニタリング環境を構築する手順を紹介します。
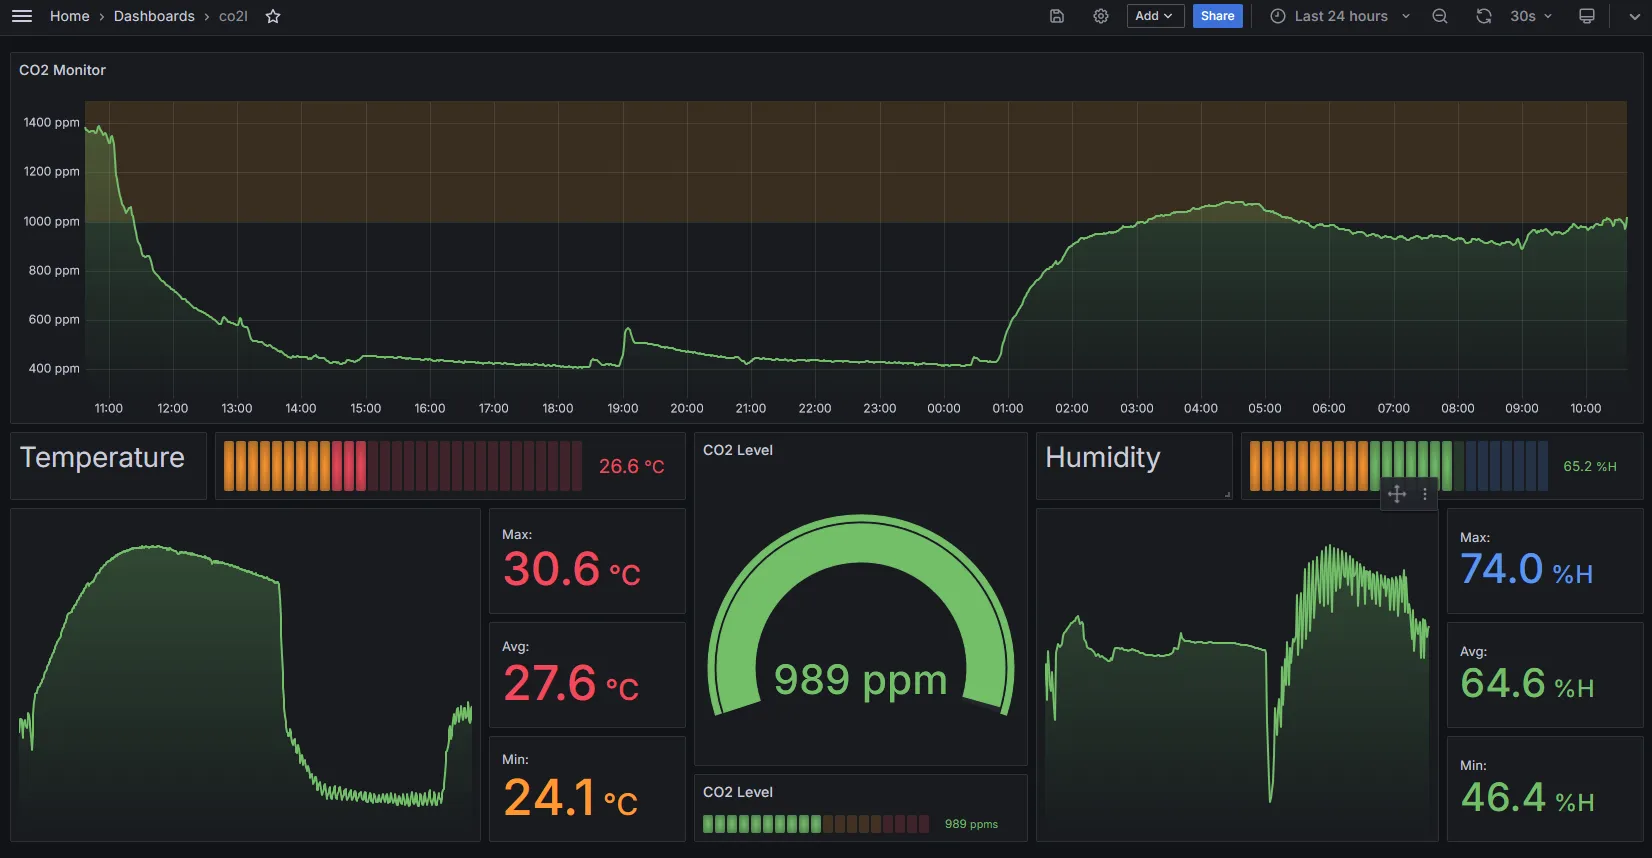
*Grafana(可視化ツール)で、こんな感じにモニター
構成概略図
マイコン, センサー選定
*本項は読み飛ばしても構いません
- マイコンボード: ATOMS3 Lite (マイコン: ESP32-S3)
- 評価ボード: CO2L Unit with Temperature and Humidity Sensor (センサー: SCD41)
選定
- 精度について:ロマン
- 簡単にセットアップ
- 小型
- 光音響効果によるセンシング。
選定過程
(簡易)CO2センサー比較表
| 名前 | メーカー | 値段 | 精度と範囲 | 耐久年数 | 測定方式 | 電源電圧範囲 | インターフェース | 応答時間 | 動作温度範囲 | 平均消費電力 | 校正方法 | リンク |
|---|---|---|---|---|---|---|---|---|---|---|---|---|
| SCD30 | Sensirion | ¥10,000 | ±(30 ppm + 3%) (400-10,000 ppm) | 15年 | NDIR | 3.3 - 5.5 V | I2C, UART, PWM | 20 s | -40 - 70°C | 19 mA | 工場校正 | SCD30 Datasheet |
| SCD40 | Sensirion | ¥6,000 | ±(50 ppm + 5%) (400-2,000 ppm) | >10年 | 光音響 (PASens®) | 2.4 - 5.5 V | I2C | 60 s | -10 - 60°C | 15 mA | 工場校正 | SCD4X Datasheet |
| SCD41 | Sensirion | ¥8,000 | 400-1,000 ppm: ±(50 ppm + 2.5%) 1,001-2,000 ppm: ±(50 ppm + 3%) 2,001-5,000 ppm: ±(40 ppm + 5%) |
>10年 | 光音響 (PASens®) | 2.4 - 5.5 V | I2C | 60 s | -10 - 60°C | 15 mA | 工場校正 | SCD4X Datasheet |
| MH-Z19B | Winsen | ¥4,000? | ±(50 ppm + 5%) (400-10,000 ppm) | >5年 | NDIR | 4.5 - 5.5 V | UART, PWM | 120 s | -10 - 50°C | 20 mA | 自動校正 | MH-Z19B Datasheet |
| MH-Z19C | Winsen | ¥2,500 | ±(50 ppm + 5%) (400-10,000 ppm) | >10年 | NDIR | 4.5 - 5.5 V | UART, PWM | 120 s | -10 - 50°C | 40 mA | 自動校正 | MH-Z19C Datasheet |
| SGP30 | Sensirion | ¥2,000 | ± 15% (TVOC), ± 10% (CO2eq) | 10年? | MOX | 1.62 - 1.98 V | I2C | 2 s | -40 - 85°C | 48 mA | 工場校正 | SGP30 Datasheet |
- gpt くんと壁打ちして作った比較表
- 値段は目安
- 各値は筆者が参照元を確認済
- 私自身が初学者のため、一般的な比較表と項目が異なる場合がある。
- 追記:校正についてだが、 強制自動キャリブレーション機能があるものもあります(SCD4X系など)。
選定の流れ
CO2モニタリングしたい(唐突)
市販のCO2計測系について調査
- 1万円以下の製品は、ガスセンサーで推測している場合があり、信頼性が低い。
- 安心できる製品は数万円以上から。
なら作るか
- データベースに書き込んでモニタリングするなら、自作がいいかも。
- コスパはいいかも?
- ロマンを追求。
センサー選定
-
MHZ19X系
- コスパが良い。自宅での使用には十分。
-
SCD系センサー
- 信頼性が高い
- 評価ボードが充実しており、入手が容易。
マイコンの選定
-
M5StackのAtomシリーズ選定理由
-
Wifi通信が可能で、色々遊べる。
-
M5公式でSCD4x系のUnit(評価ボードみたいなもの)がある。
- それと接続するため、HY2.0 4PコネクタのあるAtomシリーズが便利。
-
AtomシリーズにはAtom(無印)系とAtomS3系がある。
- 長期間使用するならWiFiやBluetoothなど新しい規格にも対応しているS3の方がいいかも
-
消費電力少ない。
-
間欠動作可
-
ATOMS3系の選定
- 無印
- ¥2,783
-
switch-science(公式代理店)
- +送料 200 円
-
switch-science(公式代理店)
- ¥2,783
- Lite
- ¥1,529
-
switch-science(公式代理店)
- +送料 200 円
-
switch-science(公式代理店)
- IMU(加速度センサーっぽいの)なし
- 液晶なし
- 液晶の寿命考えて、長期間使うってなるといらないかも?
- 測定結果の描画をボタンクリック時のみなどにすれば、液晶の寿命問題には対応できるかも。
- LEDがあるので、色を変えて状態チェックにしてもいいかも
- ¥1,529
- 無印
-
センサーの選定詳細
個人の感想です
-
SCD4Xシリーズ
- SCD40とSCD41の違い(価格、性能)を比較。
- ロマンがあるからSCD41で!
- M5公式でSCD4x系のUnit(評価ボードみたいなもの)がある。
- SCD40とSCD41の違い(価格、性能)を比較。
-
SCD30
- 性能は非常に高い。だが高価でドキュメントも少ないかも。
-
SGP30
- CO2を直接測定しているわけではないので、ロマン的に不採用。
-
H-Z19Xシリーズ
- SCD4Xがはんだづけも不要で工程も楽なのを踏まえると、今回は見送りかなぁという感じ。
- ただ、コスパが最高なのは確か。
- 今回はシステム全体の構築をしたい。センサーは今後深めていこう。
- ただ、コスパが最高なのは確か。
- SCD4Xがはんだづけも不要で工程も楽なのを踏まえると、今回は見送りかなぁという感じ。
費用(概算)の比較
-
2024年6月22日時点
- M5Stack公式サイトからの購入も検討しましたが、配送料も考慮するとSwitch-Scienceの方が僅かに安かった。円安怖い。
-
AtomS3 Liteの電気代
\begin{align*} \text{消費電力} & = 5\text{V} \times 50\text{mA} = 0.25\text{W} \\ \text{1日の消費電力量} & = 0.25\text{W} \times 24\text{時間} = 6\text{Wh} = 0.006\text{kWh} \\ \text{1日の電気代} & = 0.006\text{kWh} \times 27\text{円/kWh} = 0.162\text{円} \end{align*} -
最安費用(DigiKey+Switch-Science)
-
機器の値段
7,677(円) + 1,529(円) + 200(円) = 9,406(円) -
10 年間の電気代
0.162(円) \times 365(日) \times 10(年) = 591.3(円) -
機器 + 10 年間の電気代
9,406(円) + 591.3(円) = 9,997.3(円) -
1 年あたり
\frac{9,997.3(円)}{10(年)} = 999.73(円) -
1 ヶ月あたり
\frac{999.73(円)}{12(ヶ月)} \approx 83.31(円)
-
-
楽な購入(Switch-Scienceのみ)
-
機器の値段
8,349(円) + 1,529(円) = 9,878(円) -
10 年の電気代
0.162(円) \times 365(日) \times 10(年) = 591.3(円) -
機器 + 10 年間の電気代
9,878(円) + 591.3(円) = 10,469.3(円) -
1 年あたりの費用
\frac{10,469.3(円)}{10(年)} = 1,046.93(円) -
1 ヶ月あたりの費用
\frac{1,046.93(円)}{12(ヶ月)} \approx 87.2(円)
-
-
結論
- Switch-Scienceでいいかなぁ。
その他
- 3Dプリンターでケースを作成するのもいいかも
- SCD4xについて追記
- 光音響効果でCO2を測定するのでセンシング環境は気をつけるべきかも
tweet
- 光音響効果でCO2を測定するのでセンシング環境は気をつけるべきかも
機材用意
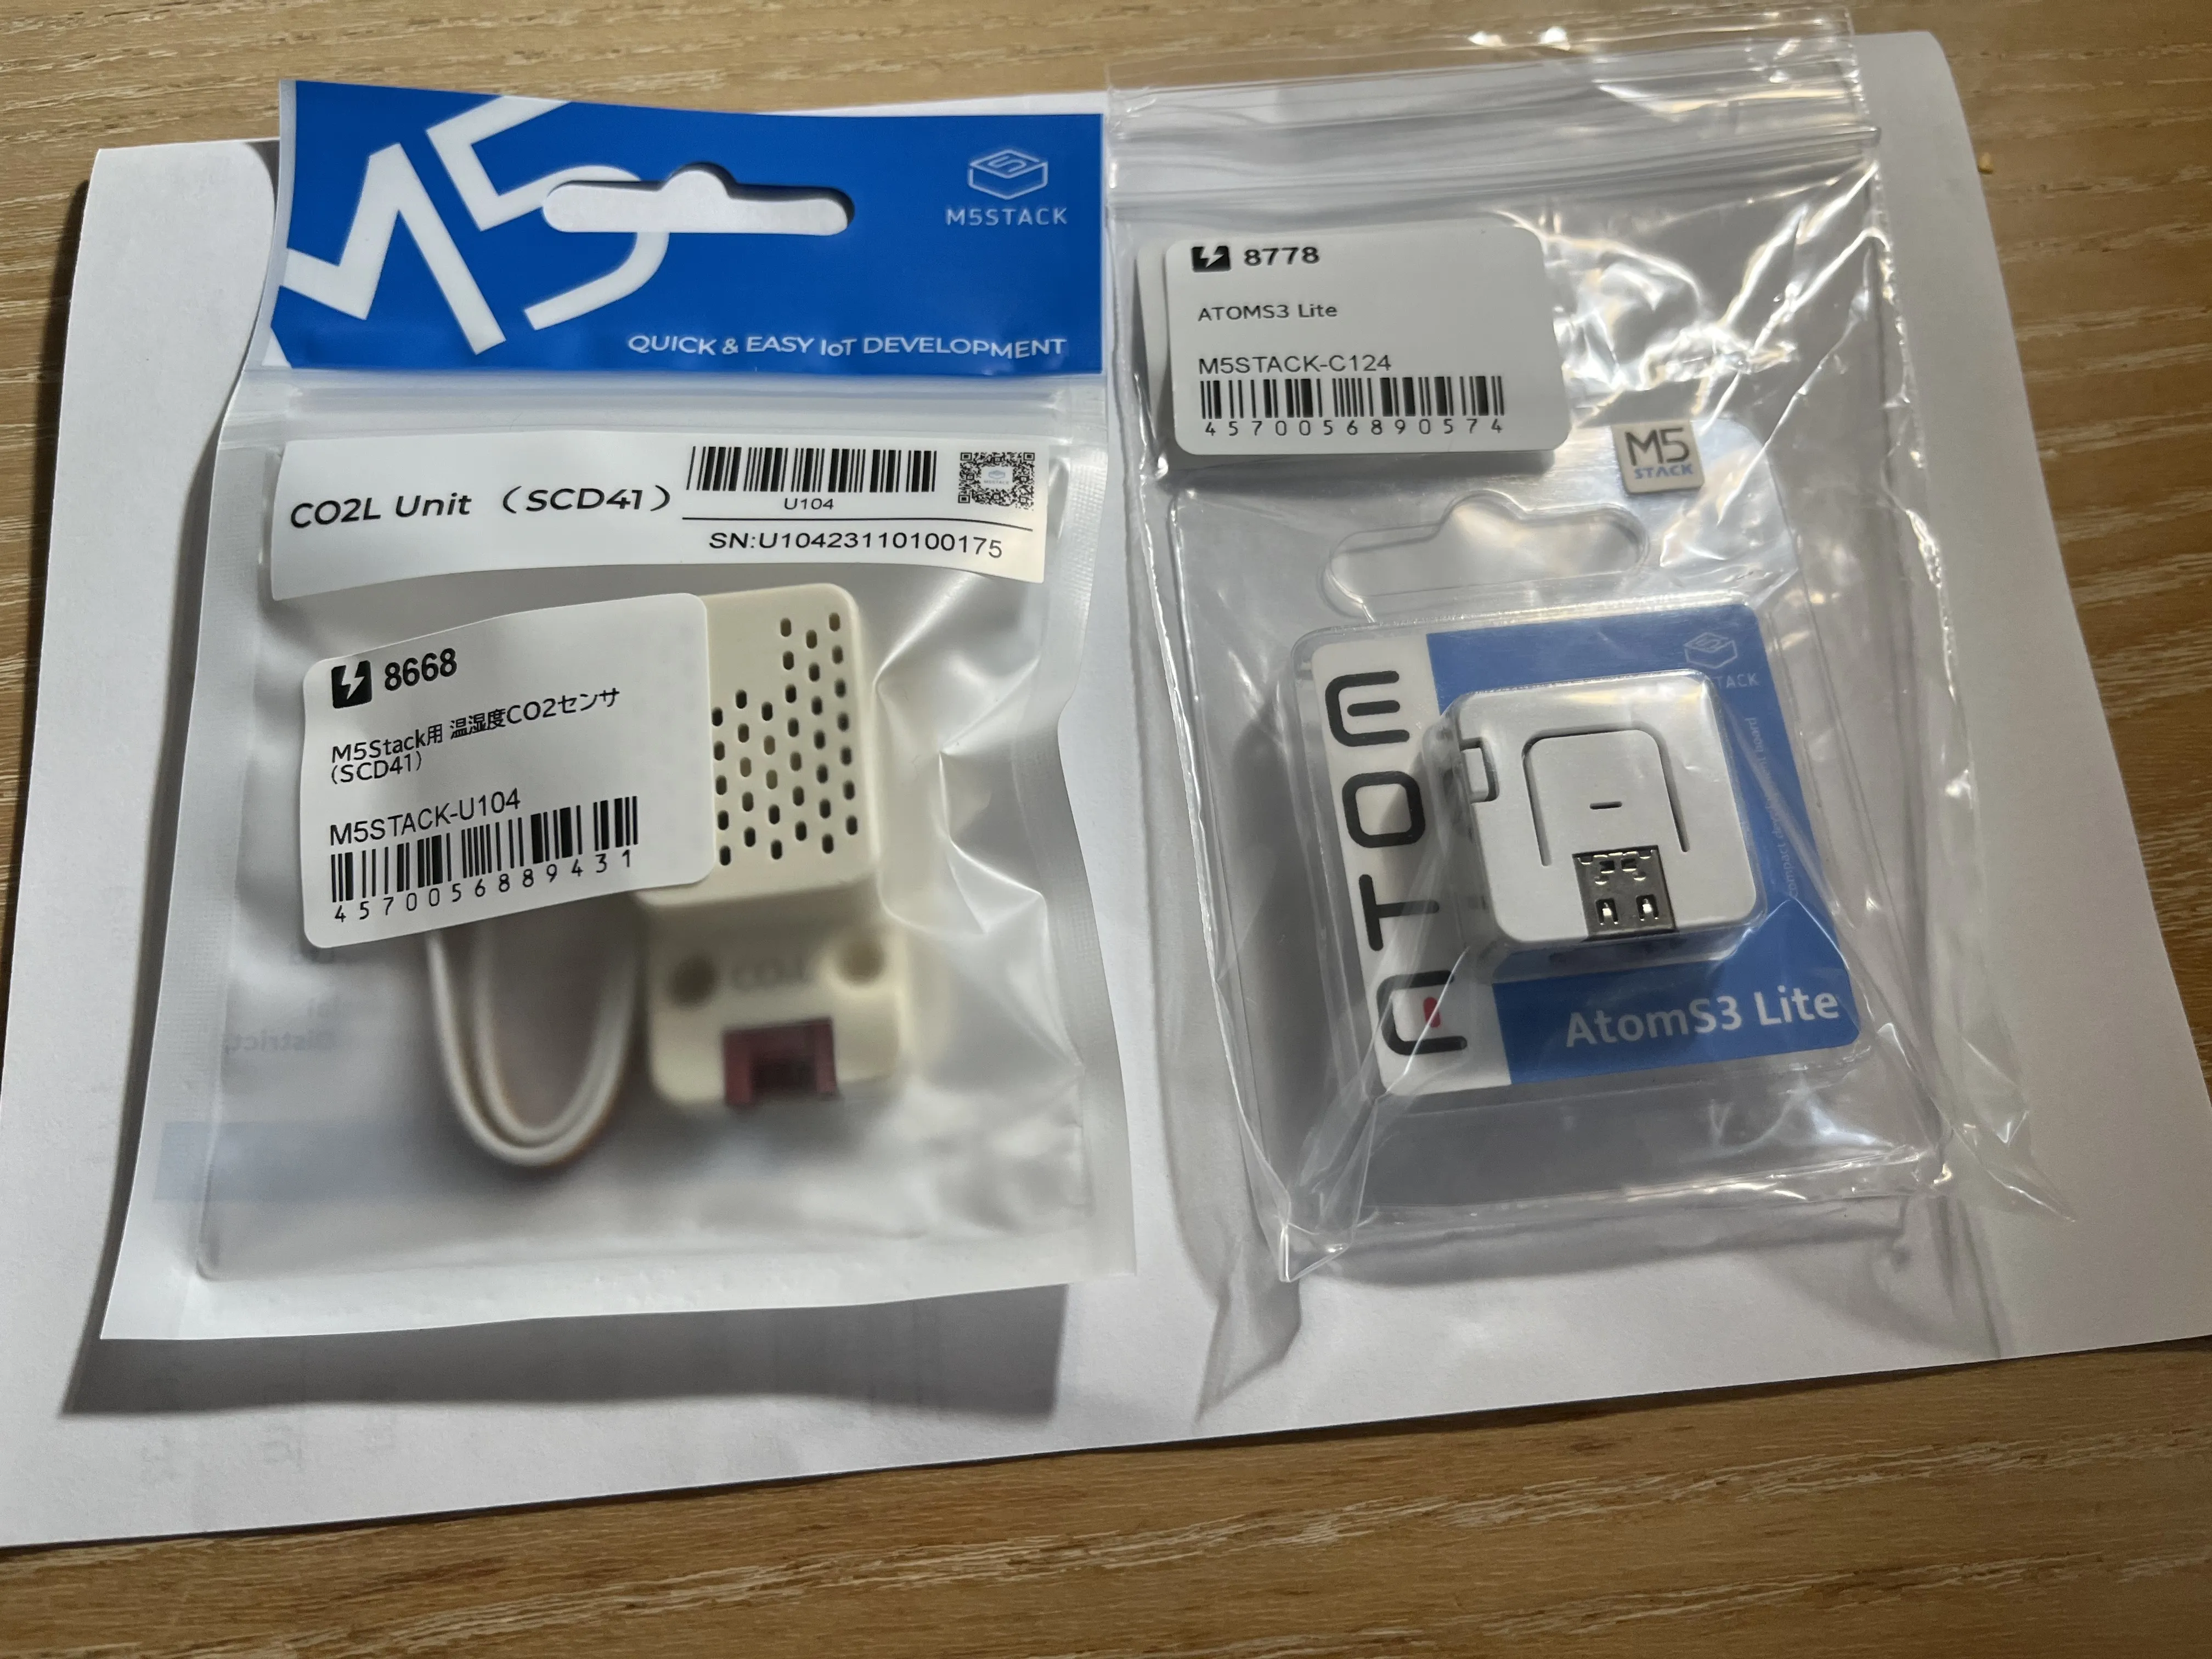
購入したもの
- U104 温湿度 CO2 センサ(SCD41)
- M5AtomS3 Lite
他に用意したもの:
- usb-cケーブル
- アダプタ
- コンピューター
- dockerなどを動かす用
- マイコンに書き込む用
- WiFi環境
マイコン動作テスト
- Arduino環境構築
- マイコンに実行ファイルを書き込み、下記のそれぞれ動作をさせて、各機能を把握。
- シリアルモニタへのprint
- LEDの点滅制御
- WiFi接続
- CO2Lセンサーからのデータ取得
コンパイル・書き込みの環境構築
AtomS3には ESP32-S3 が乗っており、公式のexampleもArduinoが多かったので、Arduinoを採用
Arduino 準備
-
Arduino IDE・Arduino CLI の準備(説明は他に譲る)
-
Arduino IDE の場合
-
その他
- GitHub Actions でコンパイルしたい人(workflows)
シリアルテスト("Hello!")
シリアルモニタに print されるかチェック
printは115200bps に統一しています。シリアルモニタ等にてご設定ください。
コード
#include <M5AtomS3.h>

void setup() {
  AtomS3.begin(true);  // Init M5AtomS3Lite.
  Serial.begin(115200);
  Serial.println("Hello, M5AtomS3!");
}

void loop() {
  Serial.println("Testing serial communication...");
  delay(1000);
}
実行結果
Hello, M5AtomS3!
Testing serial communication...
Testing serial communication...
Testing serial communication...
LED テスト
LED がプログラミング通りに点滅するかチェック
コード
/**
* 参考:
* https://github.com/m5stack/M5AtomS3/blob/main/examples/Basics/lite_led/lite_led.ino
*/

#include <M5AtomS3.h>

void setup() {
  AtomS3.begin(true);  // Init M5AtomS3Lite.
  AtomS3.dis.setBrightness(100);
}

void loop() {
  AtomS3.dis.drawpix(0xff0000); // 青
  AtomS3.update();
  delay(500);
  AtomS3.dis.drawpix(0x00ff00); // 緑
  AtomS3.update();
  delay(500);
  AtomS3.dis.drawpix(0x0000ff); // 赤
  AtomS3.update();
  delay(500);
}
実行結果
- 色が変わりつつ LED が点滅
WiFi 疎通テスト
WiFi 繋げられるかチェック
-
-
www.baidu.comの内容を print する感じだったので、www.google.comにping っぽいのをするものに修正
-
-
コードの ssid や password には各環境毎に適切なものを入れてください。
コード
/**
* 参考:
* https://github.com/m5stack/M5AtomS3/blob/main/examples/Advanced/WIFI/WiFiTCP/WiFiTCP.ino
*/

#include <M5AtomS3.h>
#include <WiFi.h>
#include <WiFiMulti.h>

// Set the name and password of the wifi to be connected.
const char* ssid     = "xxxx";
const char* password = "xxxx";
WiFiMulti WiFiMulti;

void setup() {
int sum = 0;
AtomS3.begin();  // Init M5AtomS3.
Serial.begin(115200);
Serial.println("Hello, M5AtomS3!");
WiFiMulti.addAP(ssid, password);  // Add wifi configuration information.
Serial.printf("Waiting connect to WiFi: %s ...", ssid);  // Serial port output format string.
while (WiFiMulti.run() != WL_CONNECTED) {  // If the connection to wifi is not established successfully.
    Serial.println(".");
    delay(1000);
    sum += 1;
    if (sum == 8) Serial.println("Connect failed!");
}
Serial.println("\nWiFi connected");
Serial.println("IP address: ");
Serial.println(WiFi.localIP());  // The serial port outputs the IP address of the M5AtomS3.
delay(500);
}


void loop() {
const char* host = "www.google.com";  // Set the IP address or DNS of the TCP server.
const uint16_t port = 80;  // The port of the TCP server is specified.

WiFiClient client;
if (!client.connect(host, port)) {  // Connect to the server. 0 is returned if the connection fails.
    Serial.println("Ping failed.\nWaiting 5 seconds before retrying...\n");
    delay(5000);
    return;
} else {
    Serial.println("Ping successful.");
    client.stop();
}
delay(5000);
}
実行結果
Hello, M5AtomS3!
Waiting connect to WiFi: xxxx ...
WiFi connected
IP address:
xxx.xxx.xxx.xxx
Connecting to: www.google.com
Ping successful.
co2l データ取得テスト
コード
/**
* 参考:
* https://github.com/m5stack/M5Unit-ENV/blob/master/examples/Unit_CO2_M5AtomS3Lite/Unit_CO2_M5AtomS3Lite.ino
*/

#include "M5UnitENV.h"

SCD4X scd4x;

void setup() {
  Serial.begin(115200);

  if (!scd4x.begin(&Wire, SCD4X_I2C_ADDR, 2, 1, 400000U)) {
      Serial.println("Couldn't find SCD4X");
      while (1) delay(1);
  }

  uint16_t error;
  // stop potentially previously started measurement
  error = scd4x.stopPeriodicMeasurement();
  if (error) {
      Serial.print("Error trying to execute stopPeriodicMeasurement(): ");
  }

  // Start Measurement
  error = scd4x.startPeriodicMeasurement();
  if (error) {
      Serial.print("Error trying to execute startPeriodicMeasurement(): ");
  }

  Serial.println("Waiting for first measurement... (5 sec)");
}

void loop() {
  if (scd4x.update())  // readMeasurement will return true when
                      // fresh data is available
  {
      Serial.println();

      Serial.print(F("CO2(ppm):"));
      Serial.print(scd4x.getCO2());

      Serial.print(F("\tTemperature(C):"));
      Serial.print(scd4x.getTemperature(), 1);

      Serial.print(F("\tHumidity(%RH):"));
      Serial.print(scd4x.getHumidity(), 1);

      Serial.println();
  } else {
      Serial.print(F("."));
  }

  delay(1000);
}
Tips
-
M5AtomS3 の側面にあるボタンを長押しすると初期化される
-
次のエラーは無視でも OK (github-issue)
# pragma message "No hardware SPI pins defined. All SPI access will default to bitbanged output"``` -
シリアルテストが書き込んだうえで反映されなかった場合、arduino を閉じ、一度 pc から usb を抜いてもう一度指したあとにシリアルモニタを開いてみよう。
-
WiFiのパスワードのハッシュ化(参考)
- セキュリティを考えるなら他の選択肢として、VLAN 構築、アクセスや帯域制限、IOT 間メッシュネットワークの構築など、色々ある。
サーバー側 (docker)の準備
-
本項では以下のコンテナをセットアップ
- prometheus
- mosquitto
- mqtt2prometheus
- Grafana
-
備考:
- port 解放、ネットワーク接続、docker インストールなどは省略。
-
追記:
- docker composeで作りたい方はこちらまで
docker network
docker network create mqtt_network
prometheus
install
-
prometheus.yml
global: scrape_interval: 30s scrape_configs: - job_name: "prometheus" static_configs: - targets: ["localhost:9090"] - job_name: "mqtt2prometheus" static_configs: - targets: ["mqtt2prometheus:9641"] -
pull
docker pull prom/prometheus -
run
用意した prometheus.yml ファイルと同じディレクトリで
docker run -d --name prometheus --network mqtt_network -p 9090:9090 -v $(pwd)/prometheus.yml:/etc/prometheus/prometheus.yml prom/prometheus外部からブラウザ経由でデータをチェックしたい、とかがなければ
-p 9090:9090は要らない。ただ、今回は prometheus までデータが流れている、などのチェックできるのでおすすめ。
mosquitto
-
mosquitto.conf
listener 1883 allow_anonymous true max_queued_messages 0 -
pull
docker pull eclipse-mosquitto -
run
用意した mosquitto.conf ファイルと同じディレクトリ
docker run -d --name mosquitto --network mqtt_network -p 1883:1883 -v $(pwd)/mosquitto.conf:/mosquitto/config/mosquitto.conf eclipse-mosquitto
mqtt2prometheus
-
config.yaml
mqtt: server: tcp://mosquitto:1883 topic_path: sensor/+/data device_id_regex: "sensor/(?P<deviceid>[^/]+)/data" qos: 0 cache: timeout: 24h metrics: - prom_name: temperature mqtt_name: temperature help: "Temperature sensor reading, CO2L" type: gauge - prom_name: humidity mqtt_name: humidity help: "Humidity sensor reading, CO2L" type: gauge - prom_name: co2 mqtt_name: co2 help: "CO2 sensor reading, CO2L" type: gauge- regexやtopic_path次第でlocation情報なども入れられるので、今後追加を検討
-
pull
docker pull ghcr.io/hikhvar/mqtt2prometheus:latest -
run
用意した mosquitto.conf ファイルと同じディレクトリ
docker run -d --name mqtt2prometheus --network mqtt_network -v $(pwd)/config.yaml:/config.yaml -p 9641:9641 ghcr.io/hikhvar/mqtt2prometheus:latest
Grafana
- run
docker run -d --name grafana --network mqtt_network -p 3000:3000 grafana/grafana-enterprise
mqtt でデータが書き込めるかチェック
クライアントから mqtt プロトコルでデータを送信し、Prometheus まで届くのか確認をする。
概略図
mqtt server test
- mqtt 通信をしてみる。個人的に python が楽なので python で書いた。
- コードのbrokerのところにはmosquittoを動かしているサーバーのipアドレス。
サンプルコード
import paho.mqtt.client as mqtt

# MQTTブローカーの設定
broker = "xxxxxx"
port = 1883
topic = "sensor/sdc41/data"

client_id = "test"

# 送信するメッセージ
payload = '{"temperature": 29.5, "humidity": 60, "co2": 1000}'


# MQTTクライアントのコールバック設定
def on_connect(client, userdata, flags, rc):
  print("Connected with result code " + str(rc))
  # メッセージを送信
  client.publish(topic, payload)


def on_publish(client, userdata, mid):
  print("Message Published")
  client.disconnect()


# MQTTクライアントの初期化
client = mqtt.Client(mqtt.CallbackAPIVersion.VERSION1, client_id)

# コールバックの割り当て
client.on_connect = on_connect

client.on_publish = on_publish

# ブローカーへの接続
client.connect(broker, port, 60)

# ループ開始
client.loop_forever()
実行
- venvで仮想環境をつくってから、実行。
python -m venv --prompt="$(basename "$PWD")" .venv
pip install paho-mqtt requests
source .venv/bin/activate
python mqtt_server_test.py
Prometheus 設定
-
ブラウザで
http://xxxxx:9090にアクセス。 -
mqtt2prometheus と Prometheus の疎通チェック
- Targets ページに遷移。左側のメニューから「Status」→「Targets」を選択し、mqtt2prometheus のターゲットが UP 状態であることを確認。
-
Graph ページで確認:
「Graph」タブに移動し、クエリフィールドに以下のように入力して、メトリクスが収集されているか確認。temperature -
Prometheus に届いていないとき。
- docker ps で動いているかチェック
- 実行後に、mosquitto の docker logs を見て届いているかチェック
- mqtt2prometheus の docker logs を見る
co2l から mqtt 通信をしてみる
co2l
コード
- intervalは30秒にしてます。
#include <M5AtomS3.h>
#include "M5UnitENV.h"
#include <WiFi.h>
#include <PubSubClient.h>
#include <WiFiMulti.h>
#include <ArduinoJson.h>

#define DEBUG 1  // Set to 1 to enable debug prints, 0 to disable

#if DEBUG
    #define DEBUG_PRINT(x)  Serial.print(x)
    #define DEBUG_PRINTLN(x)  Serial.println(x)
    #define DEBUG_PRINTF(...)  Serial.printf(__VA_ARGS__)
#else
    #define DEBUG_PRINT(x)
    #define DEBUG_PRINTLN(x)
    #define DEBUG_PRINTF(...)
#endif

WiFiClient espClient;
PubSubClient client(espClient);

// Set the name and password of the wifi to be connected.
const char* ssid     = "xxxx";
const char* password = "xxxx";
const char* mqtt_server = "xxx.xxx.xxx.xxx";
WiFiMulti WiFiMulti;

int interval = 30000;

SCD4X scd4x;

unsigned long lastMsg = 0;
#define MSG_BUFFER_SIZE (128)
char msg[MSG_BUFFER_SIZE];

void setupWifi();
void callback(char* topic, byte* payload, unsigned int length);
void reConnect();

void setup() {
    int sum = 0;
    AtomS3.begin(true);
    Serial.begin(115200);

    DEBUG_PRINTLN("Hello! This is M5AtomS3 with CO2L!");
    WiFiMulti.addAP(ssid, password);
    DEBUG_PRINTF("Waiting connect to WiFi: %s ...", ssid);  // Serial port output format string.
    while (WiFiMulti.run() != WL_CONNECTED) {
        DEBUG_PRINTLN(".");
        delay(1000);
    }
    DEBUG_PRINTLN("\nWiFi connected");
    DEBUG_PRINTLN("IP address: ");
    DEBUG_PRINTLN(WiFi.localIP());
    delay(500);

    if (!scd4x.begin(&Wire, SCD4X_I2C_ADDR, 2, 1, 400000U)) {
        DEBUG_PRINTLN("Couldn't find SCD4X");
        while (1) delay(1);
    }

    uint16_t error;
    // stop potentially previously started measurement
    error = scd4x.stopPeriodicMeasurement();
    if (error) {
        DEBUG_PRINT("Error trying to execute stopPeriodicMeasurement(): ");
    }

    // Start Measurement
    error = scd4x.startPeriodicMeasurement();
    if (error) {
        DEBUG_PRINT("Error trying to execute startPeriodicMeasurement(): ");
    }

    DEBUG_PRINTLN("Waiting for first measurement... (5 sec)");

    setupWifi();
    client.setServer(mqtt_server, 1883);  // Sets the server details
    client.setCallback(callback);  // Sets the message callback function
}

void loop() {
    if (!client.connected()) {
        reConnect();
    }
    client.loop();  // This function is called periodically to process incoming messages and maintain connections to the server

    if (scd4x.update()) {
        float co2 = scd4x.getCO2();
        float temperature = scd4x.getTemperature();
        float humidity = scd4x.getHumidity();

        // JSONバッファのサイズを計算
        StaticJsonDocument<256> doc;

        doc["co2"] = co2;
        doc["temperature"] = temperature;
        doc["humidity"] = humidity;

        serializeJson(doc, msg, MSG_BUFFER_SIZE);
        DEBUG_PRINT("Publish co2l: ");
        DEBUG_PRINTLN(msg);
        client.publish("sensor/co2l/data", msg);
    }

    delay(interval);  // Wait for 2 seconds before next reading
}

void setupWifi() {
    delay(10);
    DEBUG_PRINTF("Connecting to %s", ssid);
    WiFi.mode(WIFI_STA);  // Set the mode to WiFi station mode
    WiFi.begin(ssid, password);  // Start WiFi connection

    while (WiFi.status() != WL_CONNECTED) {
        delay(500);
        DEBUG_PRINT(".");
    }
    DEBUG_PRINTF("Success");
}

void callback(char* topic, byte* payload, unsigned int length) {
    DEBUG_PRINT("Message arrived [");
    DEBUG_PRINT(topic);
    DEBUG_PRINT("] ");
    for (int i = 0; i < length; i++) {
        DEBUG_PRINT((char)payload[i]);
    }
    DEBUG_PRINTLN();
}

void reConnect() {
    while (!client.connected()) {
        DEBUG_PRINT("Attempting MQTT connection...");
        // Create a random client ID
        String clientId = "M5Stack-";
        clientId += String(random(0xffff), HEX);
        // Attempt to connect
        if (client.connect(clientId.c_str())) {
            DEBUG_PRINTLN("connected");
            // Once connected, publish an announcement to the topic
            client.publish("M5Stack/ENV", "hello world");
            // Resubscribe to the topic
            client.subscribe("M5Stack/ENV");
        } else {
            DEBUG_PRINT("failed, rc=");
            DEBUG_PRINT(client.state());
            DEBUG_PRINTLN(" try again in 5 seconds");
            delay(5000);
        }
    }
}
- SCD41 が間欠動作対応なので、将来的にはディープスリープを使うのも面白そう。
Prometheus
- データを受け取れたかチェック。
データを Grafana でみる
Grafana
-
http://xxxxxxxx:3000にアクセス -
ログイン
- default の login は
- user: admin
- pass: admin
- default の login は
-
ログイン後、左側のメニューから「設定 (Configuration)」を選択し、「データソース (Data Sources)」をクリック。
-
「データソースの追加 (Add data source)」ボタンをクリック。
-
リストから「Prometheus」を選択。
-
「URL」フィールドに
http://prometheus:9090を入力。(docker network を設定していなければ、http://localhost:9090) -
「Save & Test」ボタンをクリック。成功すれば「Data source is working」と表示される。
-
dashboard を作成し、好きなように配置。
- 私はこれimport して、参考にした。
nginx で grafana をリバースプロキシしたい人
*nginxのセットアップの説明は省きます。
-
https://${domain}/grafanaで見られたら嬉しいとか色々ありますよね。色々考慮して nginx 側でやりたいなぁってのはあると思います。
config 変更
- 公式 doc(ここが基本)
nginx
-
nginx の conf にこんな感じのを足す。
map $http_upgrade $connection_upgrade { default upgrade; '' close; } upstream grafana { server localhost:3000; } server { ...(省略) location /grafana/ { rewrite ^/grafana/(.*) /$1 break; proxy_set_header Host $host; proxy_pass http://grafana; } location /grafana/api/live/ { rewrite ^/grafana/(.*) /$1 break; proxy_http_version 1.1; proxy_set_header Upgrade $http_upgrade; proxy_set_header Connection $connection_upgrade; proxy_set_header Host $host; proxy_pass http://grafana; } ...(省略) }- 次にnginx を再起動してconfigを適用
Grafana
-
grafana.ini にこういうのを加える
[server] root_url = %(protocol)s://%(domain)s/grafana/-
デフォルトは、protocol=http, domain=localhost
-
書き込むときは、docker copy で, grafana内の
/etc/grafana/grafana.ini書き込み、そのあと再起動例: docker内の
/etc/grafana/grafana.iniを./grafana.iniにコピーする。docker cp grafana:/etc/grafana/grafana.ini ./grafana.ini例: ローカルにある
grafana.iniのものを/etc/grafana/grafana.iniに書き込み、再起動docker cp ./grafana.ini grafana:/etc/grafana/grafana.ini && docker restart grafana- エラーが起きたら
docker logs <container>とか見よう。
- エラーが起きたら
-
-
http(s)://${domain}/grafanaで grafana が見える!- 備考:nginxのconfとgrafana.iniに少し書き加えればnginxとGrafana間でSSL通信(https)もできる。
追記
docker-compose
docker composeにしたので、追記。
prometheusとgrafanaを外部ボリュームにした以外は、上記の記事の内容と変更なし。
tree
こんな感じのtree
 ❯ tree
.
├── README.md
├── docker-compose.yml
├── grafana
│   ├── grafana.ini
├── mosquitto
│   └── config
│       └── mosquitto.conf
├── mqtt2prometheus
│   └── config.yaml
└── prometheus
    └── prometheus.yml
docker-compose.yml
services:
  prometheus:
    image: prom/prometheus
    container_name: prometheus
    networks:
      - mqtt_network
    ports:
      - "9090:9090"
    volumes:
      - ./prometheus/prometheus.yml:/etc/prometheus/prometheus.yml
      - prometheus_data:/prometheus

  mosquitto:
    image: eclipse-mosquitto
    container_name: mosquitto
    networks:
      - mqtt_network
    ports:
      - "1883:1883"
    volumes:
      - ./mosquitto/config/mosquitto.conf:/mosquitto/config/mosquitto.conf

  mqtt2prometheus:
    image: ghcr.io/hikhvar/mqtt2prometheus:latest
    container_name: mqtt2prometheus
    networks:
      - mqtt_network
    ports:
      - "9641:9641"
    volumes:
      - ./mqtt2prometheus/config.yaml:/config.yaml

  grafana:
    image: grafana/grafana-enterprise
    container_name: grafana
    networks:
      - mqtt_network
    ports:
      - "3000:3000"
    volumes:
      - ./grafana/grafana.ini:/etc/grafana/grafana.ini
      - grafana_data:/var/lib/grafana

networks:
  mqtt_network:
    driver: bridge

volumes:
  prometheus_data:
    external: true
  grafana_data:
    external: true
コマンド
# 永続性のためにprometheusとgrafanaは外部ボリューム
docker volume create prometheus_data
docker volume create grafana_data
docker compose up -d
おわりに
お疲れ様でした!
個人的には楽しかったです。現実逃避として取り組んだのですぐ終わってしまいましたが、改善点はまだまだあるので、ちょくちょく触っていこうかなーという気分です。
では!
Discussion