線形SVMをシンプルに実装する
TL;DR
- SVMを実装している記事はあまり見かけなかったのでpythonで実装してみました。
- SVMの主問題を、L2正則化経験リスク最小化問題として勾配降下法で解きます。
- 計算速度はscikit-learnのSVCのような工夫されたアルゴリズムには及びません。
本記事が実装するSVM
2クラス分類を行う、基本的なソフトマージンSVMの実装を行います。
基本的なソフトマージンSVMは一次関数で分類するため、線形SVMとも呼ばれます。
実装はこちらにあります。
カーネル関数を取り入れたソフトマージンSVMであるカーネルSVMは次回実装します。
カーネルSVMの記事はこちらにあります。
SVMのざっくりとした理論
特徴量
この一次関数に対して、クラスが
ここで、より予測精度の高い一次関数を引くには、重み
一般にクラスを分類する境界
分類境界を挟んで2つのクラスがどれくらい離れているかをマージンと呼びます。
SVM(サポートベクトルマシン)はこのマージンを最大化することで、より予測精度の高い一次関数を求めます。
さて、今、簡単のために特徴量
すると、識別境界は
と簡潔に表すことができます。
ハードマージンSVMの主問題
データセットがある一次関数でクラスを完全に分離できるとき、それを線形分離可能であるといいます。データセットを線形分離可能であると仮定したときのSVMをハードマージンSVMと呼びます。
ハードマージンSVMの主問題は次のように表せます。
ソフトマージンSVMの主問題
一般にデータセットが線形分離可能であることは少ないです。そのため、
定数
ソフトマージンSVMと経験リスク最小化
ここから一般的にSVMを解くために用いられる手法とは違うものになります。
人工変数
この同値関係から、ソフトマージンSVMの主問題は次のように書き換えることができます。
ここで、
すると、この式は、深層学習でも用いられている正則化経験リスク最小化(Empirical risk minimazation)と呼ばれる手法と一致します。
ソフトマージンSVMと最急降下法
ソフトマージンSVMの最小化問題を解く方法の一つとして、経験リスク
つまり、
このステップを十分に繰り返すことで、重み
ここで、経験リスク
ソフトマージンSVMの実装
単純な実装
さて、実装としては、ソフトマージンSVMと最急降下法の部分をプログラムに書き起こせば良いことになります。
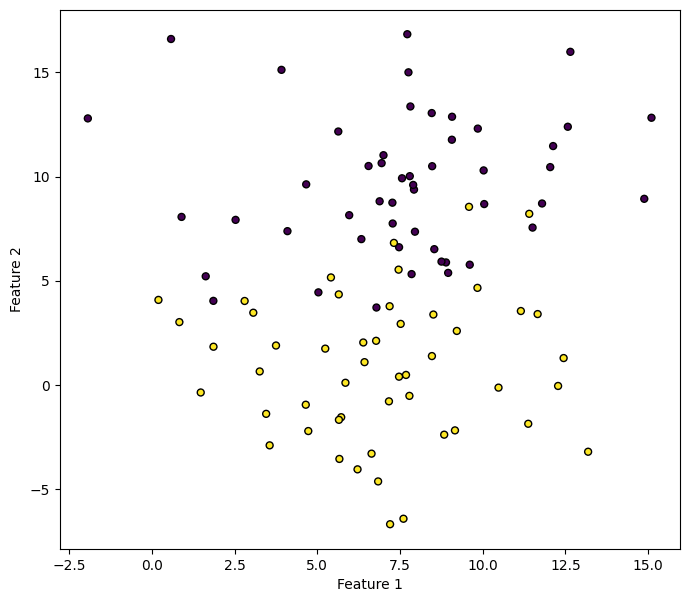
まず、次のようなデータセットを用意しました。
import numpy as np
import matplotlib.pyplot as plt
from sklearn.datasets import make_blobs


np.random.seed(42)

N = 100
n_features = 2
X, y = make_blobs(random_state=8,
                  n_samples=N,
                  n_features=n_features,
                  cluster_std=3,
                  centers=2)

y = y * 2 - 1 # change y_i {0, 1} to {-1, 1}

plt.figure(figsize=(8, 7))
plt.scatter(X[:, 0], X[:, 1], marker='o', c=y, s=25, edgecolor='k')
plt.xlabel("Feature 1")
plt.ylabel("Feature 2")
plt.plot()

次に、ソフトマージンSVMを実装します。
import numpy.linalg as LA


X = np.c_[X, np.ones(X.shape[0])] # set bias

# regularization parameter
lam = 0.01

# empirical risk
R = lambda w_t: 0.5 * lam * LA.norm(w_t, ord=2)**2 + np.where(1 - y * (X @ w_t) >= 0, 1 - y * (X @ w_t), 0).mean()

# gradient of empirical risk
dR = lambda w_t: lam * w_t + ((np.where(1 - y * (X @ w) >= 0, 1, 0) * -y).reshape(-1, 1) * X).mean(axis=0)

# learning rate
learning_rate = 0.01

# amount of iteration
n_iters = 5000

# weights
w = np.ones((X.shape[1]))

# gradient descent
for i in range(n_iters):
    w = w - learning_rate * dR(w)
    if (i + 1) % 1000 == 0:
        print(f"{i+1:4}: R(w) = {R(w)}")

print(f"weights: {w}")
# 1000: R(w) = 0.2580498763840658
# 2000: R(w) = 0.2518440922366277
# 3000: R(w) = 0.25032312599721734
# 4000: R(w) = 0.24936754026280172
# 5000: R(w) = 0.24909738755742183
# weights: [ 0.08554331 -0.4618898   1.69628161]
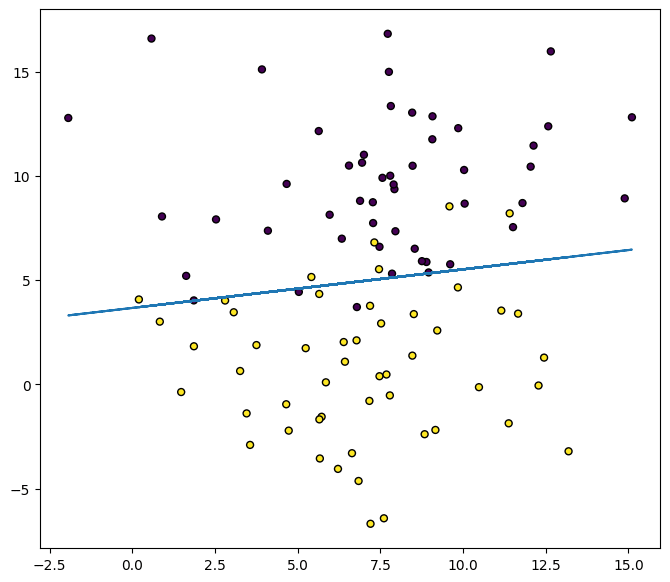
次のようにクラスを分離していることがわかります。
plt.figure(figsize=(8, 7))

plt.scatter(X[:, 0], X[:, 1], marker='o', c=y, s=25, edgecolor='k')

# w0*x + w1*y + w2 = 0
# y = - (w0*x + w2) / w1
plt.plot(X[:, 0], - (w[0] * X[:, 0] + w[2]) / w[1])

sklearn-APIに近い実装
単純な実装では訓練データとテストデータが分かれておらず、機械学習のモデルとしては不十分です。
より実用的である、scikit-learnのAPIに近い実装は次のようになります。
import numpy as np
import numpy.linalg as LA


class LinearSVM:
    def __init__(
        self,
        lam: float = 0.01,
        n_iters: int = 5000,
        learning_rate: float = 0.01,
        bias=True,
        verbose=False,
    ):
        """Linear Support Vector Machine (SVM) for Binary Classification.

        Parameters
        ----------
        lam : float, default=0.01
            Regularization parameter.
        n_iters : int, default=5000
            Number of iterations for the gradient descent.
        learning_rate : float, default=0.01
            Learning rate for the gradient descent.
        bias : bool, default=True
            Whether to include a bias term in the input matrix.
        verbose : bool, default=False
            If True, print progress messages during the gradient descent.
        """
        self.lam = lam
        self.n_iters = n_iters
        self.learning_rate = learning_rate
        self.bias = bias
        self.verbose = verbose
        self._classes = {}
        self._w = None

    # Calculate the empirical risk function.
    def _empirical_risk(
        self, X: np.ndarray, y: np.ndarray, w_t: np.ndarray
    ) -> np.ndarray:
        regularzation = 0.5 * self.lam * LA.norm(w_t, ord=2) ** 2
        loss = np.where(1 - y * (X @ w_t) >= 0, 1 - y * (X @ w_t), 0).mean()

        return regularzation + loss

    # Calculate the gradient of the empirical risk function.
    def _empirical_risk_grad(
        self, X: np.ndarray, y: np.ndarray, w_t: np.ndarray
    ) -> np.ndarray:
        regularzation_grad = self.lam * w_t
        loss_grad = (
            (np.where(1 - y * (X @ w_t) >= 0, 1, 0) * -y).reshape(-1, 1) * X
        ).mean(axis=0)

        return regularzation_grad + loss_grad

    def fit(self, X: np.ndarray, y: np.ndarray):
        """Fit the Linear SVM model according to the given training data.

        Parameters
        ----------
        X : numpy.ndarray of shape (n_samples, n_features)
            Training vectors, where `n_samples` is the number of samples
            and `n_features` is the number of features.

        y : numpy.ndarray of shape (n_samples,)
            Class labels in classification.

        Returns
        -------
        self : object
            Fitted estimator.
        """
        # validate and change class labels
        classes = np.unique(y)
        if len(classes) != 2:
            raise ValueError("Class labels is not binary")
        self._classes[-1] = classes[0]
        self._classes[1] = classes[1]
        y = np.where(y == self._classes[1], 1, -1)

        if self.bias:
            X = np.c_[X, np.ones(X.shape[0])]

        # weights
        w = np.ones(X.shape[1])

        # gradient descent
        for i in range(self.n_iters):
            w = w - self.learning_rate * self._empirical_risk_grad(X, y, w)
            if self.verbose and (i + 1) % 1000 == 0:
                print(f"{i+1:4}: R(w) = {self._empirical_risk(X, y, w)}")
        self._w = w

    def decision_function(self, X: np.ndarray) -> np.ndarray:
        """Evaluate the decision function for the samples in X.

        Parameters
        ----------
        X : numpy.ndarray of shape (n_samples, n_features)
            The input samples.

        Returns
        -------
        y_score : ndarray of shape (n_samples,)
            Returns the decision function of the sample for each class in the model.
            The decision function is calculated based on the class labels 1 and -1.
        """
        if self.bias:
            X = np.c_[X, np.ones(X.shape[0])]
        y_score = X @ self._w

        return y_score

    def predict(self, X: np.ndarray) -> np.ndarray:
        """Perform classification on samples in X.

        Parameters
        ----------
        X : numpy.ndarray of shape (n_samples, n_features)

        Returns
        -------
        y_pred : ndarray of shape (n_samples,)
            Class labels for samples in X.
        """
        y_score = self.decision_function(X)
        y_pred = np.where(y_score > 0, 1, -1)
        y_pred = np.where(y_pred == 1, self._classes[1], self._classes[-1])

        return y_pred
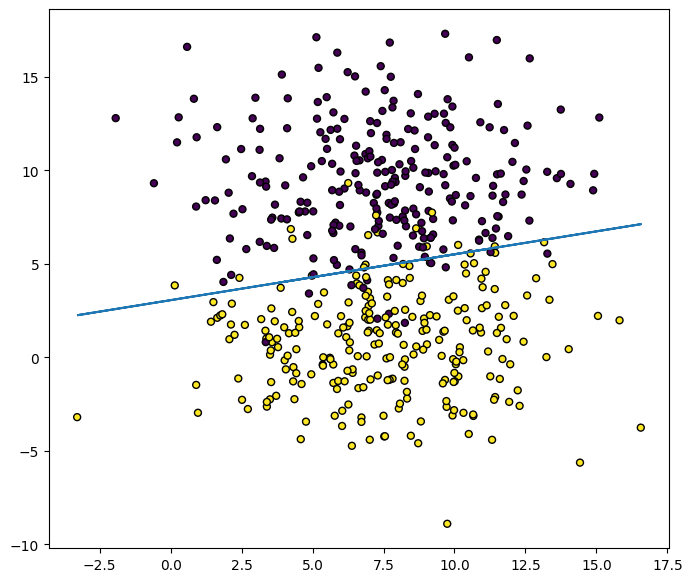
実際に使ってみましょう。
from sklearn.model_selection import train_test_split
from sklearn.metrics import accuracy_score


np.random.seed(42)

N = 500
n_features = 2
X, y = make_blobs(random_state=8,
                  n_samples=N,
                  n_features=n_features,
                  cluster_std=3,
                  centers=2)

y = y * 2 - 1 # change y_i {0, 1} to {-1, 1}

X_train, X_test, y_train, y_test = train_test_split(X, y)

model = LinearSVM()
model.fit(X_train, y_train)
preds = model.predict(X_test)

print(f"ACC: {accuracy_score(y_test, preds)}")
# ACC: 0.936

plt.figure(figsize=(8, 7))
plt.scatter(X[:, 0], X[:, 1], marker='o', c=y, s=25, edgecolor='k')
w = model._w
# w0*x + w1*y + w2 = 0
# y = - (w0*x + w2) / w1
plt.plot(X[:, 0], - (w[0] * X[:, 0] + w[2]) / w[1])

正解率がACC: 0.936となり、うまく予想できています。
線形SVMの限界
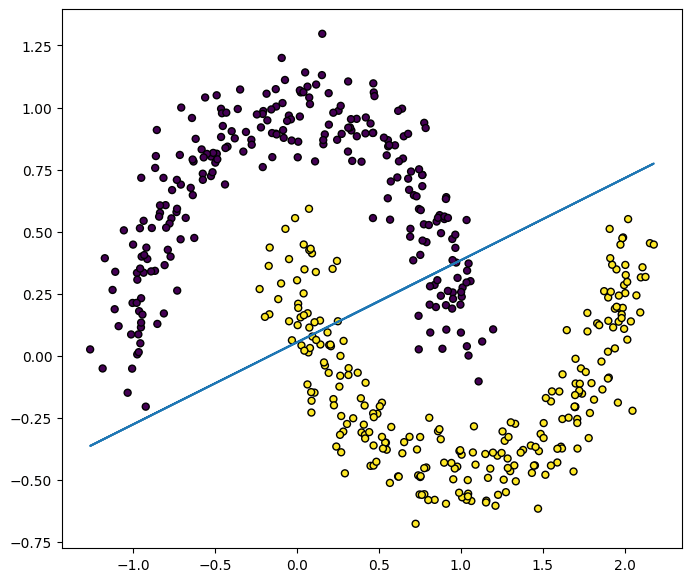
例えば次のようなmoonデータセットで予測してみましょう。
from sklearn.datasets import make_moons

N = 500
n_features = 2
X, y = make_moons(n_samples=N, noise=0.1, random_state=1)
y = y * 2 - 1 # change y_i {0, 1} to {-1, 1}
X_train, X_test, y_train, y_test = train_test_split(X, y)

model = LinearSVM()
model.fit(X_train, y_train)
preds = model.predict(X_test)

print(f"ACC: {accuracy_score(y_test, preds)}")
# ACC: 0.896

plt.figure(figsize=(8, 7))
plt.scatter(X[:, 0], X[:, 1], marker='o', c=y, s=25, edgecolor='k')
w = model._w
plt.plot(X[:, 0], - (w[0] * X[:, 0] + w[2]) / w[1])

正解率はACC: 0.896とそこまで悪くはありませんが、実際の分類境界を見ると、データセットの分布に沿った境界にはなっていません。
このように、上で扱った一次関数で分離するSVM(線形SVM)では限界があります。
この限界を解消するために、カーネル関数を用いたSVM(カーネルSVM)があります。この実装は次回の記事で紹介したいと思います。
次回のカーネルSVMの記事はこちらにあります。
Discussion